

Introduction
The importance of the stock market in the development of the economy of a country can be directly linked to the governance, appropriate and effective regulatory framework designed by the policymakers. Stock market plays a very significant role in promoting capital formation and sustaining the economic growth of a country. It efficiently allocates scarce resources which are used to finance different sort of projects, leading to the prosperity and growth of the economy. Moreover, it also serves as a vehicle for risk diversification associated with projects, which helps to minimize the uncertainty regarding investment returns. Olweny and Kimani (2011) have argued that stock market facilitates the investment of surplus funds into additional financial instruments that better match their liquidity preference and risk appetite.
According to Nordin & Nordin (2016), at the end of 2010 the Malaysian stock market capitalization and debt outstanding stood at 165% and 97% of nominal GDP respectively. This figures show that the Malaysian capital market is quite big relatively to the Malaysian economy. Therefore, taking into account the size of the Malaysian capital market, it is possible that this market could significantly contribute to the economic growth of the country.
In this new era of globalization, the unpredictability of the stock market returns has become a major subject in developing countries like Malaysia. According to Lim & Sek (2013) high stock market volatility leads to a huge variation of returns, and thus greater risk. Hence, having a good understanding of the factors that affect the volatility of the stock market leads investors to a more precise prediction of the stock price movements, which in turn reduces the risk of making losses.
Among macroeconomists and finance theorists there is a mutual consensus that stock market performance is driven by different macroeconomic factors. Although several studies have been conducted in developed economies such as USA, UK and German regarding the relationship between macroeconomic variables and stock market performance, the nature of such relationship might be different for an economy like Malaysia which is still under development. Therefor the purpose of the current paper is to investigate the impact of exchange rate and inflation on Malaysian stock market performance.
According to Kutty (2010), exploring the relationship between macroeconomic variables and stock market performance is of extreme importance to policymakers, economists, and investors. Understanding this relationship helps them to better access the efficiency of the market during portfolio management, given that the key risks they face in the stock market might be traced back to changes in the macroeconomic variables.
Literature Review
In the past decades, several studies have been carried out into the relationship between stock market performance and macroeconomic variables. However, Barakat et al. (2016) argued that there is a need to a more in depth investigation of the nature of this relationship, since some macroeconomic variables could vary from one market to another as well as from one period to another. This section provides a review of previous studies conducted by different authors on the relationship between macroeconomic variables and stock market performance.
Exchange Rate
The relationship between the exchange rate and stock market performance has been a subject of study by many researchers. Exchange rate and stock market are both considered as crucial elements in influencing the economic development of many countries. Though, the findings regarding their relationship appear to be inconclusive.
Kutty (2010) stated that movements of the exchange rate can have a huge impact on the cash flows of multinational companies, since the performance of these companies not only depend on the resources that companies possess, but also on the fluctuations of the currencies, assuming there will always be a conversion from one currency to another.
Cakan & Ejara (2013) studied the relationship between the exchange rate and stock prices of twelve emerging market countries from May 1994 to April 2010 using linear and non-linear Granger causality tests. They found that when the local currency of a country depreciates, it makes exporting goods much cheaper and this can lead to a rise in foreign demand and sales, and thus a rise in the stock price. On the other hand, when the local currency appreciates foreign demand of an exporting firms products shrinks; consequently the profit will decrease as well as its stock price.
Agrawal et al. (2010) conducted a study on the relationship between the Nifty returns and India rupee-US Dollar exchange rate using daily closing index from October 2007, to March 2009. Findings revealed a negative relationship between the Nifty returns and exchange rate during the period analyzed. Similarly, Najaf & Najaf (2016) used Granger causality test to check the level causal relationship between the two variables in the Indian stock market. The purpose of the study was to prove whether or not exchange rate is a crucial determinant of firms profitability. Results showed that movements in the exchange rates negatively affect the stock prices.
Younas et al. (2013) also found a negative relationship between exchange rate and stock price in his study in the impact of exchange rate on stock market in Pakistan. This study revealed that exchange rate not only affects the returns of multinational companies, but also affect the returns of domestic firms. From multinational companies perspective, exchange rate brings a sudden change in worth of its foreign operations which may reduce profitability and affect the stock price negatively. While in the case of import oriented domestic firms, stock prices will negatively be influenced due to the currency depreciation which leads to an increase in the price of inputs which results in a decrease in the profitability of the firms.
Milambo et al. (2013) used the GARCH model to establish the relationship between exchange rate volatility and South African stock market. Findings suggested that movements of the currency have a huge influence on the value of the rand of cash flows from foreign projects. However, the study also revealed weak correlation between the volatility of the currency and the stock market, but a huge impact in the financial system. In addition, it was found that the South African stock market is affected by other macroeconomics variables such as total mining production, interest rates, money supply, and the United States interest rates.
Inflation Rate
Inflation is undoubtedly one of the most important macroeconomic variables believed to be related to stock prices, and in turn also affected by it (Gupta and Inglesi-Lotz, 2012). The literature regarding the relationship between these two variables is not from today. Fisher (1930) suggested that there is a positive relationship between stock market returns and expected inflation and changes in the expected inflation. Whereas, Fama (1970) claimed that stock returns and inflation are negatively related, due to the positive relationship between real output and stock market returns and the inverse relationship between real output and inflation.
Adusel (2014) investigated the relationship between the inflation and stock market returns from Ghana Stock Exchange for the period of January 1992 to December 2010. The study found that there is a negative statistical significant relationship between inflation and stock market returns in the short run. However, this negative relationship becomes significantly positive in the long run. The negative short-run between the inflation and stock market returns suggests that a rise in the inflation will cause a drop in the price of stock market.
Mousa et al. (2012) used time series data from the Consumer Price Index (CPI) as a measure of inflation and the stock prices of ten selected companies in Jordan as a measure of stock validation to test whether there is a correlation between stock prices and inflation. Findings from the study suggest that majority of the companies examined (70%) are negatively correlated against inflation, whereas the rest (30%) show a slightly positive relationship between changes in the stock prices and inflation. Moreover, results show that stocks cannot be used as a perfect hedge to the degree that firms cash flow are negatively correlated to inflation, and the relationship between stock price and inflation can be either negative or positive.
Wongbampo & Sharma (2002) examined the relationship between stock market prices and macroeconomic variables including inflation in five Southeast Asian countries including Malaysia using CPI as proxy variable for inflation. This study found a negative relationship between stock prices and inflation in all of the five Southeast Asian countries investigated.
Geetha et al. (2011) analyzed the impact of inflation on stock market of three countries namely: Malaysia, United States and China. The researchers used secondary data consisting of monthly time series data from January 2000 to November 2009. They also used interest rate, inflation (CPI), exchange rate, GDP, and share prices of the three countries as variables of the study. The study found that there is long run correlation between inflation either expected or unexpected with stock returns, but there is no short run correlation between these variables for Malaysia and US, but it exists for China.
Uwubanmwen & Eghosa (2015) conducted a research in the “impact that inflation rate have on stock returns in the Nigeria stock market. The study also aimed to determine whether stock returns in Nigerian stock market were influenced by the inflation rate and also to establish whether stock returns in the Nigerian stock market can effectively be forecasted using stock prices. Findings indicated that there is a negative but weak influence of inflation on stock returns.
Ahmed et al. (2016) used Johansen test to investigate the association between inflation and stock returns in Bangladesh. The study used stock return data from monthly closing stock price indices of Dhaka Stock Exchange (DSE), and monthly data of inflation rate for the period of November 2004 to July 2013. The Johansen test procedure established the existence of a single cointegration equation at 5 percent significance level, which suggests a long run equilibrium correlation between the stock market and inflation. The study also found a short run positive relationship between the stock market and inflation in Bangladesh.
To summarize, it is observable from the literatures reviewed above that studies regarding the relationship between macroeconomic variables (exchange rate and inflation) and stock market performance has produced mixed results. Some studies found a positive relationship between macroeconomic variables and stock market performance, others found a negative relationship, and others no relationship at all. These mixed findings result from the fact that each stock market has got its own characteristics such regulations, economic development, investment environment, type of investors and other factors.
Methodology
Data
The research consists of monthly time series data collected from the period of January 2007 to December 2016. This is basically 120 observations for each variable obtained from Thomson Datastream. In line with previous studies, all the time series data was transformed into logarithm form.
Research Variables
This research aims to shed light into the relationship between the stock market performance and two selected macroeconomic variables. The macroeconomic variables analyzed include Ringgit Malaysia/USD exchange rate as proxy for exchange rate and CPI as proxy for inflation rate. The Kuala Lumpur Composite Index (KLCI) is used as proxy to measure Malaysia stock market performance. According to Chong and Puah (2009), Kuala Lumpur Stock Exchange Composite Index (KLCI) is a capitalization weighted index which is used as an accurate indicator to measure the Malaysian stock market performance.
Research Strategy
This research adopted quantitative design method to conduct the study. Quantitative design approach uses quantitative data, which is any data in numerical or mathematical form such as percentage, index, and descriptive statistics which enables the researcher to do the hypothesis testing, measure and analyze the data in arithmetical form.
The research also carried out several econometric tests in order to determine the relationship between the stock market performance in Malaysia and macroeconomic variables. The tests conducted include unit root test which consists of Augmented Dickey Fuller (ADF) and Phillip-Perron (PP); heteroskedasticity; model specification, granger causality, as well as multiple regression tests.
Unit Root Test: In stock market, empirical research is based on time series data. A pre-requisite for designing meaningful results in time series analysis is to have stationary data in order to enhance the accuracy and reliability of the models constructed. If the time series data is non-stationary, regression parameters cannot be carried out, or if they are carried out the results may not be accurate. A time series data is considered as stationary if its mean and variance are constant over a given period of time, and covariance are constant for a given lag. The stronger is the stationary of the data; the best is for the research because it does not lead to spurious regression. One of the most common ways to test the stationarity of the data is using the unit root test. Although there are several unit root tests to check stationarity of the data, this paper is using ADF and PP tests.
Heteroskedasticity Test: A time series regression should consist of same variance of distribution. Therefore, if the variance of distribution is not the same, it violates the assumptions that the variances of the error terms are constant, giving rise to heteroskedasticity problem. Heteroskedasticity can be caused by different factors such as missing an explanatory variable or the variables are not normally distributed. White (1980) argued that heteroskedasticity affects the efficiency of estimated parameter and covariance matrix, misleading the results of the hypotheses testing. Furthermore, Long & Laurie (1998) argued that heteroskedasticity problem in time series data tend to underestimate the variances and standard errors, leading results of both t statistics and F-statistic to be unreliable.
Model Specification Test: Model specification is correct when the relevant independent variables are chosen and included in the model, and when appropriate functional form of variable into the model is selected (Gujarati & Porter, 2009). Therefore, when irrelevant independent variables are selected, they are correlated with error term, which will provide biased results.
Granger Causality Test:Granger (1969) developed granger causality test in order to determine causal relationship between two variables and examine whether one time series data is significant in forecasting another (Harasheh & Libdeh, 2011). The test aims to examine whether the past values of a variable can be significant in forecasting changes in another variable. Granger (1969) argued that granger causality is a suitable test to determine the interaction between movements of stock price and economic changes. The granger causality test is used to determine the short run relationship between the dependent and independent variables. The test provides two outcomes namely unidirectional and bidirectional causality between variables.
Multiple Regression Analysis: Regressions model is a method of analyzing data to examine the link between dependent and independent variables. Therefore, in order to determine the relationship between the macroeconomic variables and stock market performance, OLS regression model will be applied. The functional method of this model would be below.
Analysis and Interpretation of Findings
We tested the existence of unit root by conducting both ADF and PP tests. After ensuring that all the data is stationary we analyzed the presence of heteroskedasticity problem in the model and then conducted the granger causality as well as the OLS regression tests to find short-run and long-run relationship between macroeconomic variables and the stock market performance in Malaysia respectively.
Unit Root Test
The
results of the ADF and PP tests conducted in order to check the stationarity of
the time series data is shown in the table 1 and 2 respectively. 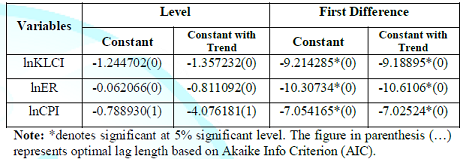
Table 1: ADF Test Results.
The
ADF test shows that all the three variables namely exchange rate, KLCI and CPI are
non-stationary at level. However, after performing the first difference
transformation, all the variables become stationary.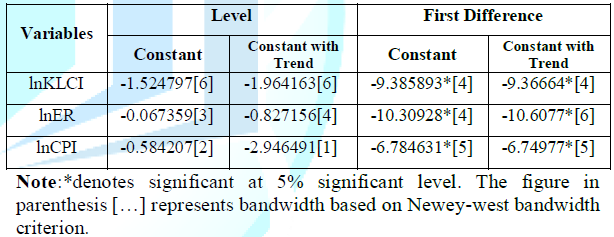
Table 2: PP Test Results.
The results of PP test are in line with ADF test results. All the three variables are non-stationary at level, but they all become stationary after the first difference.
Heteroskedasticity Test
The
table 3 shows the results of the heteroskedasticity test. The decision rule
suggests that we accept ![]() (no heteroskedasticity problem) if the
P-value
of the Chi-squared
is greater than the significance level 5%.
(no heteroskedasticity problem) if the
P-value
of the Chi-squared
is greater than the significance level 5%.
Heteroskedasticity Test: ARCH
Table 3: Heteroskedasticity Test Results.
Model specification
The table 4 provides the results of the model specification test, which is obtained by conducting the Ramsey RESET test. The decision rule suggests that if P-value of F-statistic is more than the significance level 5%, the model is correctly specified.
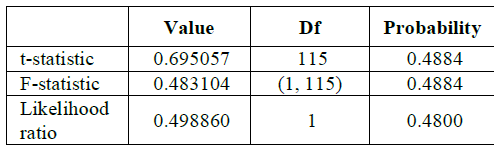
Table 4: Ramsey RESET Test Results.
Based on the P-value of
F-statistic obtained (0.4884) which is greater than the significance level 5%,
we can conclude that the model is correctly specified.
Granger Causality Test
Granger causality test is conducted in order to determine the causal relationship between the independent variables and the KLCI. According to Ali (2014) if the causal relationship between variables exists, they can be used to forecasting changes of each other. The table 5 shows the results of the granger causality test. The hypotheses for this test would be:
![]() : X does not granger cause Y.
: X does not granger cause Y.
![]() : X does granger cause Y.
: X does granger cause Y.
Thus,
if P - value is less than the significant level 5%, we reject ![]() and consequently accepting
and consequently accepting ![]()
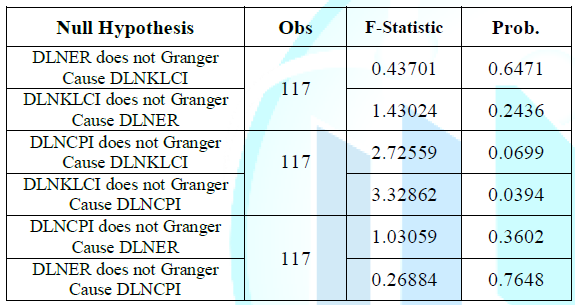
Table 5: Granger Causality Test Results.
From
the results presented above, it can clearly be seen that exchange rate and
inflation do not influence in the performance of KLCI in the short run, since
all P-values are above 5%. However, the same results suggest that in the
short-run, the performance of the stock market in Malaysia granger cause inflation.
OLS Regression Model
The regression model is used in this research to determine the relationship between stock market performance and the selected macroeconomic variables in Malaysia. The hypotheses for the t-test would be:
The table 6 illustrates the results of the relationship between Malaysia stock market returns and the two selected macroeconomic variables. Based on the above results, the R-squared (0.224597) is relatively low, which implies a low forecasting power of the multivariate model, and thus, there is a high likelihood of the exclusion of relevant macroeconomic variables which may significantly affect the variation of stock market performance in Malaysia. Thus, based on R-squared, exchange rate and inflation are only accountable for 22.46% of the total variation of Malaysian stock market performance, which suggests that 77.54% variation in the stock market performance in Malaysia is influenced by other variables. The F-statistic value (0.000000) is also very small, which implies that the selected macroeconomic variables jointly do not have a significant impact on Malaysia stock market performance.
Dependent Variable: DLNKLCI
Method: Least Squares
Date: 11/29/17 Time: 00:41
Sample (adjusted): 2007M02
2016M12
Included observations: 119 after
adjustments
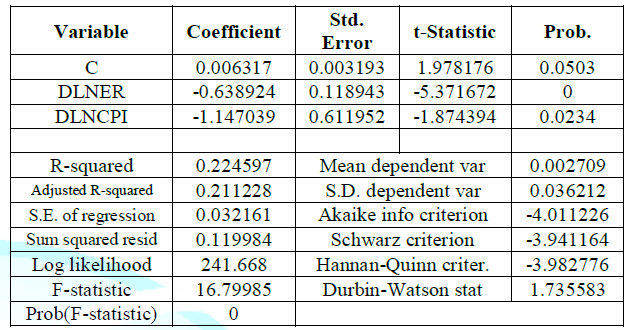
Table 6: OLS Regression Results.
The
t- test of OLS regression model indicates that both exchange rate and inflation
rate have a significant impact on the Malaysian stock market performance.
Moreover, in the long run there is a significant negative relationship between
the exchange rate and KLCI. This result is in line with previous research
conducted by Bello (2013), Fang & Miller (2002), Khan et al. (2012), Ouma
& Muriu (2014) and Jawaid & Haq (2012). Fang & Miller (2002) have
argued that the depreciation on the domestic currency increases the returns on
dollar assets. Therefore, investors tend to shift their funds from the domestic
assets such as stocks to dollar based assets for higher expected returns. This
shift in portfolio composition favors dollar assets over domestic stocks, leading
to a decline in the stock market prices and thus its returns as well. However,
findings from this study are not supported by other studies like Cakan &
Ejara (2013), Soenen & Hennigar (1998), Chiang, and Yau & Nieh, (2009)
who found a positive relationship between the exchange rate and stock market
returns.
Furthermore, results suggest that in the long run, inflation is found to have a negative relationship with the stock market performance in Malaysia. This result is further supported by various previous literatures that found a negative relationship between the stock market returns and inflation such as Phuyal (2016), DeFina (1991), Humpe & Macmillan (2007), and Qamri et al. (2015). DeFina (1991) has argued that an increase in the inflation negatively affect the corporate income since it causes an immediate rise of cost, and slowly reducing output and consequently the share price. Therefore, maintain a stable level of inflation in the country will hugely contribute to a growing stock market by increasing the number of foreign as well as local capital inflows.
Conclusion
Stock market has become crucial in promoting capital formation and sustaining economic growth in a country. Therefore, understanding the movement of the stock market performance is very important aspect, especially for developing countries like Malaysia in which the stock market is relatively new compared to other more developed countries.
This study has empirically investigated the relationship between two selected macroeconomic variables namely exchange rate and inflation, and the stock market performance in Malaysia using both granger causality test and OLS regression model. In order to test the stationarity of the data, ADF and PP tests were conducted. Both ADF and PP tests have shown that the data is non-stationary at level, and stationary at firs difference for all the three variables. Ramsey RESET test also showed that the model is correctly specified, which suggests that all the independent variables are important in explaining the variation of the KLCI.
Granger causality test was conducted to establish the unidirectional and/or bidirectional relationship between the dependent and independent variables. On the basis of granger causality test, exchange rate and inflation do not granger cause KLCI. This means that in the short run, these macroeconomic variables do not affect the performance of the Malaysian stock market. However, results show that there is a unidirectional causal relationship from KLCI to inflation. This result suggests that past values of KLCI could be used to predict future inflation level in the country.
In regard to OLS regression model, results suggest that exchange rate and inflation have a negative effect towards the stock market performance in Malaysia. Moreover, exchange rate and inflation are found to have a significant influence in the variation of Malaysian stock market, in spite of the low forecasting level indicated by R-squared.
References
1. Adusel M. The Inflation-Stock Market Returns Nexus: Evidence from the Ghana Stock Exchange (2014) J Economics Int Finance 6: 38-46. DOI: 10.5897/JEIF2013.0556
2. Agrawal G, Kumar Srivastav A and Srivastava A. A Study of Exchange Rates Movement and Stock Market Volatility (2010) Int J Business Management 5: 62-63. https://doi.org/10.5539/ijbm.v5n12p62
3. Ahmed SF, Islam KMZ and Khan MR. Relationship between Inflation and Stock Market Returns: Evidence from Bangladesh (2015) Daffodil Int Uni J Business Economics 9: 1-12. http://dx.doi.org/10.5296/ijafr.v4i2.6671
4. Ali I. Impact of Foreign Direct Investment on Volatility of Stock Market: An Evidence from Pakistani Market (2014) IOSR J Business Management 16: 77-80. DOI: 10.1080/1331677X.2013.11517588
5. Barakat M, Elgazzar S and Hanafy K. Impact of Macroeconomic Variables on Stock Markets: Evidence from Emerging Markets (2015) Int J Economics Finance 8: 195. https://doi.org/10.5539/ijef.v8n1p195
6. Bello Z. The Association between Exchange Rates and Stock Returns (2013) Investment Management Financial Innovations 10: 109.
7. Cakan E and Ejara D. On the Relationship between Exchange Rates and Stock Prices: Evidence from Emerging Markets (2013) Int Res J Finance Economics 1: 115-124.
8. Chong F and Puah CH. The Malaysian IPO Market: Volume, Initial Returns and Economic Conditions (2009) 1-11.
9. DeFina RH. Does Inflation Depress the Stock Market? (1991) Federal Reserve Bank of Philadelphia Business Review 3-12.
10. Fama EF. Efficient Capital Markets: A Review of Theory and Empirical Work (1969) J Finance 25: 383-417. DOI: 10.2307/2325486
11. Fang WS and Miller SM. Currency Depreciation and Korean Stock Market Performance during the Asian Financial Crisis. Working Paper, University of Connecticut (2002).
12. Fisher I. The Theory of Interest. Macmillan, New York (1930).
13. Geetha C. Mohidin R. Chandran VV and Chong V. The Relationship between Inflation and Stock Market: Evidence from Malaysia, United States and China (2011) Int J Economics and Management Sciences 1: 1-16.
14. Granger CW. Investigating causal relations by econometric models and cross-spectral methods (1969) J Econometric Society 424-438.
15. Gujarati DN, Porter DC. Basic econometrics. McGraw-Hill (2009).
16. Gupta R and Inglesi-Lotz R. Macro Shocks and Real US Stock Prices with Special Focus on the "Great Recession" (2012) Appl Econometrics Int Development 12: 123-136.
17. Harasheh M and Abu-Libdeh H. Testing for Correlation and Causality Relationship between Stock Prices and Macroeconomic Variables: The Case of Palestine Securities Exchange (2011) Int Review Business Res Papers 7: 141-154.
18. Humpe A and Macmillan PD. Can Macroeconomic Variables Explain Long-Term Stock Market Movements? A Comparison of the US and Japan (2007) Working series paper. Centre for Research into Industry, Enterprise, Finance and the Firm.
19. Khan Z, Khan S, Rukh L and Rehman WU. Impact of Interest Rate, Exchange Rate and Inflation on Stock Market Returns of KSE 100 Index (2016) Int J Economic Res 3: 9-12.
20. Kutty G. The Relationship between Exchange Rates and Stock Prices: The Case of Mexico (2010) North American J Finance Banking Res 4: 1-12.
21. Lim C and Sek S. Comparing the Performances of GARCH-type Models in Capturing the Stock Market Volatility in Malaysia (2013) Procedia Economics and Finance 5: 478-487. https://doi.org/10.1016/S2212-5671(13)00056-7
22. Long JS and Laurie HE. Correcting for Heteroscedasticity with Heteroscedasticity Consistent Standard Errors in the Linear Regression Model (1998).
23. Milambo C, Maredza A and Sibanda K. Effects of Exchange Rate Volatility on the Stock Market: A Case Study of South Africa (2013) Mediterranean J Social Sciences 4: 562. http://dx.doi.org/10.5901/mjss.2013.v4n14p561
24. Mousa SN, Al-safi W, Hasoneh A and Abo-orabi MM. The Relationship between Inflation and Stock Price: A Case from Jordan (2012) IJAARS 10: 46-52.
25. Nordin S and Nordin N. The Impact of Capital Market on Economic Growth: A Malaysian Outlook (2016) Int J Economics Financial Issues 6: 259-265.
26. Olweny TO and Kimani D. Stock Market Performance and Economic Growth: Empirical Evidence from Kenya using Causality Test Approach (2011) Advances Management Appl Economic 1: 153-196.
27. Phuyal N. Can Macroeconomic Variables Explain Long Term Stock Market Movements? A Study of Nepali Capital Market (2016) J Business Management Res 1: 87-89. https://doi.org/10.3126/jbmr.v1i1.14549
28. Qamri GM, Haq MAU and Akram F. The Impact of Inflation on Stock Prices: Evidence from Pakistan (2015) Microeconomics and Macroeconomics 3: 67. DOI: 10.5923/j.m2economics.20150304.01
29. Soenen LC and Hennigar ES. An Analysis of Exchange Rates and Stock Prices: The US Experience between 1980 and 1986 (1988) Akron Business and Economic Review Winter 19: 32-44.
30. Uwubanmwen AL and Eghosa I. Inflation Rate and Stock Returns: Evidence from the Nigerian Stock Market (2015) Int J Business Social Sci 6: 155-165.
31. White H. A Heteroskedasticity-Consistent Covariance Matrix Estimator and a Direct Test for Heteroskedasticity (1980) The Econometric Society 48: 817-838. DOI: 10.2307/1912934
32. Wongbampo P and Sharma SC. Stock Market and Macroeconomic Fundamental Dynamic Interactions: ASEAN-5 Countries (2002) J Asian Economics 13: 27-51. https://doi.org/10.1016/S1049-0078(01)00111-7
33. Yau H and Nieh C. Testing for Cointegration with Threshold Effect between Stock Prices and Exchange Rates in Japan and Taiwan (2009) Japan and the World Economy. https://doi.org/10.1016/j.japwor.2008.09.001
34. Younas ZI, Farooq U and Nasir A. Exchange rate and stock market volatility: A case of Pakistan (2013) J Business Administration Management Sci Res 2: 187-190.