Obstetric complications
are an issue of concern in all countries and especially, in developing
countries. The prevalence of obstetrics complications measures the development
path and the implementation of motherhood initiative 1999 for reducing
obstetric complications and maternal mortality. The study aimed at estimating
the level and socio-economic causes of obstetric complication in Gezira state.
The data source of this research is based on a longitudinal sample of 400 women
who were admitted to Wad Medani Obstetrics and Gynecology Hospital. The
research used descriptive statistics, cross tabs with chi- square and logistic
regression analyses utilizing SPSS program. The main study results include
that: the rate of obstetric complications is high in Gezira state amounting to
60 % approximately. The results also indicated that the modal complications are
pregnancy induced hypertension, septicemia and placenta previa while the modal
problems are malaria and anemia. The study recommended reducing intervention
delays by consultants upon admission, abolish unnecessary cesarean sections and
women must go to antenatal care clinics according to WHO protocol.
Background
The
World Health Organizations (WHOs) 10th revision of the International
Statistical Classification of Diseases and Related Health Problems (ICPD+10)
defines obstetric complications as "the complications that affect women
while pregnant or within 42 days of termination of pregnancy irrespective of
the duration and site of the pregnancy, from any cause related to or aggravated
by the pregnancy or its management but not from accidental or incidental causes
[1] Fewer Sudanese women suffer from complications today than they did 5 or 10
years ago, thanks in large part, to the national safe motherhood programs. Many
of these challenges involve addressing the delays women face when they need
essential obstetric care. In Sudan and other countries, most complications
could be avoided if women had timely access to high-quality emergency obstetric
services. Every year about some 16390 Sudanese women and half of their newborns
suffer from complications related to pregnancy and childbirth. Although this
level of complications (520 complications per 100,000 live births) is
relatively high by international standards, recent evidence suggests that a
womans lifetime risk of complication causes in Sudan has dropped dramatically,
from 1 in 80 to 1 in 550 during 2010 [2].
Sudans
reproductive health tragedy has been helped because the country conducted two
nationally representative studies less than 5 years apart. The objective of
this study was to estimate the level of obstetric complications in Gezira state
and to determine the socio cultural factors affecting obstetric complications
among pregnant women in Gezira state.
Data
The
primary data source is based on the information provided through questionnaire
for women who were admitted to Wad Medani Obstetrics and Gynecology hospital. The
respondents questionnaire consists of three sections defining characteristics
of respondents, causes of obstetric complications and mother follow up during
pregnancy.
Initially
the sample size is obtained according to the simple random sampling formula:
n* = t²pq/d²
Where:
n* is sample size .
p is the anticipated population
proportion.
q= 1-p
d is the absolute
precision required on either side of the anticipated population proportion.
t² is the standard score for normal
distribution, t value with confidence limit of 95%, is approximately 2, p is an
estimate of the anticipated population proportion taken as 50%, q = 1-p = 50. d
is the probability that x samples in N samples will be wrong, taken here as 1
to 20 that is 5%. The value of n* will then be:
n* = (2)² (50) (50)/ 25 = 400
Methods
of Analysis
The
study presented the analysis of survey data using both descriptive and
inferential statistics. The frequencies procedure provides statistics and
graphical displays that are useful for describing many types of variables. The
inferential statistics utilizes crosstabs and logistic regressions. The
crosstabs procedure forms two-way and multiday tables and provides a variety of
tests and measures of association for two-way tables. The cross tabulations
show the frequency of each response for variable (see appendix). Logistic regression
is useful for situations in which you want to be able to predict the presence
or absence of a characteristic or outcome based on values of a set of predictor
variables. It is similar to a linear regression model but is suited to models
where the dependent variable is dichotomous. Logistic regression coefficients
can be used to estimate odds ratios for each of the independent variables in
the model. Logistic regression is applicable to a broader range of research
situations than discriminant analysis. Binary logistic regression is most
useful when you want to model the event probability for a categorical response
variable with two outcomes.
Descriptive
statistics shows the age distribution of respondents by five years age groups.
The mean of the distribution is 28.85 with standard error of 5.311. This gives
a 5% confidence interval in the range of (27.44, 29.91). The range of the
probability limits is very narrow suggesting that the distribution is
approximately normal with the highest response 31.5% at age group 25-29. Only
3.8% are primagradivas and 1.8% are multipara. These two age groups are
specifically higher risk groups.
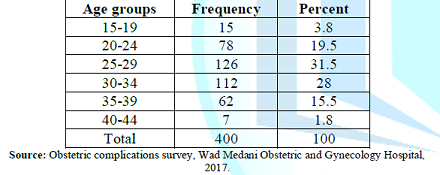
Table 1: Age Distribution of Respondents.
The
occupational distribution of respondents is asymmetric highly skewed to the
right with the majority of respondents being housewives.
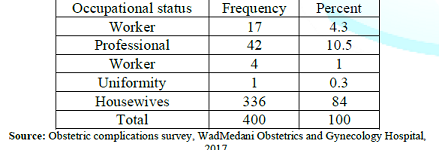
Table 2: Occupational Distribution of Respondents.
Respondents
years of schooling distribution appears to be normal and reflects well and
adequately the years of schooling distribution of all respondents, where more
than half of the respondents are concentrated in the middle of distribution.
The mean of the distribution is 11.5 with standard error of .125 this gives a
5% confidence interval in the range of (11.81, 11.44). The range of the
probability limits is very narrow suggesting that the distribution is
approximately normal with the highest response 45% that means the respondents
in this category have more than ten years of education. For obstetric
complication table see (appendix 1).
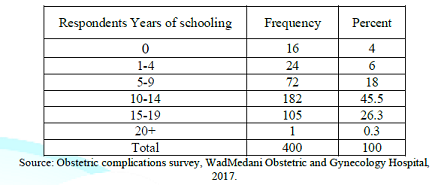
Table 3: Respondents Years of Schooling.
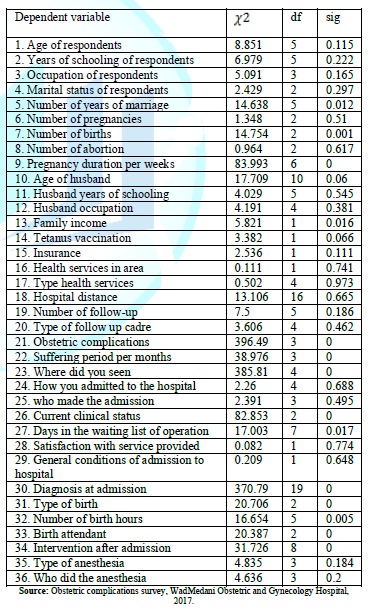
The
Crosstabs procedure offers tests of independence and measures of association
and agreement for nominal and ordinal data. One can also obtain estimates of
the relative risk of an event given the presence or absence
of a particular characteristic, and you can test for significant differences in
column proportions in the cross tabulation table. The results of the survey are
stored in obstetric complications. Use the crosstabs procedure to test the
hypothesis that the levels of obstetric complications are related to a number
of independent variable. Results are shown in table 4.
To view Table 4, Click Below
Table 4: Chi-Square Test of Association between Dependent and Independent Variable.
To view Table 5, Click Below
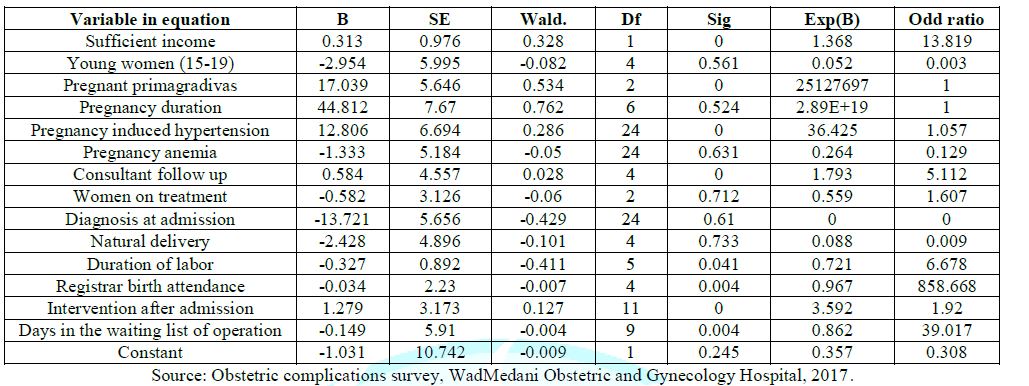
Table 5: Variable in Equation.
In
using the binary logistic regression estimation, the parameter estimates table
summarizes the effect of each predictor. The ratio of the coefficient to its
standard error, squared, equals the Wald statistic. If the significance level
of the Wald statistic is small (less than 0.05) then the parameter is useful to
the model. The predictors and coefficient values shown in the last step are
used by the procedure to make predictions. The meaning of a logistic regression
coefficient is not as straightforward as that of a linear regression
coefficient. While B is convenient for testing the usefulness of predictors,
Exp (B) is easier to interpret. Exp (B) represents the ratio-change in the odds
of the event of interest for a one-unit change in the predictor.
They
are a number of independent variable that are not significant and have no
association with obstetric complications these include (Age of respondents,
Years of schooling of respondents, Occupation of respondents, Marital status of
respondents, Number of pregnancies, Number of abortion, Age of husband, Husband
years of schooling, Husband occupation, Tetanus vaccination, Insurance, Health
services in area, Type health services, Hospital distance, Number of follow-up,
Type of follow up cadre, How you admitted to the hospital, who made the
admission, Satisfaction with service provided, General conditions of admission
to hospital, Type of anesthesia, Who did the anesthesia). In state they are
number of independent (Number of years of marriage, Number of births, Pregnancy
duration per weeks, Family income, Obstetric complications, Suffering period
per months, Level of the doctor seen, Where did you seen, Current clinical
status, Days in the waiting list of operation, Diagnosis at admission, Type of
birth, Number of birth hours, Birth attendant, Intervention after admission).
For
example, Exp (B) for doctor level is equal to 5.112, which means that the odds
of default for a pregnant woman who has seen a doctor during her pregnancy are
five times the odds of default for a woman who has not seen a doctor, all other
things being equal. What this difference means in terms of probability depends
upon the original probability of default for the women who have seen a doctor.
In the case of a pregnant woman whose probability of default is 0.5, the odds
she will default are related to the probability by this equation. Thus, her
corresponding odds of default are 1.In the case of a pregnant woman whose
probability of default is 0.9, her odds of default are In the case of a woman
whose probability of default is 0.9, and her odds of default are 9.
The
odds of default for a pregnant woman with consultant follow up are 9*5.112 =
46.008, so the corresponding probability of default reduces to 0.028. The same
analysis is applicable to sufficient income; Pregnancy
induced hypertension, Women on treatment, Duration of labor, Intervention after
admission, Registrar birth attendance and Days in the waiting list of
operation. However, each of these has a different probability of default
ranging between (0.000, 0.286).
Conclusion
The
investigation found that among the sampled women who were admitted to Wad Madni
Obstetrics and Gynecology Hospital between the period (15 May to 25 June 2017),
59.6% had obstetric complications. The most frequent complication was pregnancy
induced hypertension representing 10.2%, while the most frequent obstetric
problem was pregnancy malaria. Other complications and problems were found but
with lower frequencies. These include Septicemia representing 7.8%, Placenta
Previa representing 3.8%, Diabetes representing 7.3% and pregnancy anemia
representing 7.9%. However, 5.2% of the sampled women had synergistic problems.
16 of the 37 predictors included in the questionnaire had statistically
significant association with health problem during pregnancy. These include 11
predictors that were highly associated at 0.01 level of significance. These
include number of birth, pregnancy duration, suffering period, level of doctor
seen, diagnosis at admission, and birth attendant. The variables left out of
the analysis at the last step nine of them have significance values larger than
0.05, so no more are added.
References
1.
WHO
(1992) International Statistical Classification of Diseases and Related
HealthProblems.10th rev. ed. Geneva Switzerland.
2.
Alnory
A. 2012 Reproductive Health Research Agenda, NPC Policy Brief on Maternal
Mortality, an Interim Report, NPC, Khartoum, Sudan.
3.
Dasgupta,
Sanjoy DA, Gupta and Anupam K. (2002) Small sumpling theory, Montivido, Brown,
USA.
4.
Box,
Hunter and Hunter (1978) The chi-square test and application to traffic data ,
Stockholm ,Sweden.
5.
John
Willy et al. Introduction to mathematical statistic, (chop-hill) Montevideo,
Brown, USA.
6.
Bartlett
MS and Kendall DG. The statistical analysis of variance- heterogeneity and the
logarithmic (1996).


