
 PDF
PDF
Introduction
The study area is located in the northern part of the western desert of Egypt between latitudes: 30º 35 22.950, 30 º 38 43.410, and longitudes: 26 º 38 59.741, 26 º 44 46.464 (Figure 1). It lies in the southeastern part of Shushan Basin where Qasr Field comprises several oil and gas- producing wells. The basin witnessed Jurassic and Early Cretaceous extension followed by Late Cretaceous- Early Tertiary inversion. NE-SW and NNE-SSW oriented inversion anticlines as well as tilted fault blocks bounded by WNW- ESE and NW-SE oriented normal faults form the main structural traps in the basin. Many oil and gas fields, which were charged by source rocks of Jurassic age, have been discovered in Shushan Basin among them Umbarka, Kahraman, Qasr, Amoun and Falak [1]. The orientation of the basin bounding faults in Shushan Basin is E-W to ENE-WSW and WNW-ESE to NW-SE in some segments of the basin [2]. The sedimentary succession ranges in age from Cambro- Ordovician to Miocene [3-6]. The Middle Jurassic Khatatba shale is the main oil and gas source rock in the north Western desert [7-12]. The study utilizes the interpretation of seismic and well-log data in order to define the major and minor structures affecting the Lower Cretaceous Alam-El Bueib formation.
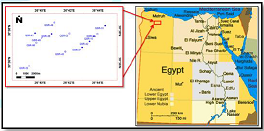
Figure 1: Location map of Qasr field relative to Egypt geographic map.
Geologic Setting
Geologically, the northern western desert of Egypt is belonging to the Unstable Shelf province [4, 6, and 13]. The sedimentary sequence of the Unstable Shelf is thick with a lower part of clastic sediments, followed by a middle calcareous series and topped by biogenic carbonates. The sequences are gently folded and show lateral stress and Over-thrusts related to compression. This structural deformation is related to the laramide phase of the Alpine Orogeny. These fold bundles are trending northeast and referred to the Syrian Arc. The Precambrian basement lies to southern Egypt and shows slope to the north with gradual thickening of the sedimentary cover [4]. Probably, the northern basins (Matrouh, Shushan, and Natrun) initially formed as a single rift during the Permo- Triassic, which were developed into a pull-apart structure [5]. Marine conditions are first recorded in the Jurassic and Cretaceous sequences. Later tectonic events divided the original basin into a series of smaller sub-units. The initial rift system was probably controlled by normal faults. The sedimentary section of the western desert ranges from Lower Paleozoic to Recent and the detailed stratigraphic column is presented in (Figure 2). Four major sedimentary cycles occurred, with maximum, southward transgression in Carboniferous, Upper Jurassic, Middle and Late Cretaceous, Middle Miocene and Pliocene time. Maximum, northward regressive phases occurred during Permo- Triassic and Lower Jurassic and continued in Lower Cretaceous, and again in Late Eocene to Oligocene, with a final phase in late Miocene times [14].
![Generalized stratigraphic column of the western desert, Egypt (modified after EGPC 1992) [3].](http://edelweisspublications.com/edelweiss/figures/east-19-163_figure_2.png)
The geologic section of the study area comprises all the petroleum system elements including source, seal and reservoir rocks. The Middle Jurassic Khatatba Formation is divided into Zahra and Upper Safa shales, which are the main source rocks for oil and gas in the area, and Lower Safa sandstone which are the main condensate and gas-bearing reservoir. The Khatatba Formation is overlain by the Upper Jurassic Masajid carbonate which is a good seal and oil-bearing reservoir is some areas of the north western desert. The Lower Cretaceous Alam-El Bueib formation is composed mostly of clastics where the sandstones are oil-bearing reservoirs and shales are potential source rocks [3]. The richest oil-prone kerogens are found within the Lower Devonian Zeiton Formation, while gas-prone source rocks lie within the Carboniferous Dhiffah Formation [5]. The organic material in the Mesozoic clastic series derived from land plants (carbonaceous shales, lignite and coal seams) and these sequences are predominantly gas- prone [15]. Shale sequences intercalated with carbonate or clastic reservoir rocks are the most common type of seal in the north western desert fields.
Data and Methods
In the present study, 27 seismic sections, from a 3D seismic cube covering Qasr field, and one check-shot survey were used for seismic interpretation. The seismic data has a reverse polarity with seismic bandwidth (10-70 Hz). A number electric Well log from 10 wells was used in the lithological interpretation, well correlation, and synthetic generation. The whole work was performed using the purchased Schlumberger Petrel and Halliburton Land-mark softwares. The method comprises of lithological interpretation from well logs, synthetic generation, seismic to well tie, horizon and fault interpretation on seismic sections, mapping and time to depth conversion (Figure 3). Data arranged into stacks with similar orientations; i.e. the stack of lines that are oriented in the same direction as the dip of the predominant geologic features. The horizons mapped were selected based on continuity and event strength. Wells that intersect the lines were tied to seismic sections. Since the holes are straight, they required only a reasonably correct check-shot. The depth points have been converted to their equivalent two-way travel time in order to annotate them correctly on a seismic line. The procedure enabled loop tying the data, and improved the chances of finishing the task correctly and in a timely manner.

Figure 3: Seismic Interpretation work flow.
Results and Discussion
Synthetic seismogram
The synthetic seismogram is usually the primary tool used to correlate subsurface stratigraphy and surface-measured seismic data [16,17]. We can draw the vertical seismic profiling using the same type of source, a similar geophone, and the same instrumentation used to record the surface seismic data. Synthetic seismograms, by contrast, are only mathematical representations of seismic measurements that can only approximate these aspects of the total seismic-recording process. The output of synthetic seismogram is a plot of acoustic impedance, which is the product of density and interval velocity versus depth. The process of creating synthetic seismogram in petrel includes sonic calibration, synthetic generation, and wavelet generation. In creating a synthetic seismogram, the interpreter ties time data (the seismic data) to depth data (the well data) by integrating over the velocity profile. The sonic calibration study is selected and a well (Qasr -31) has been selected to generate synthetic seismogram. The well showed a good relationship between picked Two Way Travel time (TWT) and subsea depth (Z). The sonic, density and TDR logs were available for the Qasr -31 well. The check-shot report shows the replacement velocity as 6890.1 ft. /sec. The seismic wavelet was extracted from the seismic cube at the well location. The change in density of sedimentary rocks is much smaller than that of interval velocities; so change in acoustic impedance mostly depends on the change in interval velocity. An impedance log and reflection coefficient is generated from the velocity and density profiles. The reflection coefficients are convolved with a seismic wavelet to produce a synthetic seismic trace. The synthetic seismograms are sampled at 4 ms. to match the sample rate of the seismic data. (Figure 4) shows the synthetic generation study of Qasr -31 well in which the reflection coefficient (RC) and the strength of reflectors are high for the Alam El-Bueib-1 (AEB-1), AEB-3A, and AEB-3D horizons.
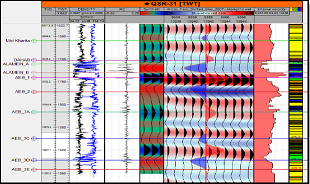
Figure 4: The synthetic generation process for the Qasr -31 well.
Seismi interpretation
Seismic interpretation of the subsurface enables us to visualize either structural or stratigraphic geological features. Subsurface geological strata that are shown on seismic lines as horizons and faults detected by the discontinuity of these horizons [16]. Only 27 seismic lines (Inlines and Crosslines) are available from a 3D-seismic cube covering the study area (Figure 5). The 3D-seismic cube is a Collection of closely-spaced seismic data over an area that permits interval velocities interval velocities of the data as a volume. The volume concept is equally important to the seismic interpreter. With 3-D data, the interpreter is working directly with a volume rather than interpolating a volumetric interpretation from a widely-spaced grid of observations [18]. In addition to seismic volume and its associated lines, one check-shot was recorded. The check-shot is a time-depth recording in a well, and it helps in overlying well on a seismic line, in the time domain. The Alam-El Bueib formation is divided into AEB-1, AEB-2, AEB-3A, AEB-3C, AEB-3D, AEB-3E, and AEB-3F members (Figure 6). Most of the Alam-El Bueib formation composed of clastics with noticeable carbonate proportions. The lithologies include sandstone, siltstone, shale, limestone, and dolomite. The AEB-3F, AEB-3D, and AEB-3C members are composed of intercalated sandstone, siltstone, and shale, while AEB-3E and AEB-3A members are composed mostly of sandstone with minor siltstone.
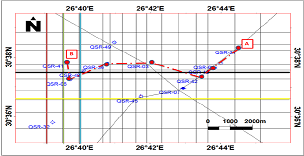
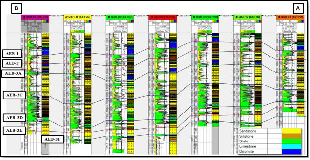
Figure 6: The Alam-El Bueib formation structural correlation, Qasr Field. For location see Figure 5.
The AEB-2 Member is composed of limestone and dolomite intercalated with thin sandstone and siltstone. The AEB-1 Member is overlain by the moderately thick dolomite of the Aptian Alamein dolomite. The structural correlation of E-W distributed well indicates that the eastern part of the study area is tectonically higher than the western part (Figure 6). The Cretaceous section, including Alam El Bueib, Alamein, Kharita, Bahariya, Abu Roash, and Khoman formations, was interpreted on the seismic sections covering the Qasr Field. All interpreted seismic lines show the effect of normal faulting on the Lower Cretaceous Alam-El Bueib formation and to the Upper Cretaceous Abu Roash Formation. The effect of folding is minimal but can be detected. The NW-SE and E-W trending normal faults could be detected in cross-lines (N-S direction) (Figures 7-11). The N-S seismic section shows six normal faults which divide the area into a number of elevated and depressed blocks along the profile direction. The faults are given symbols from F1 to F6. The fault displacement is higher at the deeper Alam-El Bueib formation and terminates at the base of the shallow Khoman Formation. The Alam El Bueib-Abu Roash section shows clear folding, especially along the (F2) in the northern part of the section, where the structure is mostly faulted anticline. In addition, drag-folding is associated with normal faults in the pre-Khoman section (Figure 7a). The N-S seismic section shows the same structural configuration as in the pre-khoman section (Figure 7b). The two seismic sections are located in the western part of the study area, and these normal faults are related to the extensional tectonics which affected the north western desert of Egypt during the Mesozoic [2, 19]. The N-S seismic section shows the termination of four faults (F1, F3, F4, and F6) (Figure 7c). Another normal fault (F7) appears to the south. The folding is clear along the F2 fault and the movement from the east to the west direction shows signs of the elevated block at the middle of the study area. The E-W seismic section along the middle part of the Q Qasr field (Figure 8a), shows five normal faults (F1, F2, F8, F9, and F10). The Reverse fault (F11) to the eastern part is mostly related to the inversion tectonics which affected the north western desert in the Late Mesozoic. The E-W seismic section (Figure 8b), shows five normal faults which divide the area into a number of elevated and depressed blocks. The fault F11 shows normal displacement which changed from reverse in (Figure 10). This change fault style should be due to the compressional tectonic forces which affected the eastern part of the area.

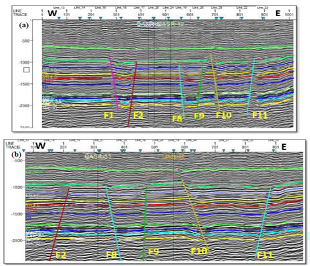
Figure 8: E-W seismic cross-sections (a) and (b). For location see Figure 5. F refers to a fault.
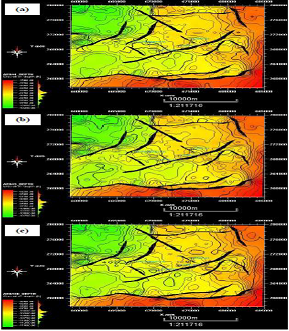
Figure 9: Depth Structure maps (a) AEB-1 horizon, (a) AEB-3A horizon, and (c) AEB-3D horizon.
Constructing subsurface maps
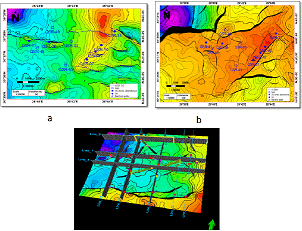
After the seismic lines have been interpreted, all the information was transferred to a base map and constructed a subsurface map. The seismic data should be posted along with all of the subsurface information from electric well logs. The most obvious type of data to post from seismic sections is the actual two-way travel time for the event that corresponds to the geologic horizon being mapped. This is analogous for posting the formation tops on the map when using well data. The same two-way travel times can be posted for any fault surfaces being mapped. One type of information that is extremely useful is the up-thrown and down-thrown intersection points of the mapping horizon with the surface of a fault. These intersection points have both a vertical datum associated with them. Travel time data are converted into depth data using several methods and these data are contoured giving a subsurface map. Three horizons were mapped in the Alam-El Bueib formation, which are AEB-1, AEB-3A, and AEB-3D (Figure 9a, 9b and 9c). These depth structure contour maps show several major normal faults trending NE-SW and minor normal faults trending NW-SE. One larger branching normal fault trending E-W and lies to the south of the study area. These step-normal faults divide the area into a number of tilted structural blocks which are shallower in the south and deepen to the north. The elevated structural blocks along these normal faults show the three-way structural closure in some locations (i.e. faulted anticlines) (Figure 9). Most of the structures are being faulted anticlinal features induced by vertical basement movements. The depth structure map on top Alam El Bueib-3C shows 3-way dip closure, that is dissected anticlines trending N-S to N-SSW, combined with normal faults trending E-W to ESE-WNW (Figure 10a). The depth structure map on top Upper Safa, Figure 10b shows 4-way dip closure, which is a tilted faulted block bounded by normal faults. These faults include one major fault trending mostly E-W and minor faults trending NE-SW and E-W. The depth map on Top Dabaa Formation (Figure 10c), shows, that the structural elements of the study area reflect two main directions of faults inferred from the map (E-W direction normal faults and NE-SW direction normal fault) and shows 3-way dip closure, that is dissected anticlines trending NW-SSW.
The AEB-3C structural correlation in Qasr oil field (Figure 11a) depicts, that this unit is higher in position the eastern part, around wells Qasr -42, Qasr -10, and Qasr -31, than in the western part, around wells Qasr-41, Qasr-48, Qasr-36, and Qasr -03. The lithology is mostly siltstone with sandstone thin beds, while the bottom is dominated by thin marine shales. The Masajid-Safa structural correlation in Qasr field shows thick gas-bearing sandstone reservoir of the Lower Safa (LSAFA) unit overlain by thinner shale intercalated with sandstone and limestone Upper Safa (USAFA) unit (Figure 11b). The shales of Upper Safa unit and its overlying Zahra unit, form the Middle Jurassic Khatatba Formation, are regarded as potential source rocks. The Upper Jurassic Masajid Formation consists of marine limestone and appears clearly in Qasr -49 well, which is located on the downthrown side of the major normal fault. The absence or thinning of Masajid Formation in other sites may be due to erosion by the action of faulting or may be due to non-deposition (Figure 11).
.png)
Figure 11a: AEB-3C structural correlation, Qasr oil field.
The geologic cross section in explains the history of deposition and tectonic movements from the Middle Jurassic to Early Cretaceous. The Lower Safa sandstones, Upper Safa and Zahra shales were deposited in Middle Jurassic, followed by normal faulting. The thin Upper Jurassic Masajid limestone may be deposited syn-faulting and is absent on the structural high reliefs, while it is present in the structural lows. These faults might be rejuvenated later in the Early Cretaceous and affected the lower part of Alam-El Bueib formation, then later units deposited after faulting (Figure 12).
.png)
Figure 11b: Masajid-Safa structural correlation, Qasr oil field.
There has been vigorous debate over the tectonic forces which shaped the complex Mesozoic to Early Tertiary features across Egypt. Two models have been proposed to account for the structure of the north western desert area. One model (Figure13a) invokes an oblique extension to explain structures such as the Abu Gharadig Basin [20]. The model does not account for the total deformation of the area, particularly the variability of fault orientations. The other model stresses the importance of right-lateral compression and convergent wrench motion in determining the structural style of the region [21] (Figure 13b).
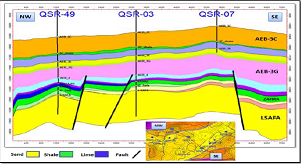
Figure 12: NW-SE Geologic cross section, Qasr oil field.
The basins of the western desert display a variety of alignments, their orientations being controlled by the tectonics of each orogenic period. The northern basins, like Shushan Basin, initially formed as a single rift, perhaps during the Permo-Triassic, which developed into a pull-apart structure [5].
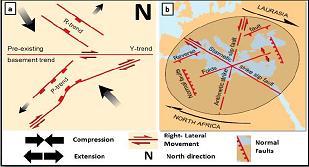
Later tectonic events are presumed to have split the original basin into a series of smaller compartments. The initial rift system, as seen in the Abu Gharadig Basin, was probably controlled by normal faults. The area of study was most probably affected by E-W trending normal faults during the opening of the Atlantic Ocean in the Jurassic. Later right-lateral compression resulted from the movement of Laurasia against North Africa, changed their trend into NE-SW faults with minor NW-SE trending folds. These compressive stresses are also responsible for the reverse faulting resulted by inversion in the Late Mesozoic.
Surface Structural analysis
The surface structures cropping out in the study area are deduced from the seismic interpretation of the available two-dimensional seismic reflection sections that oriented E-W and N-S. These faults are primarily dissected the considered sedimentary section from down upwardly reaching the earths surface sediments from the subsurface rock limits (the post Dabaa Formation of the Lower Miocene Moghra Formation or the Pliocene –Pleistocene loose sediments) as shown in Figure 14. These sediments may cover these younger faults causing concealing for the faults, in a way cannot be traced by the conventional field surveys or the non-conventional remote sensing analysis. These surface faults reflect the predominance of E-W faults (sometimes WNW-ESE and in other times ENE-WSW), then subordinatly NW-SE, and finally NE-SW (Figure 14). According to Abu El-Ata (1988), the age dating of these fault trends reveals that the scare NE-SW elements are of Late Cretaceous while the more pronounced NW-SE features are of Tertiary, and the most prevailed E-W elements are Quarternary [22]. This means that these surface faults are not of the same time interval, but some of them are older (NE-SW of the Syrian arc system), and remaining are youngest (E-W of the Mediterranean Sea system).
Relationship between Surface and Subsurface Structures and Subsurface ones
The structural evolution of the encountered faulting systems exhibits the relationships between the subsurface structures, presented by the structure contour maps of the subsurface rock unit (Figures 9, 10) and the surface ones as having been illustrated by the younger rock unit (Figure 14). However, the older rock units show faults of varying trends (NNW-SSE, NNE-SSW, NE-SW, NW-SE, and E-W), while the younger are introduced faults of NE-SW, NW-SE, and E-W trends, with the disappearance of the NNW-SSE and NNE-SSW trends, giving rise to the localization of the trends (NNW-SSE and NNE-SSW) to older times and the continuation of the other trends (NE-SW, NW-SE, and E-W) to younger times. According to Abu El-Ata (1988), in his work relating the local tectonics of Egypt with the plate tectonics of the surrounding regions (Southern Urops, Western Asia and Northern Africa) deduced six deformational systems [22]. The oldest, continental drift and rotation produced the Meridian system of folding and faulting (NNW-SSE) during the Precambrian-Early Paleozoic. The second, continental uparching and crustal rifting resulted in the Atlas system of folding and faulting (NNE-SSW) during the Late Paleazoic-Early Mesozoic. The third, continental separation and plate Convergence produced the Syrian arc system of folding and faulting (NE-SW) during the Middle Mesozoic –Late Mesozoic.
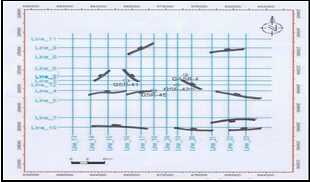
Figure 14: Surface Structural map as deduced from seismic interpretation.
The fourth, plate collision and oceanic rifting resulted in the Red sea system of faulting and folding (NW-SE) during the Early Tertiary. The fifth, plate divergence and sea-floor spreading produced the Mediterranean Sea system of faulting and folding (E-W) during the Late Tertiary. The youngest, plate transform and continental release resulted in the Aqaba system of faulting and folding (N-S) during the Quaternary. Appling this structural regime on the study area reflects that, the two older structural trends (NNW-SSE) and (NNE-SSW) are frequently occurred in the structure contour maps of the older units (Figures 9 and 10), while the three younger structural trends (NE-SW, NW-SE, and E-W) occurr in the structure contour maps of the younger subsurface units and the youngest structural trend (N-S) is missed in the studied area, for its limited thickness, that is mostly exhibited by the E-W (ENE-WSW and WNW-ESE) faults of the Mediterranean sea system (Figure 13c).
Conclusion
The Lower Cretaceous Alam-El Bueib formation contains multiple oil bearing sandstone reservoirs in the Qasr Field, north western desert of Egypt. Geologically, this oil and gas field belongs to the southeastern part of Shushan Basin, which was originated as a pull-apart basin in the Mesozoic. The interpretation of seismic and well data gave rise to figure the subsurface structural features of the Cretaceous section. Most of the Alam-El Bueib formation composed of clastics with noticeable carbonate proportions. The synthetic generation study of the Qasr -31 well showed that the reflection coefficient and the strength of reflectors are high for the AEB-1, AEB-3A, and AEB-3D horizons. The seismic lines interpretation shows the effect of NE-SW, NW-SE, and E-W trending normal faulting on the Lower Cretaceous Alam-El Bueib formationand is extended to the Upper Cretaceous Abu Roash Formation. The effect of folding is minimal but can be detected. These normal faults are related to the extensional tectonics which affected the north western desert of Egypt during the Mesozoic. One reverse fault is detected in the eastern part, and is related mostly to the inversion tectonics in the Late Mesozoic. The depth structure contour maps of the AEB-1, AEB-3A, and AEB-3D horizons show several major normal faults trending NE-SW and minor normal faults trending NW-SE. One larger branching normal fault trending E-W and lies to the south of the study area. These step-normal faults divide the area into a number of tilted structural blocks which are shallower in the south and deepen to the north. The elevated structural blocks along these normal faults show the three-way structural closure in some locations (i.e. faulted anticlines). The area of study was most probably affected by E-W trending normal faults during the opening of the Atlantic Ocean in the Jurassic. Later right-lateral compression resulted from the movement of Laurasia against North Africa, changed their trend into NE-SW faults with minor NW-SE trending folds. These compressive stresses are also responsible for the reverse faulting resulted by inversion in the Late Mesozoic.
Acknowledgements
We wish to express our most sincere gratitude and appreciation to the Egyptian General Petroleum Corporation (EGPC) and Khalda Petroleum Company (KPC) for their kind cooperation and permission to use the materials in this paper. Also would like to thank Dr. Mohamed Fathy Associate Professor of Geophysics, Faculty of Science, Al Azhar University, Cairo, Egypt for the help, time, and technical knowledge and materials. Special word of gratitude is due to Dr. Mohamed Salah Fagelnour, Khalda Petroleum Company, Cairo, Egypt for his fruitful and interesting discussions throughout this work.
References
1. EL Awdan A, Youssef F and Moustafa AR. Effect of Mesozoic and Tertiary deformations on hydrocarbon exploration in the northern Western desert, Egypt (2002) Am Assoc Petrol Geol Int Meeting, Egypt.
2. Moustafa AR. Mesozoic-Cenozoic Basin Evolution in the Northern Western desert of Egypt (2008) Salem M, El-Arnauti A and Saleh A (Eds.) 3rd Symposium on the Sedimentary Basins of Libya, Geology East Libya.
3. EGPC Egyptian General Petroleum Corporation. Western desert oil and gas fields (1992) In: EGPC 11th Petroleum Exploration and Production Conference, Egypt
4. Tarabees E and El-Qady G. Sea water intrusion modeling in rashid area of nile delta (egypt) via the inversion of dc resistivity data (1984) Well evaluation conference, Egypt.
5. Schlumberger. Well evaluation conference (1995) Algeria 56-87.
6. Said R. The geology of Egypt (1962) Amsterdam, New York, USA.
7. Khaled KA. Cretaceous Source Rocks at the Abu Gharadig Oil and Gas field, Northern western desert, Egypt (1999) J Petrol Geol 22: 377-395. https://doi.org/10.1111/j.1747-5457.1999.tb00475.x
8. Metwalli FI and Pigott JD. Analysis of petroleum system criticals of the Matruhe Shushan Basin, Western desert, Egypt (2005) Petroleum Geosciences, London, UK. https://doi.org/10.1144/1354-079303-593
9. Younes MA. Petroleum System in the Shushan Basin: A Mature Basin Leading to Future Exploration in the western desert of Egypt (2006) Search and Discovery Article #10107.
10. Shalaby RM, Abdullah WH and Shady AN. Burial history, basin modeling and petroleum source potential in the western desert, Egypt (2008) Bulletin of the Geological Society of Malaysia 54:103-113. https://doi.org/10.7186/bgsm54200817
11. Abdel Fattah M, Gameel M, Awad S and Ismaila A. Seismic interpretation of the Aptian Alamein Dolomite in the Razzak oil field, western desert, Egypt (2014) Arabian J of Geosciences 8: 4669-4684. https://doi.org/10.1007/s12517-014-1595-4
12. Abd-El Gawad EA, Elsheikh A, Afify W and Salem T. Petroleum System evaluation of Jurassic and Paleozoic sections in Faghur Basin, North western desert, Egypt (2015) IJSEAS 1.
13. Said R. The Geology of Egypt (1990) Balkema-Rotterdam-Brookfield, USA.
14. Sultan N and Halim MA. Tectonic Framework of northern western desert, Egypt and its effect on hydrocarbon accumulations (1988) Proc 9th E.G.P.C. Petrol. Explor & Prod Conf, Egypt.
15. Parker JR. Hydrocarbon Habitat of the western desert, Egypt (1982) EGPC, 6th Exploration Seminar, Cairo, Egypt.
16. Fagelnour MS, Metwalli FI and Shendi. Structural and facies modeling of the Lower Cretaceous Alam-El Bueib reservoirs in the Shushan Basin, western desert, Egypt (2018) Arab J Geosci 11: 553. https://doi.org/10.1007/s12517-018-3909-4
17. Metwalli FI, Shendi, EA H and Fagelnour MS. Seismic facies analysis of thin sandstone reservoirs, North western desert, Egypt (2019) J Petrol Explor Prod Technol.
18. Brown AR. Interpretation of Three- Dimensional Seismic Data (2004) AAPG Memoir, SEG Investigation in Geophysics 42: 665.
19. Bevan TG and Moustafa AR. Inverted rift-basins of northern Egypt (2012) Phanerozoic Rift Systems and Sedimentary Basins, Elsevier 483-507. https://doi.org/10.1016/b978-0-444-56356-9.00018-3
20. Petroleum Potential Evaluation of the western desert the Arab Republic of Egypt (1982) Robertson Research International, United Kingdom.
21. Meshref WM and Hammouda H. Basement tectonic map of northern Egypt (1990) E.G.P.C, the 10th Exploration and Production Conference, Cairo, Egypt.
22. Abu El-Ata and AM. The Relation between the Local Tectonics of Egypt and Plate Tectonics of the Surrounding Regions, Using Geophysical and Geological Data (1988) EGS Proceedings of the 6th Annual Meeting, Cairo 92-112.
*Correspondingauthor:
Dr.FaroukI Metwalli,Faculty of Science,HelwanUniversity,Cairo,Egypt;E-mail:pine_egypt@hotmail.com
Citation:
Keywords
Qasr oil field, Hydrocarbon, Shushan basin, Structural analysis.
