
 PDF
PDF
Introduction-The Importance of Corporate Valuation as a Topic in Finance
An excursion through the economics and finance literatures shows a deep focus on the valuation of a company. The company is usually valued along a series of economic indicators, involving the company and the market. The soft, human factor is also considered, such as the perception of how the company treats its employees, how the company pays attention to the environment, and so forth [1-3]. One need only listen and look at the daily news to see the clear evidence of companies trying to optimize their price by appealing both to the rational economics of their business and to represent themselves as guardians who uphold the publics values [4-6].
The notions of corporate reputation and HR (Human Resources) have become increasingly intertwined in the last decade. Corporate reputation is a function of corporate performance, as well as image of the corporation both in the press and in the social media, respectively. With the increasing prevalence and power of social media, and the rapidity with which negative information can be spread, it becomes increasingly important to understand the way the ordinary person converts messaging about the company to estimated price of a companys shares on the stock market. In recent years, researchers have moved from direct questionnaires to more direct measures. One of these is a simulated auction, where respondents are asked to invest in a new product [7]. Rather than instructing the respondent to rate how she or he likes or would purchase a product, the respondent is given some money, and asked either to bid or to invest. The foundational notion is that homo economicus is a more realistic judge of a product or company than is homo emotionalis. That is, when people are instructed to put up money, whether their own or hypothetical money, they tend to act more realistically than when they are instructed to rate their feelings. A lot of this effort can be found in the developing fields of Behavioral Economics and Behavioral Finance, which look at the softer, human side of what was once considered simply as a rational set of behaviors and decisions [8-10]. In previous studies, author Moskowitz presented an approach called Mind Genomics [11,12].
Mind Genomics is an emerging psychological science whose goal is to understand how people make decisions under uncertainty. Mind Genomics works by simple experiments, presenting the respondent with combinations of elements or ideas about a situation, e.g., a company, with these combinations created according to a systematic plan known as an experimental design. The respondent evaluates a set of these, which the messages repeating, but in different combinations. The experimental design ensures that the different elements are statistically independent of each other. The data generated by the respondent are analyzed by regression analysis to reveal how each message drives the rating. When Mind Genomics combines with economic aspects, such as price willing to pay, we enter a new world of what might be called Cognitive Economics. Rather than instructing the respondent to evaluate the test stimuli, the combinations or vignettes, in terms of emotion, we instruct the respondent to act as a more rational measuring instrument. The respondent is instructed to read a test vignette, i.e., a concept presenting information about the company, and then rate the company on an economic scale, in this study specifically the expected dollar price of a share. Observations from unpublished data suggest that when respondents rate vignettes on economic dimensions, specifically price related, they appear to be conservative. People may be interested in an idea and willing use extremes to express their feelings, i.e., that they love or hate the idea. When the rating becomes dollars, an economic variable, respondents are not loose and free with their economics-based evaluation.
Constrained, and there are fewer swings in the magnitude of the rating, even among those who are segmented by the patterns of what they like (so-called mind-sets). That is, people may love or hate what is represented in a vignette, but their ratings of the monetary value will be much narrower, and more logical. The Mind Genomics process and its application to behavior economics/behavioral finance. The origin of this study was the desire to understand how people respond to news stories about corporate governance and the behavior of employees. The study applies Mind Genomics to assess the finance-oriented response to messages about a corporation. The study shows the estimated dollar value of a share of company stoke that can be linked back to each of 16 different aspects of the messages, ranging from the role of the employee giving the information to the way the company demonstrates its values.
Mind Genomics combines Socratic methods with consumer research. The objective is to understand how people weight the different sources of information when choosing among alternatives. Rather than evaluating the stimulus in splendid isolation, Mind Genomics exposed people to combinations of messages about a topic and deconstructs the responses to these combinations into the contributions of the individual messages. The paradigm simulates the natural experience of individuals, first by showing combinations, and second by presenting these combinations quickly, obtaining the responses quickly, thus forestalling intellectualization of the problem. In the language of Nobel Laurate Daniel Kahneman, when writing about decision making, Mind Genomics employs System 1 thinking, the almost automatic, seemingly unthinking responses to the stimuli of everyday [12,13]. The steps below trace the implementation of the Mind Genomics experiments from problem definition to raw material, test stimulus, analysis, discovery of mind-types, and finally the application of the findings to understanding the larger population beyond the confines of the foundational study.
Step 1: Define the topic: The topic for Mind Genomics must be limited to something that can be explored in a simple study. The easiest version of Mind Genomics is afforded by the do-it-yourself program, BimiLeap (www.BimiLeap.com). BimiLeap works with 16 different elements, or statements/messages, related to a single topic, with each message painting a word picture appropriate to a topic. The topic is how different messages about a company drive the price a person would pay for a single share of stock. In simple terms, when a company talks about itself, either directly or through its employees, or through advertising and PR, what are the messages which might drive up the value of the companys shares, when the respondent is selected to an ordinary individual with moderate or higher annual income (> $ 50,000)?.
Step 2: Define four questions about the topic which tell a story: With the Socratic Method, the understanding comes from the pattern of answers to questions. The second step requires that the research ask four questions which revolve around the topic chosen in Step 1. Most researchers are accustomed to asking questions, but not accustomed to the discipline of a defined sequence of questions to elucidate a topic. Mind Genomics requires this laser-focus. Mind Genomics creates a library of integrated knowledge about the topic from the point of view of the human being. It is only by asking a set of related questions about a topic that one can move from the utterly general or the utterly granular to a structure which is almost systematic, archival, and integrated. Table 1 presents the four questions, followed by four phrases or answer for each question. It is clear from the questions that the study is dealing with the description of the individual, the companys behavior, and the customers behavior. These are the aspects which together tell one facet of the story of a company, as narrated by an individual working in the company.
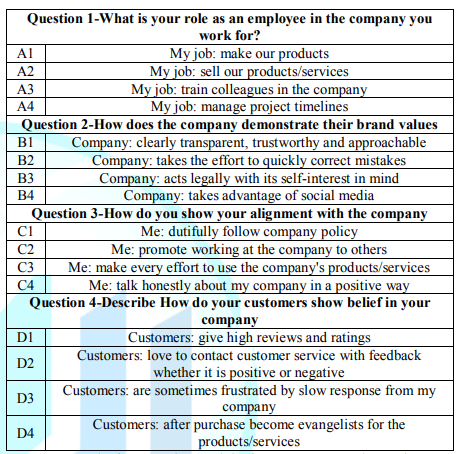
Table 1: The four questions and the four answers to each question.
Step 3: Provide four answers to each question or a total of 16 answers: It will be the answers which, in combination, constitute the test stimuli. Table 1 also shows the 16 answers. One of the most frequently asked questions revolves around the desire that there be right and wrong answers. The reality is that in these Mind Genomics explorations there are no right or wrong answers, but only different factoids to which a person responds. It is from the pattern of responses to these elements or answers, responses obtained in short, inexpensive, iterative experiment, that one understands the mind of a person. The questions and the answers in Table 1 are simply first approximations. They will suggest patterns, but they can always be improved, and re-tested, with some questions and answers eliminated new questions and answer inserted, and the process repeated. At some point the relevant patterns will emerge clearly.
Step 4: Mix the answers (elements) into small, easy to read combinations, so-called vignettes: Each respondent evaluates a unique set of 24 vignettes. Each vignette comprises 2-4 answers, at most one answer from each question, but for a some vignettes the structure deliberately creates incomplete vignettes, with some questions not providing answers for the vignette. This incomplete design structure allows for the model, the equation, to generate coefficients which have absolute, i.e., ratio-scale properties, with a 2 being twice as much as a 1 and half as much as a 4. The rationale for the individual-level experimental design is that in the analysis it will be important to create individual models or equations relating the rating to the presence/absence of the 16 elements. When the combinations are created by experimental design at the respondent level one can be sure of being able to create these individual equations. The rationale for the uniqueness of combinations for each respondent is the desire to cover the space of possible combinations. In most studies using experiment design, the researcher presents the same set of combinations to many respondents, so that the noise is averaged out. Mind Genomics goes in a different direction, assessing many different combinations or vignettes, as many as 1200 for 50 respondents. The noise or extraneous variation is cancelled out, not so much by noise-cancelling repetition, but rather because the pattern emerges more clearly when the test stimuli cover most of the design space. Metaphorically, Mind Genomics can be likened to the MRI of the mind, which creates an image by combining pictures taken from different angles, i.e., from vignettes created from many different combinations.
Step 5: Create an
orientation paragraph to the topic, and an appropriate rating scale: The orientation
paragraph should be as general as possible in order not to bias the respondent.
Here are the orientation paragraph and the rating scale. Both are minimal in
terms of text, yet have a time frame, and a sense of economic reality. Please
read the entire screen. It describes a company going into the stock market in 6
months.
Please tell us what you think the price will be. 1=$ 1/share…9=$ 100/share.
Rate the price per share 1=1 $/share… 9=$ 100/share.
Mechanics-setting up the Mind Genomics study
The Mind Genomics process is straightforward to set up, and is aided by a user-friend app, BimiLeap (www.BimiLeap.com). The app guides the researcher towards creating the questions and the answers, as shown in Figure 1, on the left and middle panels, respectively.
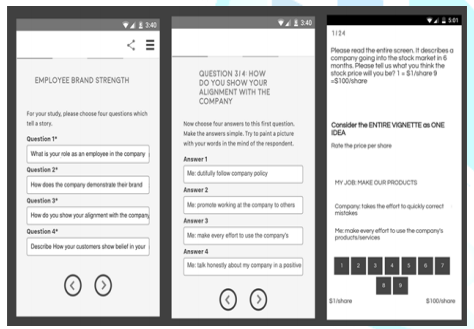
BimiLeap creates 24 combinations of vignettes for each respondent. Each vignette or combination comprises 2-4 elements or answers, at most one answer from each question. The basic experimental design ensures that all 16 elements are statistically independent of each other. Each respondent evaluates an individual permuted experimental design, with the property that the vignettes or combinations evaluated by each respondent are generally different from the vignettes evaluated by every other respondent [14]. The structure of the design remains the same, but the combinations change. Figure 1 (right panel) shows an example of a vignette as the respondent would see the vignette on a smartphone. The respondent receives an email link from the on-line panel provider (Luc.id, Inc.), with the panel provider specializing in on-line surveys and experiments. The respondents, already members of the 20+ million panels from Luc.id, open the invitation, and if interested, begin the study.
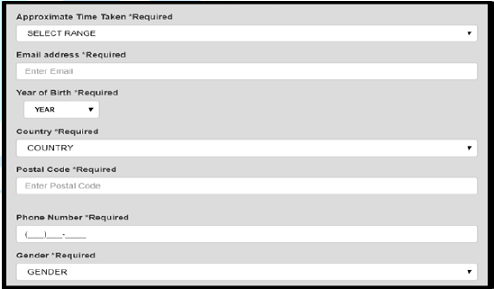
The typical study lasts approximately 3-5 minutes and is usually done with the respondent paying modest attention to the task. The fact that the respondent is not fully engaged in the study, but rather just does it, is important to the success of Mind Genomics. It means that the respondent is using system 1 thinking, which is automatic, and represents the typical way people think about every day, unimportant issue. Considered opinions, system 2 thinking, may force the respondent into thinking in a rational, considered way, atypical for everyday life [13]. The respondent begins by answer three questions about gender, age, and a third question dealing with interest in the news stories about corporations. The objective of self-profiling is to understand how the respondent describes himself or herself, and she or he approaches the topic of news stories about corporations. The deeper information will come from the pattern of responses, not from the classification.
Analysis
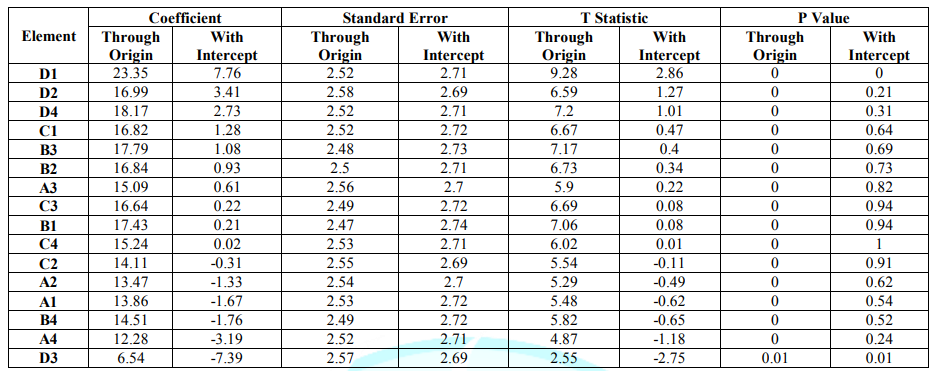
Mind Genomics studies follow a simple structure for analysis. The experimental design enables the creation of models relating the presence/absence of the 16 elements to the dollar value that the respondent thinks that a single share should command. To estimate the contributions of each element to the dollar value of a share, and thus to the perceived value of the element, we use the method of OLS, ordinary least-squares regression, also known as curve fitting. The analysis uses the full set of data for a key subgroup, e.g., gender, to estimate the coefficients of the following equation: Estimated Dollar Value=k1 (A1) + k2 (A2) … k16 (D4). The equation states simply that the estimated dollar value of one share of stock in the corporation, as estimated by the respondent, is a weighted sum of the dollar values of each element, respectively. The higher the coefficient, the great the dollar contribution. When we look at the equation above, we see immediately that the equation lacks an additive constant (intercept), k0, which corresponds to the dollar value of a share in the absence of elements. The additive constant is meaningful when we talk about feelings, such as the likelihood of buying the stock. In that case, the additive constant tells us the basic interest in the stock, based upon the copy. When we deal with the actual price that would be paid, the additive constant has less meaning. To establish the statistical significance of the coefficient, we follow a two-step procedure, based on estimating the equations both with an additive constant, and without an additive constant, respectively. The two steps allow us to calibrate the coefficients and estimate statistical significance. The first step involves estimating the coefficients with an additive constant and without an additive constant, respectively, for the same data set, here the 1200 observations from the total panel.
Table 2 shows the data for the 16 coefficients. The additive constant is irrelevant here. We focus only on one the coefficients emerging from the two methods of estimating, with an additive constant (intercept), and without an additive constant (through the origin). The two sets of 16 coefficients virtually perfectly co-vary. Figure 2 (left panel) shows for these data how the T statistic varies with the value of the coefficient. We look for a T statistic of 2.0 to define a significant level. The left panel suggests a coefficient of +5 for the equation or model with an additive constant.
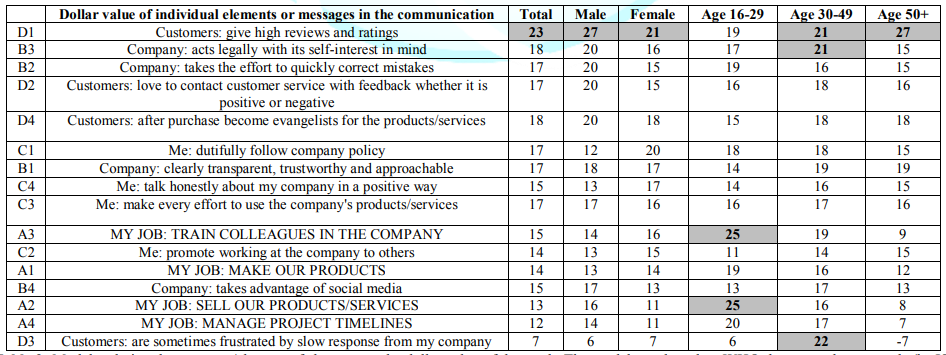
In turn, the right panel of Figure 2 shows that a coefficient of +5 for an equation with an additive constant (our threshold of significance), corresponds to a coefficient of approximately +20. Thus, we assume that the coefficient of +20 or higher for an equation or model without an additive constant, i.e., without an intercept, a model which goes through the origin. Table 3 shows the coefficient for six groups, based upon who the respondents say they are. The groups are Total, Gender, and Age. To make the extraction of key messages easier, Table 3 shows the strong coefficients in bold, and in shaded cells. Strong is defined as a dollar value for the element of $ 21 or higher.

Although the respondents did not estimate the dollar value of each message as a contributor to likely stock price, the regression model enables the estimation of the dollar value. The use of inferential statistics to determine significance is less relevant than a holistic view of the patterns separately strong performing elements driving high dollar values from weak performing elements driving low dollar values. There is very little in terms of general population. It may well be that no elements really drive estimated price willing to pay, or, as other observations suggested, there are differences in price traceable to how people think of themselves, not traceable to who they are suggests the importance of one element only across groups: Customers: give high reviews and ratings.
How the individual giving the information drives the estimated stock price
The Mind Genomics experimental design permutes the different designs to create 50 different sets of 24 vignettes, most of which differ from each other. It is thus possible to isolate vignettes which the same presenter, defined as the person doing the talking. These are the vignettes whose first element begins with the words MY JOB.
By sorting the vignettes into the five groups, one group for each of the five answers to Question A, one comes up with a set of homogeneous vignettes in terms of who is presenting the information. The presenter may be either no person (A0), a person who makes the products (A1), a person who sells the product (A2), a person who trains (A3), or a person who manages project timelines (A4), respectively. When we build a model for each of the five strata, the question immediately becomes whether the presenter of the information can drive the price of the other elements or messages. All other factors held constant, does the who does the saying affect the estimated price for a share of stock?
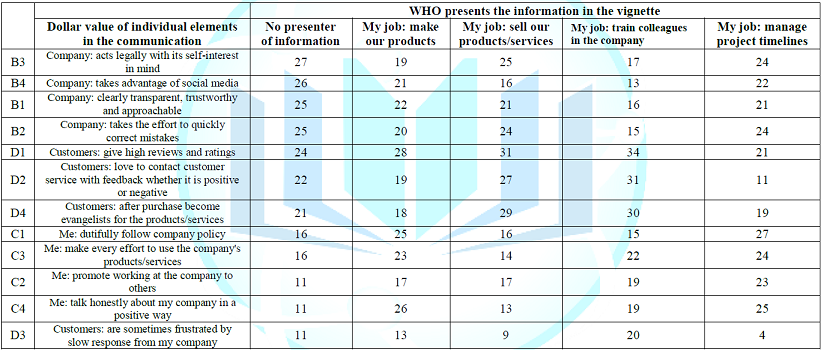
Table 4 shows the analysis of the data, comprising five equations, one for each of the five groups defined by defined by WHO presents the information. There are only 12 coefficients, one for each of the remaining elements. The four elements corresponding to WHO present the information are no longer part of the model because they are held constant for each model. For these vignettes we raise the criterion of an important element to a slightly higher dollar value of $26 or more for one share to simplify the table. Depending upon who does the presenting, the other elements show variation in the dollar values they command, suggesting that the presenter acts as a director or anchor.
No Defined Presenter
Company: acts legally with its self-interest in mind
Company: takes advantage of social media
Note: Providing news without identifying who said it maintains estimated share value. Providing an employee as source of information decreases estimated share value.
Those who MAKE the products
Customers: give high reviews and ratings
Me: talk honestly about my company in a positive way
Those who SELL the products
Customers: give high reviews and ratings
Customers: love to contact customer service with feedback whether it is positive or negative
Customers: after purchase become evangelists for the products/services
Those who TRAIN within the company
Customers: give high reviews and ratings
Customers: love to contact customer service with feedback whether it is positive or negative
Customers: after purchase become evangelists for the products/services
Those who MANAGE timelines
Me: dutifully follow company policy
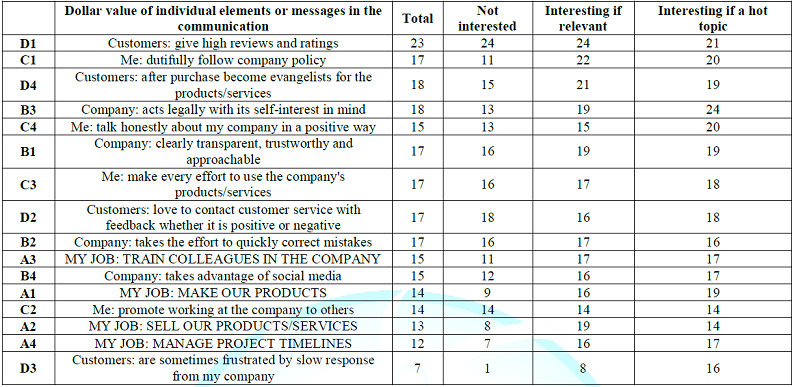
The dollar value based upon the interest in stories about companies and their employees/customers
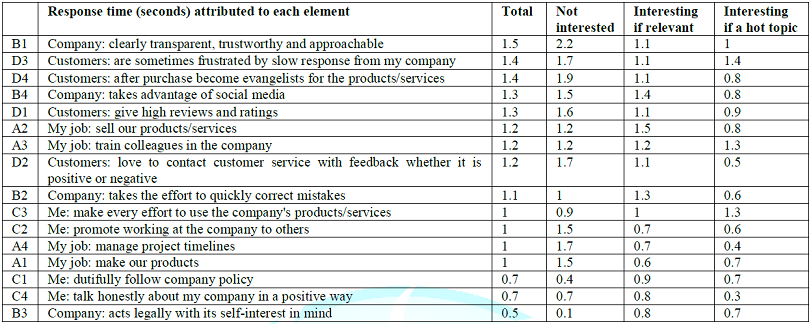
At the start of the experiment, the respondent was asked to select one of three descriptions about interest in how companies treat their customers and how their employees feel. There were four answers, collapsed to three by combining those who selected not interested with those who selected not applicable. Table 5 presents the dollar values for the total panel and for the three groups defined by how they feel about these kinds of stories. The key results from are that there only five relevant elements which drive a contribution to the estimated stock price, with the one element extraordinarily important for the stock price, Customers: give high reviews and ratings Table 5. The other elements add to the value of the stock, but not in a consistent way across all respondents. The key here is reviews and ratings from customers
· Me: dutifully follow company policy
· Customers: after purchase become evangelists for the products/services
· Company: acts legally with its self-interest in mind
· Me: talk honestly about my company in a positive way
It is important to note that in the Mind Genomics experiment, the test vignettes are presented and respondent to so quickly that the strong performing elements emerge almost automatically, without much conscious processing.
Mind-Sets, people who think alike with respect to the messages which drive value
One of the major tenets of Mind Genomics is that in every topic, there are different groups of ideas which flow together. These are ideas, not people, but it is only by studying the response of actual people to these ideas is it possible to discover these different groups of ideas, or so-called, metaphorically, mind-genomes.
In simple terms, one can think of a mind-genome as a set of ideas, the combination of which make sense and gives us a feeling that there is a coherent theme. Moving further into the metaphor, the notion is that there are probably a limited number of mind-genomes for any topic, that these genomes representing different mental primaries of a topic, and that the mind-genomes may be uncovered through the analysis of a persons pattern of responses to a set of relevant stimuli. The mind-genomes are uncovered empirically. They may be hypothesized to exist, based upon ones experience, but the real test is whether these coherent groups of ideas can be demonstrated. The approach to discover the mind-sets uses the statistical method of clustering. The clustering is done on the pattern of coefficients generated by each respondent in order to discover groups or clusters of individuals showing similar patterns of coefficients. The name of the cluster (renamed mind-set) comes from the commonality of the highest scoring coefficients in the cluster. There are two steps requiring judgment. The first is interpretability-does the pattern make sense? The second is parsimony is it possible to develop only a limited number of patterns which cover the range well, albeit not necessarily perfectly? Mind Genomics provides the appropriate data for clustering.
The inputs are the 50 rows of data, one row for each of the 50 respondents. The columns are the 16 coefficients, each column being the dollar value of the specific element for the specific respondent. It is now, in the clustering phase, that we see the power of the individual-level modeling, made straightforward by the experimental design. Each respondents ratings can be immediately analyzed by OLS regression to estimate the 16 dollar-values for one share of stock, a dollar value for each of the 16 elements. Statisticians have provided many methods for clustering. The clusters, groups of like-objects are not fixed in stone, but rather are constructed according to objective mathematical criteria.
The clusters themselves are simply a collection of objects which fulfill the clustering requirements but may not have meaning when interpreted. It is left to the researcher to decide the clustering method to use and within that method to choose the number of clusters to create. In the end, the action of clustering is more of a heuristic to identify patterns in the data rather than the specification of tight, non-overlapping groups [15]. For the price data, the clustering method, so-called k-means, defines a distance between every pair of respondents based on a definition of distance in quantitative terms. Distance for this study is defined by the dissimilarity of two patterns, one per respondent, based upon the dollar values of the 16 elements. The actual measure of distance is (1-R), where R is the Pearson correlation between the two respondents, using the 16 dollar-values as cases.
The Pearson R reaches a high of +1 when the two patterns are perfectly related to each. In that case, with R=1, the distance is 0 (1-1=0). The Pearson R reaches a low of -1 when the two patterns are perfectly, but inversely related to each other, so that increases in the dollar value of Respondent A is counterbalanced by the same relative magnitude of decrease for Respondent B. In that case, the distance is 0 (1 - -1 = 2). When the clustering process finishes, it emerges with two, three, or, when necessary, even more groups. These groups are quite different in the patterns. The important thing for Mind Genomics is that these clusters or Mind-Sets are parsimonious (few) and interpretable (tell a story). Table 6 shows the dollar value of the different elements, by total, and then by two mind-sets.
The mind-sets make sense when we look at the dollar values. The clusters or mind-sets are not dramatic. Often, a different rating scale calling into play emotion instead of price generates more dramatically different mind-sets. The one overwhelmingly strong element is D1 (Customers: give high reviews and ratings.) That strong performing element may reflect the increasing use of customer feedback mechanism as a business tool, both for improving the business and for communicating the business to those who buy of products and services. Beyond the strongest element there are two clearly different mind-sets. Mind-Set 1 (MS1) assigns high share values to messages about good corporate governance. Mind-Set 2 (MS2) assigns high share values to messages about customer intimacy and involvement.
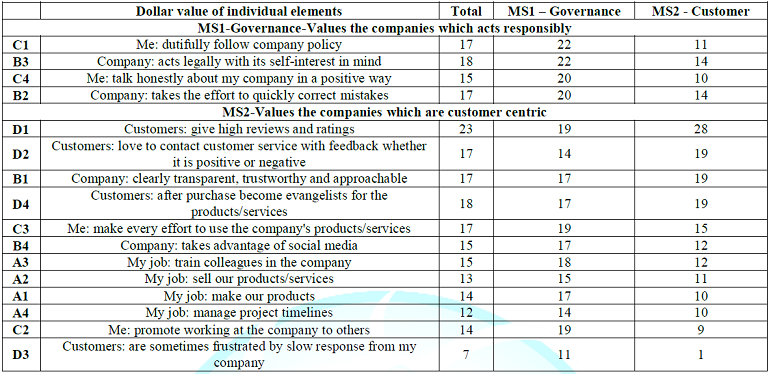
Table 6: Dollar values of the elements by total and two emergent mind-sets.
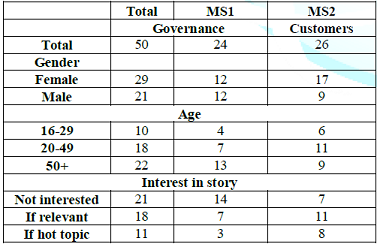
Finding these respondents in the population
A recurrent issue in Mind Genomics is the realization that although the mind-sets are clearly different from each other, the reality is that they are spread through the population. Table 7 shows the distribution of mind-sets across gender, age, and ones own attitude about stories dealing with a business. There is no simple pattern. The temptation is always to abandon the Mind Genomics segments, the mind-sets, in favor of easier groups to reach, such as clusters of individuals based upon who they ARE, based upon what they SAY about general topics such as business or society, or based upon what they DO. There is also the temptation to give these individuals an extensive and onerous self-profiling questionnaire. The effort to find some way to figure out the patterns of membership in a mind-set collapses under the heavy weight of the questionnaire. The inevitable consequence is the resort to very large-scale segmentations of a general, a segmentation which has little relevance to the delimited, specific, and rather defined topics which need the segmentation the most.
Authors Gere with Moskowitz have developed an algorithm to classify individuals as members of one of two mind-sets, or one of three mind-sets, respectively. The algorithm is called the PVI, the Personal Viewpoint Identifier. The algorithm works with the coefficients of the model, identifying six elements, turned into questions that are answered with NO/YES, or with some other 2-point scale. The patterns of 64 patterns of answers (26=64) are mapped to mind-sets. The underlying data from the experiment are perturbed by noise 20,000 times, to see which patterns best assign hypothetical people to the correct mind-set. Figures 3A and Figure 3B shows the PVI. Acquires the personal information of the respondent, but maintains privacy [16].
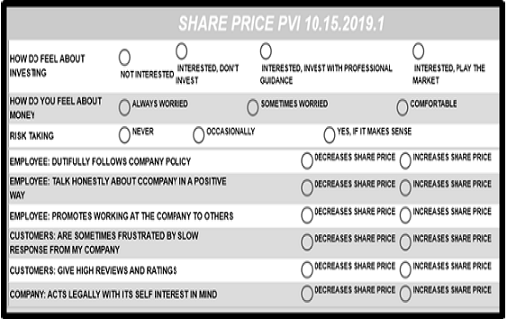
Presents the actual set of six questions, randomized for each respondent. The PVI return with the assignment of the individual to the mind-set, along with additional information. The PVI provides a rapid device to understand the mind of the individual, in terms of whether the individual belongs to Mind-Set 1 focusing on good corporate governance or belongs to Mind-Set 2 focusing on customer intimacy and customer delight.
Beyond price to engagement-response time
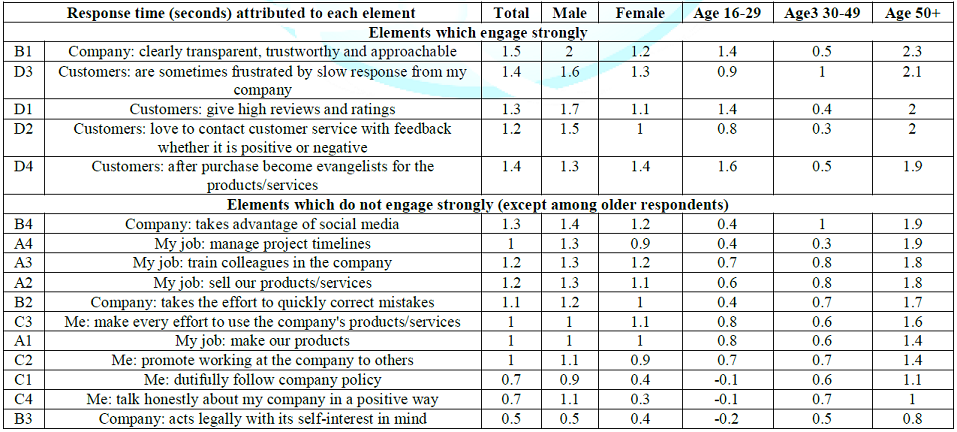
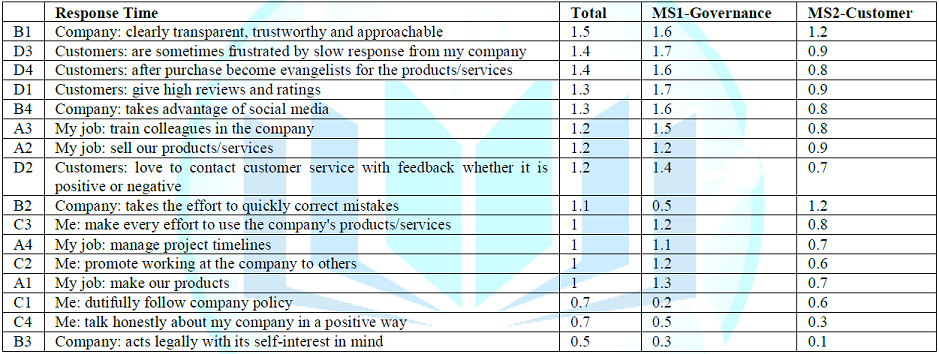
An evolving topic of consumer research is so-called objective measures which assess physiological parameters, rather than direct rating. An increasingly popular, but unproven, belief holds that these objective measures, generally physiological in nature, represent the true response of a person when control with a stimulus. Perhaps the oldest of these objective measures is response time or reaction time, the time between the appearance of the stimulus and the response. BimiLeap, measures the time from the appearance of the vignette to the response, and then deconstructs this response time to the estimated response times of the individual elements in the vignette. The longer times are assumed to reflect engagement and/or difficulty in comprehension. The analysis to create the models for response time follows the same path as before, OLS regression but without first transforming the dependent variable. The independent variables are the 16 elements which take on the value 1 when present in the vignette, or 0 when absent from the vignette. The dependent variable is the number of seconds, measured to the nearest tenth of second. Any response longer than 9 seconds is brought to 9 seconds, under the assumption that it never takes more than seven or eight seconds to read a short vignette, and so the respondent must be otherwise occupied, perhaps multi-tasking. Just because an element takes a while to process, generating a long response time, does not mean it will be interesting, or lead to an increase or decrease in estimated share price Rather, at this stage of development in the study of messaging we must simply report it, and uncover patterns which are apparent. As noted above, the elements themselves are cognitively rich messages. The pattern should emerge from both the meaning of the elements, and from the morphology, e.g., the length of the element in words and letters. Table 8 shows the estimated response time attributed to each element. We have operationally classified the elements into two groups, the first being those which engage and are defined as response times of 1.5 seconds or longer, except for the response times of the older respondents, age 50+, who generally respond to all the stimuli more slowly.
The other groups are those elements which fail to engage. These non-engaging elements are operationally defined as generating response times of shorter than 1.5 seconds. It is important to keep in mind that with the developing science of Mind Genomics we are only beginning to create a database of response times for different types of messages. From studies already run but not reported here, the first generalization which is emerging is that serious messages, those pertaining to a persons health, insurance, or immediate well-being, are characterized by longer response times, often 2.0 seconds or longer. The second generalization which is emerging is that those elements dealing with the everyday, products and services which are promoted by advertisements tend to have much shorter response times. Our data for the corporation is somewhere in the middle, being neither daily and trivial, or serious. Table 8 reveals that, in general, males engage with the messages longer than do females.
There are notable differences in response times, with males looking much longer at element B1 (Company: clearly transparent, trustworthy and approachable) and element C4 (Me: talk honestly about my company in a positive way). Both elements are expressions of openness, which appears to engage the male reader, but not the female reader. Our third grouping of the respondent, by emergent mind-set based upon the pattern of dollar values, suggested two minds, MS1 valuing governance, and MS2 valuing customer centricity. Table 10 shows the response times and reveals the dramatic difference between the two mind-sets. MS1 values governance, but reads many of the elements slowly, especially those focusing on customers. MS2 values customers but reads everything twice as fast. MS2 are radically different from MS1, both in what they value, and their engagement with what they read.
Discussion and conclusions
The contribution of Mind Genomics to finance, and specifically to the study of Behavioral Finance comes from the ability of the Mind Genomics research approach to uncover responses to stimuli, even when the individual is not aware of them. The ingoing assumption is that the human being, rational or irrational, must respond in ordinary life to continuing changing arrays of information. It is obvious from observing transactions between people or between a person and an information-bearing object that these behaviors appear guided, reproducible, and for the most part reasonably rational.
A key feature of the paradigm shown here is that the stimuli are cognitively meaningful. That is, it is the stimuli themselves and thus the information that they convey, which are the clues to the respondent strategy. It is not necessary to look very far beyond the strong performing messages to discover what is common about those messages, and different from the messages which perform poorly. By putting the respondent in the position of receiving different combinations of information varied by experimental design it becomes possible to understand the criteria by which a respondent makes the decision. The respondent need not explain the criteria to reveal the pattern, although the respondent may be questions about why her or his behavior followed a certain pattern, e.g., selecting information featuring people. If one were to speculate about next steps for Mind Genomics as a contributor to Behavioral Economics and Behavioral Finance, one path might be selecting the different steps in finance, specifically those involving choice. The steps might first be reduced to topics, ranging from the nature of what is being chosen, the alternative compositions of what is to be chosen, and perhaps even the human actions involved in what is being chosen. There might be many dozens of these topics, and perhaps a dozen or more set of variations of the topic in terms of the questions, and the answers.
The answers might be emotions (interest in purchasing; emotion experience when reading the vignettes; price willing to pay; future success, and so forth). The result would be several hundred to a thousand or more simple studies, each executed with 50-100 different respondents, and generating an entirely new corpus of knowledge in Behavioral Economics and Behavioral Finance, a corpus of information perhaps best called Cognitive Economics or Cognitive Finance. The words of Pandit and Srivasta and a decade before them, Ritter are worth quoting in their entirety as the final words to this paper:
· Mergers and Acquisitions is considered as a financial expert job but it is more a job of market analysts, of economists and of psychologists. Winning over trust and commitment of target companys employees is the main driver for post-merger synergy. Pre-merger, there is a flurry of activities. Post-merger operations go on as per the culture of the Acquiring Company [17].
· The two building blocks of behavioral finance are cognitive psychology (how people think) and the limits to arbitrage (when markets will be inefficient). The growth of behavioral finance research has been fueled by the inability of the traditional framework to explain many empirical patterns, including stock market bubbles in Japan, Taiwan, and the US [18].
Acknowledgements
Attila Gere thanks the Premium Postdoctoral Researcher Program of the Hungarian Academy of Sciences.
References
1. Faleye O and Trahan EA. Labor-friendly corporate practices: Is what is good for employees good for shareholders? (2011) J Business Ethics 101: 1-27. https://doi.org/10.1007/s10551-010-0705-9
2. Fauver L, McDonald MB and Taboada AG. Does it pay to treat employees well? International evidence on the value of employee-friendly culture (2018) J Corporate Finance 50: 84-108. https://doi.org/10.1016/j.jcorpfin.2018.02.003
3. Glean A and Robison CJ. Corporate versus environmental new: What matters in the valuation of green companies in emerging markets? (2017) SSRN. https://doi.org/10.2139/ssrn.3007871
4. Gompers P, Ishii JL and Metrick A. Corporate governance and equity prices (2003) Quarterly J Economics 118: 107-155. https://doi.org/10.1162/00335530360535162
5. Goncharov I, Werner JR and Zimmerman I. Does compliance with the German corporate governance code have an impact on stock valuation? An empirical analysis (2006) Corporate Governance: Int Rev 14: 432-445. https://doi.org/10.1111/j.1467-8683.2006.00516.x
6. Hermalin BE. Understanding firm value and corporate governance (2010) SSRN. http://dx.doi.org/10.2139/ssrn.1652907
7. Franke N and Piller F. Value creation by toolkits for user innovation and design: The cases of the watch market (2004) J product innovation manage 21: 401-415. https://doi.org/10.1111/j.0737-6782.2004.00094.x
8. Fromlet H. Behavioral finance-theory and practical application: Systematic analysis of departures from the homo oeconomicus paradigmare essential for realistic financial research and analysis (2001) Business Econ 36: 63-69.
9. Luo X and Bhattacharya CB. Corporate social responsibility, customer satisfaction, and market value (2006) J marketing 70: 1-18. https://doi.org/10.1509/jmkg.70.4.001
10. Madden BJ. The purpose of the firm, valuation, and the management of intangibles (2017) J Applied Corporate Finance 29: 76-86. https://doi.org/10.1111/jacf.12235
11. Moskowitz HR. Mind genomics: The experimental inductive science of the ordinary, and its application to aspects of food and feeding (2012) Physiol Behav 107: 606-613. https://doi.org/10.1016/j.physbeh.2012.04.009
12. Moskowitz HR and Gofman A. Selling blue elephants: How to make great products that people want before they even know they want them (2007) J Product Innovation Management 25: 637-638. https://doi.org/10.1111/j.1540-5885.2008.00327_3.x
13. Kahneman D. Thinking, fast and slow (2011) Farrar, Straus and Giroux, Macmillan publishers, New York, USA.
14. Gofman A and Moskowitz H. Isomorphic permuted experimental designs and their application in conjoint analysis (2010) J Sensory Studies 25: 127-145. https://doi.org/10.1111/j.1745-459x.2009.00258.x
15. Dubes R and Jain AK. Clustering methodologies in exploratory data analysis (1980) Advances Computers 19: 113-238. https://doi.org/10.1016/s0065-2458(08)60034-0
16. Goddard M. The EU General Data Protection Regulation (GDPR): European regulation that has a global impact (2017) Int J Market Res 59: 703-705. https://doi.org/10.2501/ijmr-2017-050
17. Pandit S and Srivastava RK. Valuation in merger process (2016) J Teaching Educatn 5: 361-370.
18. Ritter JR. Behavioral finance (2003) Pacific-Basin Finance J 11: 429-437. https://doi.org/10.1016/s0927-538x(03)00048-9
*Corresponding author
Howard Moskowitz, Mind Genomics Associates, Inc. White Plains, NY, USA, Email: mjihrm@gmail.com
Citation
Moskowitz H, Baum E, Rappaport DS and Gere A. Estimated stock price based on company communications: mind genomics and cognitive economics as knowledge-creation tools for behavioral finance (2019) Edelweiss Appli Sci Tech 3: 60-69.
Keywords
General marketing, Computer technology, Personal viewpoint identifier.
