Explore journal overview, editorial leadership, indexing, articles in press, latest published work, and highlights from previous issues.
Research Article :
Fluorescence study on inclusion interaction of
bimatoprost in absence and presence of β-cyclodextrin shows significant
increase in native fluorescence of bimatoprost in the presence of
β-cyclodextrin. Fluorescence spectroscopy of host-guest interaction between
bimatoprost and β-cyclodextrin shows formation of inclusion complex with 1:1
stoichiometric ratio. The changes of native fluorescence of bimatoprost on
inclusion in the hydrophobic β-cyclodextrin cavity is used to calculate the
association constant.The fluorimetric method was used for determination of
bimatoprost in absence and presence of 1% (w/v) β-cyclodextrin. The studied
drug shows native fluorescence at λem 285 after excitation at λex 217 nm in
water. The quantum yield [QY] was calculated in absence and presence of β-CD
and it was found to be increased from 0.26 to 0.31. The different experimental
parameters affecting the fluorescence of the drug was carefully studied and
optimized. Linearity was over the range of 25 – 250 ng/mL and 5 – 50 ng/mL in
absence and presence of β-CD, respectively with detection limits of 0.05 and
0.006 ng/mL, and quantitation limits of 0.18, and 0.02 ng/mL in absence and
presence of β-CD, respectively. The proposed methods were validated as per ICH
guidelines, and were effectively applied to analysis of studied drug in its
ophthalmic formulation. The results obtained were statistically compared with
the reported method revealing high accuracy and good precision. The proposed
methods are challenging to green. Qualitative and quantitative metrics revealed
excellent eco-friendly fluorimetric method for application in QC laboratories. Bimatoprost,
(7-[3,5-dihydroxy-2-(3-hydroxy-5-phenyl-pent-1-enyl)- cyclopentyl]-N-ethyl-hept-5-enamide),
is antiglaucoma agent
(ophthalmic); antihypertensive[1]. Bimatoprost is a
prostaglandin analog/prodrug used topically (as eye drops) to control the
progression of glaucoma
and in the management of ocular
hypertension. It reduces Intraocular Pressure (IOP) by increasing the
outflow of aqueous fluid from the eyes. It has also been used and prescribed
off-label to lengthen eyelashes [2-8]. A
literature survey revealed few methods for determination of bimatoprost. Ultra
Performance Liquid Chromatography (UPLC) with MS was reported for determination
of the drug in presence its impurity (methyl ester) [9]. Another two HPLC
methods were reported for determination of bimatoprost in bulk and ophthalmic
solution [10,11], and HPLC-Tandem Mass Spectrometry Measurement of Bimatoprost,
Latanoprost and Travoprost in Eyelash Enhancing Cosmetic Serums[12]. Also
literature reveals there is no spectrofluorometric method was reported for
bimatoprost. Spectrofluorimetric
method proved to be more selective than normal UV-spectroscopy due to
quantitation of substance at characteristic excitation and emission
wavelengths. [13]. The
objective of the presented work was to develop simple, economic, sensitive and
rapid green analytical method for the quantitative determination of bimatoprost
in drug substance, in ophthalmic dosage form, and in presence of interfering
substance (benzalkolium chloride) by enhanced native spectrofluorimetric
method. The fluorescence enhancement of a highly sensitive spectrofluorometric
method is based on investigation of the fluorescence spectral behavior of
bimatoprost in aqueous organized system β-CD. The host-guest interaction
between bimatoprost and β-cyclodextrin inclusion complex was studied and the
association constant was calculated. Cary
Eclipse fluorescence
spectrophotometric (USA) connected to IBM-PC computer and HP laser jet 1100
series printer. The emission of all samples was recorded against a solvent
blank in 1 cm quartz cuvettes and scanning at the following parameters:Band
width = 1.5 nm, speed = 1200 nm/min, Data Interval = normal (1nm), Smoothing =
high, Jenway Digital pH meter model 8417 was used for adjusting the pH. Shimadzu
Model RF-160, UV/VIS spectrophotometer was used. Pure sample: Bimatoprost was
kindly supplied by Chemipharm Co., Egypt. Its purity was found to be 99.80%
according to the manufacturer method [14]. Market samples: Lumigen™ ophthalmic
solution was labeled to contain 0.03%, El -Sofikopharm Co., Egypt; Batch
No. 85543 was purchased from the market. Chemicals: All chemicals
used were of analytical reagent grade and solvents were of HPLC grade. Acetonitrile,
methanol, ethanol, and acetone (Macron fine chemicals, Poland), sodium
hydroxide (Merck, Darmstadt, Germany), β- Cyclodextrin Sigma Aldrich (Germany),
Benzalkolium chloride Sigma Aldrich(Germany), Double distilled water was used
throughout all experiments after filtration through a 0.47 μm membrane filter
(Alltech Associates, USA). A
stock standard solution of bimatoprost (0.1 mg/mL) was prepared by dissolving
10.00 mg of bimatoprost in water in 100 mL volumetric flask and the volume was
completed to the mark with the same solvent. Working standard solution (10
μg/mL) was prepared by transferring 10 mL of stock solution into a 100 mL
volumetric flask and completed to the mark with water. a. In absence of 1% β-CD: Aliquots
equivalent to 250- 2500 ng/mL of the working standard solution is transferred
into a series of 10 mL volumetric flasks completed to the mark with water to
give a final concentration range of 25.00-250.00 ng/mL. In presence of
1%(w/v) β-CD: Aliquots
equivalent to 50 – 500.0 ng/mL of the working standard solution were
transferred into a series of 10 mL volumetric flasks by graduated micropipette followed
by 1.5 mL of 1% (w/v) β-CD and then completed to the mark with water to give a
final concentration range of 5 – 50.00 ng/mL. The
fluorescence intensity was measured versus the concentrations of the drug
(ng/mL) at λem 285 nm after excitation at λex 217 nm. The calibration graphs
were plotted. Then the regression equations were computed for the drug in
absence and presence of β-CD respectively. Application: The proposed
methods were successfully applied for the determination of bimatoprost in its
pharmaceutical dosage form Lumigan™ (Bimatoprost ophthalmic solution, labeled
to contain 0.03%). A Stock solution was prepared by mixing the content of three
bottles (9 mL) in a stopper conical flask. Each milliliter was equivalent to
0.03 mg of bimatoprost. In absence of 1%
β-CD: An
accurately measured volume of ophthalmic solution equivalent to 3 µg
bimatoprost was transferred to volumetric flask of 10 mL capacity. The volume
was completed with water. Then transfer 5.0 mL of dosage stock solution to
volumetric flask of 10 mL capacity and completed with water to obtain solution
equivalent to 150 ng of bimatoprost. In presence of 1%
β-CD: An
accurately measured volume of ophthalmic solution equivalent to 3.0 µg
bimatoprost was transferred to volumetric flask of 10 mL capacity. The volume
was completed with water. Then transfer 0.5 mL of dosage stock solution to
volumetric flask of 10 mL capacity, followed by 1.5 mL of 1% (w/v) β-CD and
completed the volume with water to obtain solution equivalent to 15 ng of
bimatoprost. The nominal content of the eye drop was determined using either
the calibration graph or the corresponding regression equation. Specificity: Accurately
transfers 10 mg of Benzalkolium
Chloride to 10 mL volumetric flask and complete with water to the mark to
obtain a final concentration of 1mg/mL. A further dilution step was made to
fall in the working range of each developed method. Then the recommended
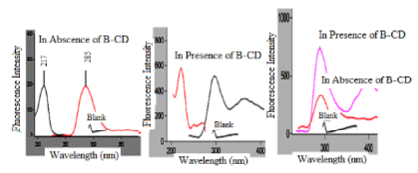
procedure mentioned under 2.4.1 was proceeded. The
native fluorescence of bimatoprost was measured at λem 285 nm after excitation
at λex 217 nm in water. Bimatoprost is characterized by having a native
fluorescence due to its fused aromatic rings and extended conjugated structure.
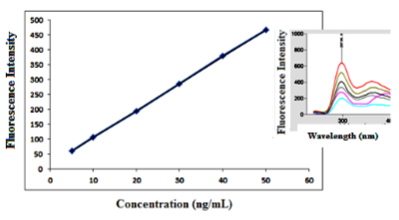
Emission and excitation spectra of bimatoprost were given in Figure 1. Fluorescence spectra of
bimatoprost in absence and presence of β-CD were investigated (Fig. 1). Maximum
emission wavelength of bimatoprost and bimatoprost/ β -CD complex was observed
at 285 nm. The results suggest that a stable complex was formed between β-CD
and bimatoprost. The quantum yield [QY] was calculated in absence and presence
of β-CD and it is found to be increased from 0.26 to 0.31. Quantum yield was
calculated according the equation [15]: The enhancement of native fluorescence intensity
in aqueous organized media is due to change in viscosity, polarity and binding capacity
[16,17]. QY
= Үs. Fu / Fs. As /Au, QY = Quantum yield, As = Absorbance of standard, Au =
Absorbance of unknown, Ys = Quantum yield of standard, FU = Integrated emission
of unknown, Fs = Integrated emission of standard. Different
experimental parameters affecting the native fluorescence intensity of the drug
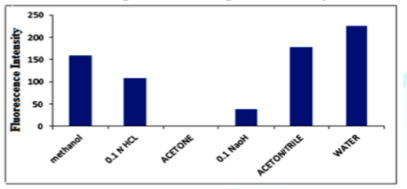
and its stability were carefully studied and optimized. Influence of
diluting solvents: The
effect of different diluting solvents on FI of bimatoprost was investigated
upon dilution with different solvents including methanol, 0.1 M HCl, acetone,
0.1 M NaOH, acetonitrile and distilled water. No fluorescence was observed with
acetone. Each of diluted aqueous acid, aqueous alkali, acetonitrile and
methanol decrease the intensity of fluorescence of bimatoprost compared to
water. Water gave the highest fluorescence intensities compared with the other
solvents as shown in Figure 2. Thus,
water was chosen as the diluting solvent throughout the study. Effect of
surfactants: The
effect of 1.0 (w/v) aqueous solution of several types of surfactants namely,
β-Cyclodextrin, tween 20, tween 40, and cetyltrimethyl ammonium
bromide was investigated. The relative fluorescence intensity was studied
by adding 1 mL of each surfactant solution to the drug solution in water. The
relative fluorescence intensity for each solution was measured within 30 min
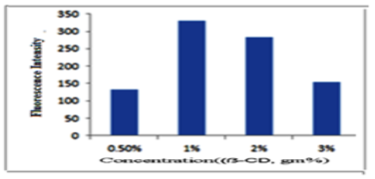
each against the appropriate blank as presented in Figure 3. Influence of
different concentrations of 1% (w/v) ẞ-CD: The fluorescence intensity of
bimatoprost in different concentrations of β-CD from 0.5 to 3.0 % (w/v) was
investigated. The results revealed that the highest intensity was observed at
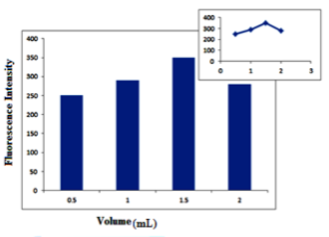
concentration of 1 % (w/v) β-CD. The results are shown in Figure 4. Influence of
different volumes of 1.0% (w/v) β-CD: The effect of different volumes of β-CD,
1% (w/v) from 0.5 – 3.0 mL was investigated. It was found that 1.5 mL is the
best volume, as it gave the highest FI as shown in Figure 5. Standard fluorescence
spectroscopy analyzes the variation of a spectroscopic property (quantum
yield, spectral shift, lifetime, or anisotropy) of a fluorescent guest or host
due to the complexation. A significant variation of any of these parameters
requires an intimate participation of the fluorophore in the complexation process.
The formation of a host-guest inclusion complex of bimatoprost with (β-CD) in
aqueous organized solution has been characterized by fluorimetry. The nature of
the host-guest inclusion complex between bimatoprost and β-CD has been
elucidated. The experimental results confirmed the existence of 1:1 inclusion
complex. The binding constants describing the extent of formation of the
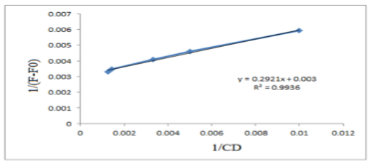
complex have been determined, using modified Benesi-Hildebrand plots [18,19].
The schematic presentation of the inclusion is presented in scheme 1. The
ratio of complex, and formation constant were calculated from the modified
Benesi-Hildebrand equation, 1/ (F-Fo) = 1/(Kk[P]o[CD]o) + 1/(Kq[P]o) Where
F, Fo represent the fluorescence intensity of bimatoprost in absence and
presence of ẞ-CD, respectively, K is the formation constant, and [p] is
constant. The reciprocal plots of 1/ (F-Fo) versus 1/[CD] showed good linearity
( Figure 6), indicating that the
inclusion complex has a stoichiometry of 1:1. The value of k was found to be
137.54 M-1. Figure 6: Incluion complex of
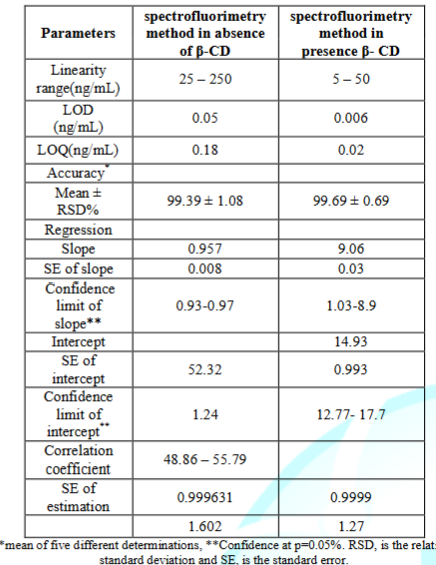
bimatoprost – β-CD (1:1) The
validity of the proposed method was assessed by studying the following
parameters: linearity, range, LOD, LOQ, accuracy, precision, robustness and
specificity, according to ICH guidelines (20) and USP (21), the results were
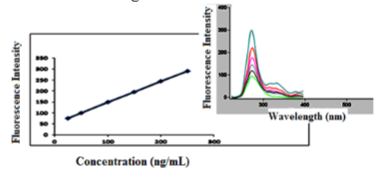
presented in Table 1. There
was linear relationship between bimatoprost concentration and the native
fluorescence obtained over the concentration range of (25.00-250.00 ng/mL),
(5.00-50.00 ng/mL) in absence and presence of 1.5 mL of 1% β - CD, respectively
as shown in Figure (7,8). The
results showed good linearity with regression parameters calculated according
to ICH guidelines as in Table 1. The
regression equations were computed and found to be as the following: FI
= 0.9562 C + 52.529 R2 = 0.9997 in absence of 1% β-CD FI
= 9.066 C + 14.94 R2 = 0.9999 in presence of 1% β-CD Where:
FI is the fluorescence intensity, C is the concentration in ng/mL. The
high values of correlation coefficient (R2) and low values of Standard
Deviation (SD), Standard Error (SE), and Relative Standard Deviation (RSD)
showed the assemblage of the points around the calibration graph and proved the
linearity of the method over the specified concentration range as shown in
Table 1. LOD
and LOQ were calculated according to the following equations as specified
by ICH guidelines and the results are summarized in Table 1. LOD = 3.3 σ / S LOQ = 10 σ / S Where
σ is the standard deviation of the response and S is the slope of linearity. To
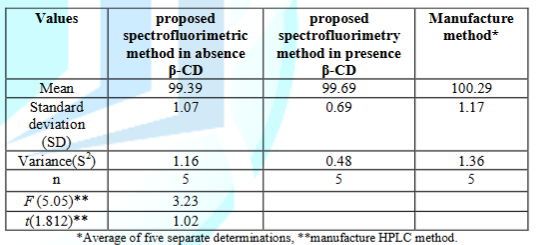
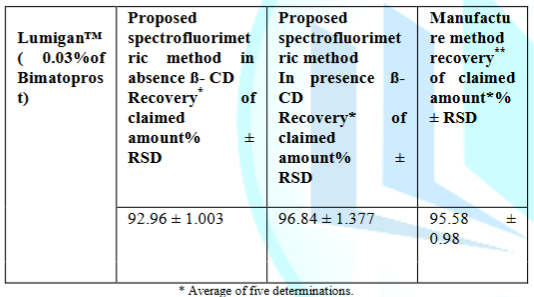
prove the accuracy of the proposed methods, the results of the assay of the
drug substance was assessed by the proposed spectrofluorimetric method and
compared with those obtained using manufacture HPLC methods [14]. Statistical
comparison of the results obtained by the proposed method and those obtained by
the manufacture method using mean recoveries, Student’s t-test and variance
ratio F-test revealed no significant difference between the two methods
regarding accuracy and precision as shown in Table 2, indicating high accuracy and precision of the proposed
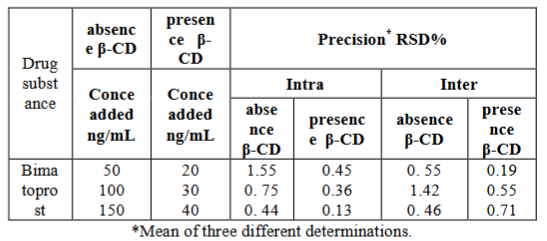
methods [20, 21]. The
intra- and inter-day precision were assessed by assaying freshly prepared
solutions in triplicate on the same day and on three different days,
respectively using the proposed methods. The low RSD of the repeatability
(intra-day) and intermediate precision (inter-day) of the results obtained by
means of the proposed methods indicate a high precision of these methods and
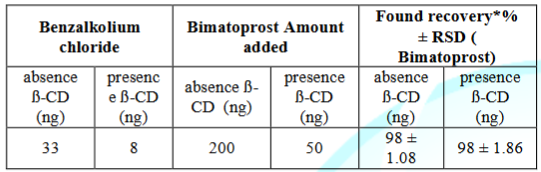
proved to be suitable for quality control of bimatoprost as shown in Table 3. The
specificity of the proposed spectrofluorimetric methods were proven by its
ability to determine bimatoprost in pharmaceutical reparation without
interference from Benzalkolium Chloride that commonly present in the matrix as
represent in Table 4. Solutions
of the drug were stable for one month when kept in the refrigerator. No change
in fluorescence intensity appeared throughout the whole validation procedures. The
proposed methods were successfully applied for the determination of bimatoprost
in its pharmaceutical dosage form, Lumigan™ (Bimatoprost ophthalmic solution
was labeled to contain 0.03%). The
proposed methods after sample preparation discussed before under section 2.4.1.was
successfully used to quantify bimatoprost in pharmaceutical dosage form as
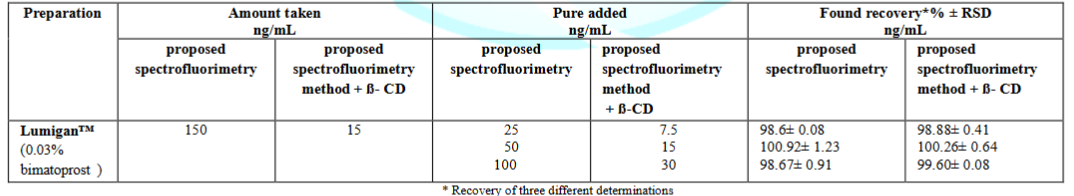
shown in Table 5. Standard
addition technique was used to assess the matrix effect of the solution
additives and its contribution in the deviation of the results obtained by the
proposed methods. The obtained results revealed no significant matrix effect as
shown in Table 6. In
the present work emission
spectra of bimatoprost in absence and presence of β-CD were investigated.
The fluorscence spectroscopy of the host – guest interaction between
bimatoprost and β-CD shows 1:1 inclusion complex, with an association constant
of 137.54 M-1. The quantum yield was 0.26 and 0.31 in absence and present of
β-CD. To the best of our knowledge, no report of fluorimetric methods
were studied before for determination of bimatoprost. The advantages of the
methods are cheapness, ecofriendly, rapid and specific and can be used for the
routine quality control of drug in drug substance and pharmaceutical eye drop
with no potential interferences from excipients. The results showed that the
quantity of drug substance in drug product was in a good agreement with given
labeled quantity. The proposed spectrofluorimetric method is characterized by
being, simple, available, and more sensitive and having shorter time of
analysis when compared to tedious chromatographic methods.
The suggested methods are greener than the reported ones with good validation parameters
and hence they can be used for routine analysis of the studied drug without
harming the environment. First,
great thanks for GOD who offers to me all responsibilities to get that work. Great
thanks for all my professors who they are contributing with
me in that paper. Great thanks for my faculty and NODCAR, and my lovely home
EYGPT. 1. Sean CS. Martindale: The Complete Drug Referenc. 36th (2014) Pharmaceutical Press, London-Chicago 2784. Maha A Elabd, Department of Pharmaceutical
Chemistry, National Organization for Drug Control and Research, 6 Abou-Hazem st,
Giza, Egypt, E-mail: mahaelabd@hotmail.com Walash MI, Toubar S, AbouEl-Alamin MM, Elabd MA and Salama NN. Spectrofluorimetric
study on inclusion interaction of β- cyclodextrin with bimatoprost: challenging
to green analytical applications (2018) Edelweiss Chem Sci J 1: 2-8 Spectrofluorimetric Study on Inclusion Interaction of Beta Cyclodextrin with Bimatoprost: Challenging to Green Analytical Applications
Abstract
Full-Text
Introduction
Experimental
Apparatus
Samples
Standard
solutions
Procedures
Construction of
the calibration graph
Results and
discussion
Spectral
characterization
Optimization of
reaction conditions

Determination of
complex-ratio and formation constant
Method
validation
Linearity and
range
Limit of
detection (LOD) and limit of quantification (LOQ)
Accuracy
Precision
(repeatability and intermediate precision)
Specificity
Stability of
reference and working solutions
Application
Conclusion
Acknowledgements
Reference
2. Chen M, Cheng C, Chen Y, Chou C and Hsu W. Effects of bimatoprost 0.03% on ocular hemodynamics in normal tension glaucoma (2006) J Ocul Pharmacol Ther 22: 188–193.
3. Laurence LB, John SL and Parker KL. Goodman & Gilman’s The Pharmacological Basis of therapeutics (2006) 11th McGraw Hill Professional.
4. Kruse P, Rieck P, Sherif Z and Liekfeld A. Cystoid macular edema in a pseudophakic patient after several glaucoma procedures. Is local therapy with bimatoprost the reason? (2006) Klinische Monatsblätter für Augenheilkunde 223: 534–537.
5. Steinhäuser S. Decreased high-density lipoprotein serum levels associated with topical bimatoprost therapy (2006) Optometry 77: 177–179.
6. Park J, Cho HK and Moon JI. Changes to upper eyelid orbital fat from use of topical bimatoprost, travoprost, and latanoprost (2011) Japanese Ophthalmol Soc 55: 22–27.
7. Jayaprakasam A and Ghazi-Nouri S. Periorbital fat atrophy - an unfamiliar side effect of prostaglandin analogues (2007) Orbit 29: 357–359.
8. Filippopoulos T, Paula JS, Torun N, Hatton MP, Pasquale LR, et al. Periorbital changes associated with topical bimatoprost (2008) Ophthalmol Plastic Reconstruct Surg 24: 302–307.
9. Murali KP, Rao BT, Bujagendra RM, Rao CN, Kishore KR, et al. Determination of a novel impurity by LC-MASS and chromatographic separation of bimatoprost, isomers and their impurities by UPLC (2011) J Pharm Res 4: 2381-2383.
10. Krishna M, Rao T, Raju B, Narasimha Rao, Kumar K. Development and Validation of RP-HPLC Method for Estimation of Bimatoprost in Pharmaceutical Dosage Forms (2011) J Pharmacy Research 4: 3733.
11. Suresh SK, Natraj K, Asadulla K, Kalyan BK and Venkateshwara JR. Development and Validation of RP-HPLC Method for Estimation of Bimatoprost in Pharmaceutical Dosage Forms (2009) J Pharmacy Research 4: 3733-3734.
12. Marchei E, Daniela De Orsi , Guarino C, Rotolo M C, and Pichini S. High Performance Liquid Chromatography Tandem Mass Spectrometry Measurement of Bimatoprost, Latanoprost and Travoprost in Eyelash Enhancing Cosmetic Serums (2016) Cosmetics 3: 1-8
13. Chen GZ, Huang XZ, Xu JG, Zheng ZZ and Wang ZB. The Methods of Fluorescence Analysis (1990) Science Press, Beijing, 2: 112.
14. Chemipharm Company Manufacture Method.
15. Skillman JB. Quantum yield variation across the three pathways of photosynthesis: not yet out of the dark (2008) J Exp Bot 59: 1661-1647.
16. Brouwer AM. Standards for photoluminescence quantum yield measurements in solution (IUPAC Technical Report) (2011) Pure Appl Chem 83: 2213–2228.
17. Sharma BK. Instrumental Methods of Chemical Analysis (2002) 21st Edition, Goel Publishing House, Meerut, 360-373.
18. Benesi H and Hildebrand JA. Spectrophotometric Investigation of the Interaction of Iodine with Aromatic Hydrocarbons (1949) J Am Chem Soc 71: 2703–2707.
19. Anslyn Eric. Modern Physical Organic chemistry (2006) University Science Books, United States 1095.
20. ICH Q2B Validation of analytical procedure: methodology, In IFPMA (ed) (1996) International Conferences on Harmonization, Geneva
21. United States Pharmacopeia USP 39 National Formulary 34 (39th Ed) Rockville, United States: United States Pharmacopeial Convention INC. 2018. *Corresponding author:
Citation: