Introduction
In recent years, tin oxide (SnO2)
has got lot of attention due to its numerous properties such as high
transparency degree in visible spectrum. SnO2 acts as an n-type semiconductor having a wide
band gap of 3.6-3.8eV at 330K. These include transport conducting electrodes, Flat displays,
super capacitors, rechargeable Li batteries, optical electronic devices, Microelectronic
devices
liquid crystal displays, solar cell electrodes, transistors, catalyst supports
for oxidation of organic compounds. The secret behind these numerous
application of Tin oxides due to its chemical and mechanical stability, A
number of methods is used to prepare the Tin Oxides include Thermal evaporation
of oxides, rapid oxidation of pure Tin, chemical vapor deposition CVD (Chemical
Vapor Deposition), spray pyrolysis, evaporating Tin grains in air. SnO2
is having the cassiterite structure [1-4].
At the center each Tin atom is
surrounded by six Oxygen atoms which are nearly placed at the corners of the
equilateral triangle. Thus the Structure is 6:3 co-ordination the lattice
parameter are a=4.7370A and c=3.1850A, the c/a ratio is
0.673, Hydrothermal
method.
To improve the properties of tin oxide such as structural, electrical and also
the optical properties of the synthesized SnO2, many researchers has
study the effect of the temperature, doping concentration, deposition rate,
substrates, oxygen partial pressure and the annealing temperatures were widely
executed. The annealing temperature processes can be used in the reduction of
the intrinsic stress, and to improve the lattice miss-alignment or mismatch and
to create longer mean paths for the mobile electrons due to thermal vibrations
in getting better electrical
conductivity
[3,5,6].
In
this work, The Sol-Gel method is used to synthesize the SnO2
nanoparticles. In order to study the characterization of materials for
structural, morphological and optical properties and composition, various
techniques such as XRD, FT-IR, UV-Vis, TEM, SEM, and PL were used. Once the
characterization was done, study regarding the antibacterial properties on two
bacteria’s E. coli (generally gram
negative) and Micrococcus lettuces
(Gram positive) of the Tin Oxide was studied.
Experimental
Tin (Ⅱ) Chloride or
Stannous Chloride (SnCl2.2H2O) (99%.CDH, M.W 225.64),
Ammonia (NH3) (99%, M.W 17.03), ethanol (25%, DI water, nutrient
Agar granulated (95%, Himedia), Agar Agar type 1 (95%, Himedia, M.W 336.34),
Analytical, M.W 46.07), Acetone (M.W 58.08), Pure culture bacteria (100%,
Himedia).
Synthesis of Tin
Oxide nanoparticles By Sol-gel Method
Take 11.2815 gm of pure Stannous
Chloride (0.5M) put in a beaker containing 100 ml distilled water. Stirrer it
well for 10 minutes on the magnetic stirrer and keep the temperature 850C.
Then mix 5 ML of ammonia to the beaker and stir the solution for 10 minutes.
Leave the solution as such for salting and cover the beaker with the aluminum
foil so that no impurity will add in the solution. After 3 hours remove the
extra water, then again put the distilled water and again keep the solution for
salting. Repeat the same procedure for 4-5 times. Wash the solution with
ethanol by 2 times, after that filter the solution. Then put the filtrate in
the cru-sever china dish or glass plate. Then take the different solution to
keep at 200, 300, 400, and 5000C for 2 hours with the help of a
Muffle Furnace (MSW-101).
Preparation of
Nutrient Agar Solution
First of all pour 150ml of Distilled
water in a cylindrical flask. Add 4.2gm of nutrient agar solution into it then
stir it gently if the solution is dissolved then use the cotton to pluck the
flask otherwise add 3gm of Agar-Agar solution then again stir the solution then
pluck the solution tightly. By placing the cylindrical flask in an autoclave
for 1 hour under the parameters of 1210C temperature and 15 atm
pressure. After 1 hour release the pressure slowly to 0. Before getting
solidifies the solution we have to pour the nutrient solution into different
Petri plates (All task in done in the laminar). Keep the Petri dishes as such
for at least 15 minutes under the UV light of the laminar. Hence our nutrient agar solution has been
prepared.
Preparation of E Coli and Micrococcus Lutes
We have taken the ampoules present in
powder form (nutrient broth). Here 0.78 grams dissolved in 60ml water were put
in test tube. Test tubes were placed in autoclave for one hour followed by
inoculation (addition of pure culture). Then pure culture was put in a test
tube along with a control test tube. The test tubes were placed in an incubator
for 24 hours at 37ºC. After 24 hours growth of strains was checked with control
test tube.
Results and Discussions
Structural properties by XRD
By
using the powder X-ray diffraction measurements (PAN analytical) using the Cu
Kα having wavelength λ= 1.5405980A
as the incident radiation X-rays source to study the structural properties of
SnO2 Nano-particles operated at 30
kV and at 40 mA voltage and current respectively over the range 20º to 80º
degrees. The graph is plotted between angle 2θ in degrees along X-axis and the
intensity along Y-axis in the range 20º-80º and 0-4500 a.u respectively.
Using
the Scherer formula for the SnO2 Nano-powders we can calculate
the d (hkl) the average crystalline size of the planes present in the SnO2
Nano-powders.
D
(hkl) = Kλ/βcosθ
Where,
K represents the shape factor which is usually taken as 0.9, λ is the
wavelength of the X-rays used as the incident source, θ is the Braggs angle and
β is known as the (FWHM) full width half maximum. The analysis of the SnO2
Nano-particles is being done by the powder X-ray Diffractometry is used to
identify the crystal structure, identify the phase and calculate the average size
of the grain sample. The SnO2 was synthesize by Sol-gel method and
the XRD pattern of the SnO2 as synthesized
and at 500oC were recorded
in Figure 1.
From
the XRD pattern it was found that the following crystals planes are present in
the SnO2 (110), (101), (200), (211), (220), (002), (310), (112), (301), (202)
and (321) were indicating that the SnO2 is polycrystalline in nature and having
rutile tetragonal
structure
[JCPDS Card No; 41-1445] [7,13].
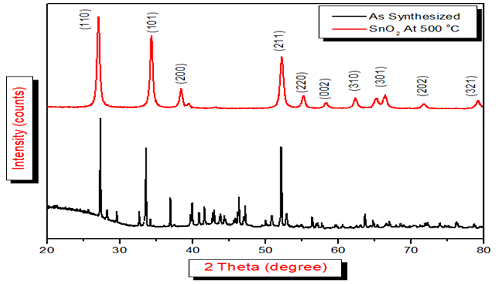
Figure 1: XRD plot of SnO2as Synthesized and at 500oC.
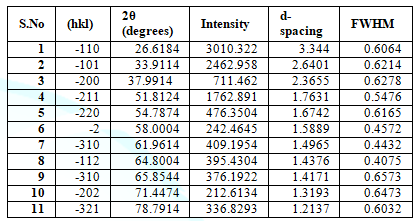
Table 1: Showing different peaks having different intensities andhaving different d-spacing values and showing FWHM values.
√ + 𝒌2 + 𝒍2
Where, α is the
lattice constant, d is the inteBy using the following formula, we can estimate the average value of the lattice constant for the different planes (hkl) present in the sample.
a = 𝒅/r-planer spacing and (hkl) are known as miller
indices. The average calculated value for the lattice constant a=b=4.7306oA
and c=3.69oA.
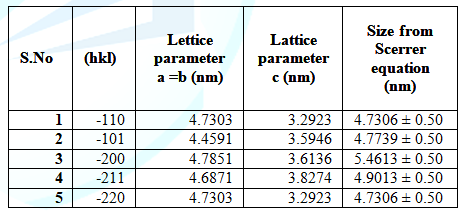
Table 2: Comparison ofparticle size, lattice parameters and the particle size from Scherer equationof different (hkl) planes.
Optical properties by UV-vis
Spectroscopy
To study about
the absorption of SnO2 in UV-Vis spectrum we use the UV spectrometer and also study
about the peak absorbance as well as the band gap of SnO2
nanoparticles. And also study about the variation of energy band gap with
increasing temperature. And discuss about the quantum confinement or quantum effect which has been
shown by the SnO2 [8,9,10,21].
In
optical absorption, the Nano sized semiconductor exhibit generally threshold
energy. This is due to the band gap structures. The decreasing size is due to
the absorption of the blue shift (when the size of the SnO2
nanoparticles approaches to the Bohr radius also called the quantum confinement
is reflected at the edges of the structures. The above graph gives the information
of the absorption by the Tin Oxide in the visible and ultra violet range. There
is variation in the absorption with respect to the incident wavelength [21].
There
is enhancement (increase) in absorption as the
temperature increases with respect to the synthesized Tin Oxide. Therefore it
shows the blue shift due to absorption in the UV-Vis region at the 259.20 nm.
The peak value of absorption remains same for Tin oxide even after annealing at
different temperatures Figure 2
[7,11,12].
The
energy band gap is calculated by the following relation
Eg =
h*c/λ
Where,
Eg is optical energy band gap, h is Planks constant, c is the speed of light, λ
is the cut- off frequency [14,16].
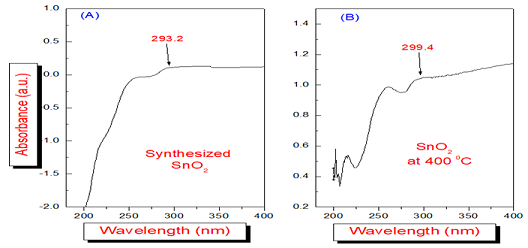
Figure 2: shows thecut-off frequency for Synthesized SnO2 [Figure 2A and Figure 2B] andthe cut-off frequency for SnO2 at 4000C [15].
Estimation of
Band Gap of SnO2
There are two ways by which the
electron is excited from valence band to conduction band is direct and indirect
transitions by absorption of photon. According to the Tauc
relation,
αhυ = B(hυ–Eg)m
Where, B is a constant, Eg is the
energy band
gap, hυ is incident photon energy, m
depends upon the values of electronic transitions having values 1/2, 3/2, 2 and
3. By plotting the graph between (αhυ)n vs. hυ by using n=1/m that is n=2 for
direct transition, and n=1/2 for indirect, n=1/3,2/3 is for forbidden direct
and forbidden indirect respectively [10].
In
this case, the value of m=1/2.The absorption coefficient ‘α’ in the direct
allowed transition may be written in the form of
α =
(hυ - Eg)1/2
The
parameters ‘hυ’ represents the photon energy and eg is the Energy band gap. The
band gap of SnO2 was calculated by plotting between (αhυ)1/2 vs. hυ
along Y-axis and X-axis respectively. The optical band gap is found. By
annealing at different temperatures, it is found that the band gap of SnO2
is decreased due to the removal of Oxygen vacancies, where temperatures is for
localizing the Oxygen atoms at the respective interstitials. The variation of
the band gap with temperature is reported in the Table 3 below [9,10,17].
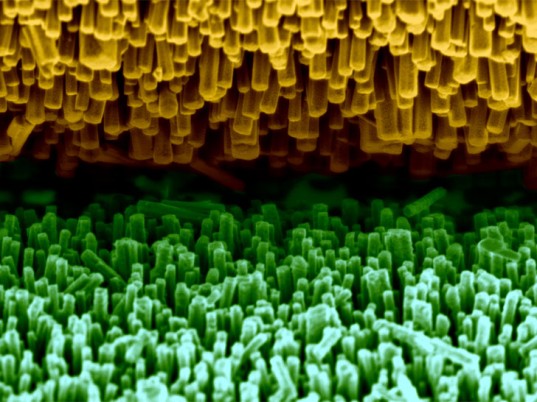
Morphological
Properties by SEM
Figure
5
these are the SEM images of the synthesized tin oxide or SnO2 which
has been done by the SEM (JSM-6510, SAI Labs, TIET Patiala) where it is being
clearly seen the clustering of particles on the surface shows the morphology
and are having fine structure, which matched with the standard structure of the
SnO2. The images are taken at three different magnification are at
0.5, 1 and 5 micrometer of the synthesized SnO2 [18].
Elementary
composition by EDX
The existence of tin particles in the tin oxide synthesized
sample is been fin out by the EDS technique. The scale is from 0-14 KeV. SnO2
which has been done by the SEM (JSM-6510, SAI Labs, TIET Patiala).
Bonding by FTIR
In order to
understand the interaction of bonds in SnO2 at various wavelengths,
behavior of material at different annealing temperatures has been taken into
consideration. In this regard, FTIR was used. This is confirmed by the peak at
3404.4 is due to the stretching of OH bond lying in the range 3200 and 3600 nm.
In addition,
at 924.7 nm there is a bending due to Sn-OH in the range 800 to 1250 nm. And
the peak at 2359.8 (C-N) is due to the carbon and nitrogen from the ammonia.
The peak due to the stretching of C-O bond is at 1253.5nm [19,20].
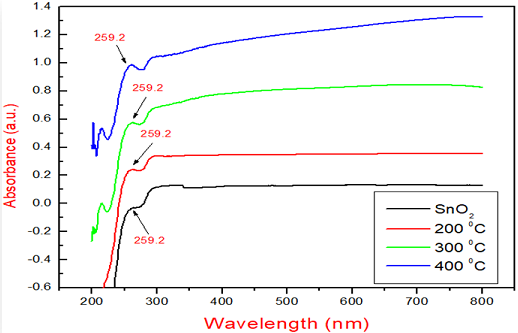
Figure 3: UV-Vis SpectraShowing the Peak values of Tin Oxide as synthesized and at various Temperaturesas 200, 300, 400oC.
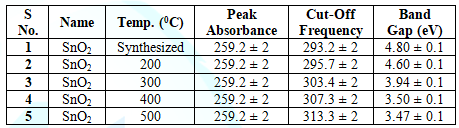
Table 3: Showing Variation of Band Gap in SnO2as synthesized and at different Temperatures i.e. 200 300 400 and 500oC.
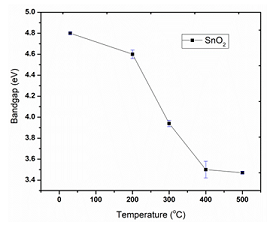
Figure 4: Variation of band gap with respect to Temperature.
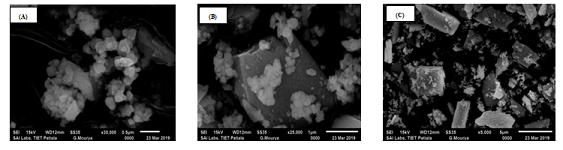
Figure 5: SEM Images of SnO2 at different magnifications
The
Figure 7 shows the FTIR of the Tin
Oxide as synthesized and concealed at 400 and 500oC. It has been
confirmed that after calcinations at 400 and 500oC. There is the
broadening in the peaks which are found at 470.5 and 425.1 nm in the sample as
synthesized after calcinations. Also the O-H peaks at 3404.4 and 924.7 are being
removed due to the high temperature [20].
Photoluminescence
Photoluminescence
is light emitted when photo-excited carriers decay from higher energy level to
lower energy level. The energy of transition depends on the relative spacing of
the excited and lower energy states. These states may be due to localized
impurity or defect levels, continuum levels in the of electrons in conduction
or valance bands, excitation
states or electron-hole pairs bound by coulomb attraction, excitation states
bound to impurities or defects [21,23,24].
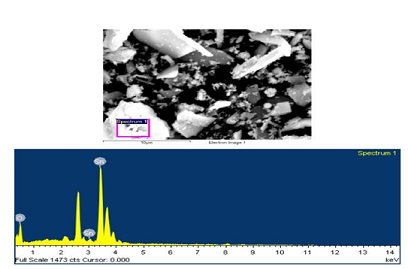
Figure 6: EDS image andplot for synthesized SnO2 showing
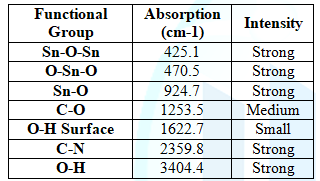
Table 4: List of functional groups at different Wavelengths
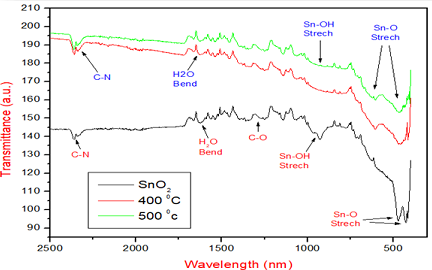
Figure 7: FTIR ofSynthesized SnO2 and at different Temperatures 400 and 500oC.
The
PL spectroscopy is often used to get the information of radiative
transitions
among the electronic states, impurity and defects, composition of elements,
energy states present in the samples. The PL emission strongly depends on
structural morphological, surface area distribution and defect states. The
three main emission peaks and the excitation of spectrum on tin oxide show a
strong band at 375nm, 425nm and 480nm. The two main emission peaks at 375nm and
425nm (Figure 8) were found and till
now the mechanism of observing till not yet discovered. It may be due to the
defect energy levels present in the band gap of the tin oxide. We know that in
oxides the Oxygen vacancies are most common defects and they act as the
radiative centers in the process of luminescence [25-27,29].
In
this work the synthesized tin oxide is annealed at different temperatures and
all the samples were excited at 325nm as the lumincent centre. These two main
peaks attributed by the electron transitions produced by defect levels present
in the energy bend gap. With the increase in the temperature the bond length is
reduced due to the reduction of the oxygen vacancies, hence the intensity of
the emission is also reduced and the peal is shifted towards the red shift
[27].
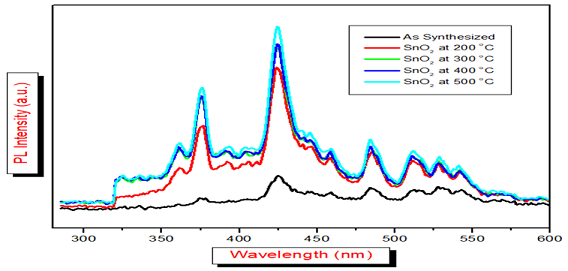
Figure 8: Pl spectrabetween wavelength and Intensity of SnO2 as synthesized and SnO2at 200, 300 400 and 500oC.
Antibacterial Activity
From the ZONE OF INHIBITION one
could see the killing efficiency of tin
oxide particles is more effective on G. positive (Micrococcus Luteus) then G. negative E. coli. Hence, the tin oxide NPs
exhibits the excellent antibacterial action against both the bacteria’s used.
We have seen the effect on the bacteria at different concentrations for both
the bacteria Figure 9. The
difference in the efficiency of tin oxide to kill or stop the growth of both
the bacteria’s are due to difference in the cell structure of G. positive and
G. negative bacteria or chemical composition of cell of a bacteria or the
chemical composition of tin oxide [28].
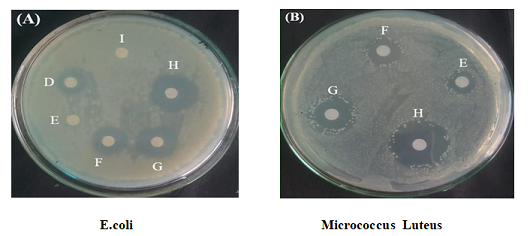
Figure 9:Showing the Effect of the SnO2 On two different bacteria’s and theirzone of inhibition in the above boxes (A) and (B) E.coli and Micrococcus Luteusrespect
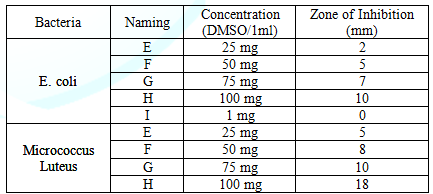
Table 5:Showing the zone of inhibition of SnO2 on E. coli and Micrococcus Luteus on dif
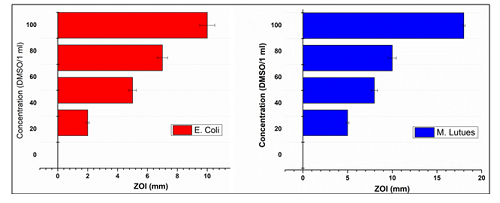
Figure 10:Comparison of antibacterial efficiency of SnO2 nanoparticles
From the above results it is been
clearly seen that the ZONE OF INHIBITION is directly depends upon the
concentration used of the tin oxide. As we increase the concentration of tin
oxide from 25-100 mg/1ml of DMSO the ZOI of both the bacteria used is increased
Table (5). From the above achieved
results, it is clear that SnO2 particles shows very good
antibacterial activity against Micrococcus
Luteus and comparatively less antibacterial activity against E. coli (Figure 10).
The difference in the behavior of
tin oxide NPs towards E Coli and Micrococcus Luteus could be attributed
to the fact that: the permeable nature of cell membrane of Micrococcus Luteus allows SnO2 nanoparticles to
penetrate and coagulate the cytoplasm of the bacteria and hence cease its
activity. However, in case of E Coli,
the presence of outer most Lipid layer which is impermeable in nature may not
allow the nanoparticles to interact and hence interrupt its course of action.
However, in comparison to above study, Khatoon, et al, [23] Reported that AgNPs
show stronger inhibition towards gram negative bacteria than against gram
positive because AgNPs may adhere on the surface of the bacteria to interact
with the sulfur and phosphoric moieties of cell wall resulting in the
deactivated metabolism of cell.
Conclusion
The tin oxide (SnO2)
NPs was effectively synthesized by using the Sol-gel
method. The synthesized tin oxide was
characterized by number of characterization which includes UV-Vis, FTIR, XRD,
SEM and EDAX. It was shown that the band gap of the synthesized tin oxide was
4.80 eV, which decreases from 4.80 to 3.47 eV by increasing the temperature
(200, 300, 400, and 500℃ respectively. The structural properties was studied by
using XRD technique and the structure of tin oxide NPs were found as tetragonal
which exactly matches with the results from JCPDS data (Card No. 88-0287). The
lattice parameters were found to be equal to a=b=4.7306, c= 3.69. The average
crystallite size was found in the range of 9 nm by using scherrer formula. The
bonding of the various elements of tin oxide is confirmed from the FTIR
technique. By using the SEM technique at different magnifications the structure
of the tin oxide NPs were tetragonal. EDAX technique shows the elemental
composition of tin and oxygen present in the synthesized tin oxide. At last in
my paper, antibacterial activity of tin oxide which was tested on two bacteria’s
namely E.coli (Gram negative) and Micrococcus Luteus (Gram Positive) by
zone of inhibition method. From the result the tin oxide NPs has the ability to
be used as an antibacterial agent.
Acknowledgements
Asif Ahmad Bhat highly
acknowledges the Institute (Lovely Professional University Phagwara) for
research facility, and department of chemistry, Govt Model Degree College
Shopian for their support and discussions throughout their work. M. A. Kaloo
gratefully acknowledges Department of Science and Technology, New Delhi for
INSPIRE-FACULTY research grants [DST/INSPIRE/04/2016/000098].
References
- Patil GE, Kajale DD, Gaikwad VB and Jain GH. Preparation and characterization of sno2 nanoparticles by hydrothermal route (2012) Int Nano Lett 2: 17. https://doi.org/10.1186/2228-5326-2-17
- Zhang J and Gao L. Synthesis and characterization of nanocrystalline tin oxide by sol-gel method (2004) J Solid State Chem 177: 1425-1430. https://doi.org/10.1016/j.jssc.2003.11
- Zhu H, Yang D, Yu G, Zhang H and Yao K. A simple hydrothermal route for synthesizing SnO2 quantum dots (2006) Nanotechnology 17: 2386-2389. https://doi.org/10.1088/0957-4484/17/9/052
- Kumar V, Singh K, Sharma J, Kumar A, Vij A et al. Zn-doped sno2 nanostructures: structural, morphological and spectroscopic properties (2017) J Mater Sci Mater Electron 28: 18849-18856.https://doi.org/10.1007/s10854-017-7836-z
- Marton JP Jarzebski ZM. Physical Properties of SnO Materials (1976) J Electrochem Soc Rev 123: 199-205.
- Baco S, Chik A, Yassin F and F Md Yassin. Study on optical properties of tin oxide thin film at different annealing temperature (2012) J Sci Technol 4: 61-72.
- Adnan R, Razana NA, Rahman IA and Farrukh MA. Synthesis and characterization of high surface area tin oxide nanoparticles via the sol gel method hydrogenation styrene (2010) JCCS 57: 222-229. https://doi.org/10.1002/jccs.201000034
- Kim H and Gilmore CM. Electrical, optical, and structural properties of indium-tin-oxide thin films for organic light-emitting devices (1999) J Appl Phys 86: 6451-6461.https://doi.org/10.1063/1.371708
- Sanon G and Rup R. Structure Oxide (1991) phy rev 44: 5672–5680.
- Wang J, Lu C, Liu X, Wang Y and Zhu Z, et al. Synthesis of tin oxide (SnO & SnO2) micro/nanostructures with novel distribution characteristic and superior photocatalytic performance (2017) Mat Des 115: 103-111.https://doi.org/10.1016/j.matdes.2016.11.043
- Razeghizadeh AR, Rafee V, and Zalaghi L. Effects of changes sol concentration on the structural and optical properties of SnO2 nanoparticle by the sol-gel technique (2015) Arxiv 37: 14.
- Ratchagar V and Jagannathan K. Synthesis and characterization of sno2 nano particles for carbon absorbing applications (2016) Orient J Chem 32: 207-212. http://dx.doi.org/10.13005/ojc/320121
- Sagadevan S and Podder J. Investigation on structural, surface morphological and dielectric properties of zn-doped sno2 nanoparticles (2016) Mat Res 19: 420-425.https://doi.org/10.1590/1980-5373-mr-2015-0657
- Scipioni R, Gazzoli D, Teocoli F, Palumbo O, Paolone A et al. Preparation and characterization of nanocomposite polymer membranes containing functionalized sno2 additives (2014) Membranes 4:123–142. https://doi.org/10.3390/membranes4010123
- Nehru LC, Swaminathan V and Sanjeeviraja C. Photoluminescence studies on nanocrystalline tin oxide powder for optoelectronic devices (2012) Am J Mat Sci 2: 6-10.https://doi.org/10.5923/j.materials.20120202.02
- Dharma J and Pisal A. Simple method of measuring the band gap energy value of tio2 in the powder form using a uv / vis / nir spectrometer (2009) Appl. Note, 4-7.
- Li Y, Yin W, Deng R, Chen R, Chen J et al. Realizing a Sno2-based ultraviolet light-emitting diode via breaking the dipole-forbidden rule (2012) NPG Asia Mater 4: 30. https://doi.org/10.1038/am.2012.56
- Li R, Liu L, Ming B, Ji Y and Wang R. Oxygen vacancy effect on photoluminescence of knb3 o8 nanosheets (2018) Appl Surf Sci 439: 983-990. https://doi.org/10.1016/j.apsusc.2018.03.117
- Khalameida S, Samsonenko M, Skubiszewska-Zięba J and Zakutevskyy O. Dyes catalytic degradation using modified tin(iv) oxide and hydroxide powders (2017) Adsorpt Sci Tech 35: 853-865.https://doi.org/10.1177/0263617417722251
- Singh A, Ahmed B, Singh A, and Ojha AK. Photo degradation of phenanthrene catalyzed by rgo sheets and disk like structures synthesized using sugar cane juice as a reducing agent (2018) Spectrochim Acta-Part A Mol Biomol Spectrosc 204: 603-610. https://doi.org/10.1016/j.saa.2018.06.086
- Simovic AM, Stojkovic AK, Dejan JM and Savic D. Is it possible to predict mortality in preterm neonates, based on a single troponin i value at 24 h? (2016) Ind J Pediatr 83: 466-467. https://doi.org/10.1007/s12098-015-1887-z
- Rehman S, Asiri SM, Khan FA, Jermy BR, Khan H et al. Biocompatible tin oxide nanoparticles: synthesis, antibacterial, anticandidal and cytotoxic activities (2019) Chem Select 4: 4013-4017. https://doi.org/10.1002/slct.201803550
- Khatoon. Antibacterial and antifungal activities of silver nanosperes synthesized by tri-sodium citrate assistedchemical approach (2017) J of environmental chem eng 148: 259-26.
Corresponding author
Masood Ayoub Kaloo, Department of Chemistry,
Govt. Model Degree College Shopian-192303, Jammu and Kashmir, India, E-mail: kaloomasood@gmail.com
Citation
Thoker BA, Bhat AA, Wani AK, Kaloo MA and Shergojri GA. Preparation and characterization of SnO2 nanoparticles for
antibacterial properties (2020) Nanomaterial Chem Technol 2: 1-5.