Introduction
Hippophae
rhamnoides L commonly called Sea Buckthorn (SBT) is a valuable and unique
natural sources gained attention worldwide not only for its medicinal
properties but also for its nutritional properties. It is a multi-medicinal
tree shrub of the genus Hippocea belongs to the family Elaeagnaceae. Hippophae
rhamnoides L. is mostly found in the moderate geographic locations of the north
hemisphere, categorized into six species and 12 subspecies in the plant
taxonomy [1]. It is a deciduous and nitrogen-fixing plant of cold arid region,
native to Asia and Europe. All parts of SBT are considered as a rich source of
numerous bioactive constituents with excessive nutritional and medicinal
properties [2-4]. Due to these
properties, H. rhamnoides L. is domesticated around the globe [5,6]. It is a
very important medicinal remedy which is considered to be a rich source of a
large number of phytochemicals, nutrients and bio-active constituents [7,8].
The bio-active compounds include vitamins, carotenoids, phytosterols, poly
unsaturated fatty acids, organic acids, mineral components and essential amino
acids [7-10]. SBT has been used in Europe and Asia for pharmaceuticals, foods
and therapeutic purpose for centuries. SBT leaves, berries and seeds are well
known for their medicinal properties [11-14]. The known medicinal properties of
SBT include immune-modulatory, anti-stress, radio protective, antioxidant,
tissue regeneration, anti-atherogenic, hepato-protective property and improving
functions of blood circulation and digestive system [4,15-26]. It is
interesting to note that the aqueous extract of SBT has recently been reported
to possess hypoglycemic activity [27]. SBT contains a lot of different
bioactive constituents with multiple properties which have ability to prevent postprandial
hyperglycemia [28]. Flavonoids from fruits and seeds of SBT can cause hypolipidemia
and hypoglycemia [29]. The leaves of methanolic extracts of SBT contain
compounds showing alpha-glucosidase inhibition activity which may be used in
diabetes because it has the ability to control inhibition activity [30].
Methodology
General
instrumentation
UV
spectra were obtained using a Hitachi-U-3200 spectrophotometer. IR spectra were
recorded on a Jasco A-302 spectrophotometer. 1D- and 2D NMR
spectra were obtained on AM-500, Bruker spectrometers in CD3OD and
CDCl3, using tetramethylsilane (SiMe4) as internal standard. Mass
spectra (EI-MS and HR-EIMS) were analyzed on a Mass AB SCIEX spectrometer QSTAR
xl. Column chromatography was carried out by using silica gel 60 (Merck, 70–230
mesh).TLC was carried out on silica gel 60 PF254 (Merck), with detection by UV
at 254 nm and 366 nm.
Plant material
The
Sea buckthorn berries (8.5kg)
were collected randomly in August-September from Gilgit, north of Pakistan in
September 2015. The plant was identified by a botanist from Department of
Botany, University of Karachi. A voucher specimen (No.G.H.No. 84346) was been
deposited in the Herbarium, Department of Botany, University of Karachi.
Extraction and
isolation
The
berries were dried at room temperature and soaked in methanol for 72h (3times).
The extract solution was filtered and concentrated under vacuum. The extract
was suspended in water (0.5L) and partitioned with ethyl acetate to give the
ethyl acetate-soluble part (111.0g). The ethyl acetate fraction was then
fractionated with 4% Na2CO3 and 30% HCl to obtain acidic
and basic fractions. The basic fraction was dried over Na2SO4
washed with water and evaporated the solvents under reduced pressure and
obtained a neutral fraction. Both the acidic and neutral fractions were
partioned with hexane to get hexane insoluble and soluble fractions.
The
ethyl acetate
acidic hexane
insoluble part (10g) was subjected to a silica gel column chromatography, using
a gradient solvent system of Pet. ether EtOAc CH2Cl2 MeOH
with increasing polarity to give 20 fractions which were combined on the basis
of TLC and obtained eight sub-fractions (HRF 1-8). The fraction 2 (1.02g) was
fractionated into four sub-fractions through normal phase CC. Compound 1 was purified from the fraction HRF-2D
using hexaneethyl acetate (55 vv) as solvent system. Fraction 4 (1.48g) was
further subjected to column chromatography using Pet. etherEtOAc as solvent
system (8.51.5vv) and obtained compound 2.Compound
3 was purified from fraction 4 using
CH2Cl2 MeOH (91 vv) as solvent system through normal
phase CC (Figure 1).
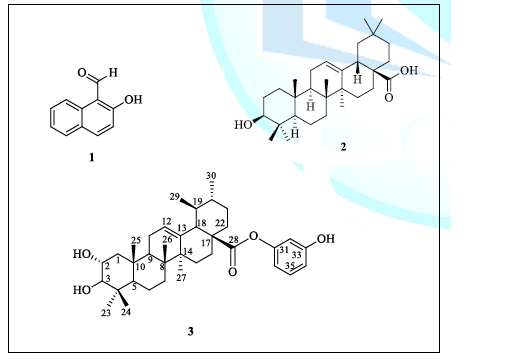
Figure
1: Structure
of compounds 1, 2 and 3.
Sulforhodamine B
assay
The
growth inhibitory activities of compounds 1,
2, and 3 were evaluated against human non-small cell
lung (NCI-H460) and breast (MCF-7) cancer cell lines by using sulforhodamine-B
assay for the determination of IC50 values. The concentration of the
test agents that inhibits 50% of the cell growth was referred as IC50.
For this, the cells (10000cells100µL) from respective cell lines were incubated
in 96 well plates for 24h at 37ºC in 5% humidified CO2 incubator. The stock
solutions of compounds
1, 2, and 3 (20 mM) in
DMSO, and doxorubicin (1mM) in distilled water were prepared. A range of
dilutions for 1 (1, 10, 25, 50
and100µM), 2 and 3 (1, 2.5, 5, 7.5 and 10 µM) were added
(100µL) in respective wells. The pre-determined IC50 value of doxorubicin (5µM)
was used as positive control (data for range of dilutions are not shown). After
completion of 48h, ice cold TCA (50µL, 50%) was added and left at room
temperature for 30min. The TCA was washed out with distilled water. After
drying, SRB solution (100µL, 0.4% wtvol in 1% acetic acid) was added to each
well and unbound stain was washed out after 30min with1% acetic acid. Tris-base
(100 µL, 10 mM, pH 10.2) was added to each well to solubilize protein bound
stain. The absorbance for test agents along with appropriate blanks (both test
agent and control) was recorded at 545nm using a microplate reader (Synergy).
This absorbance was used to calculate respective percent growth inhibitions of
the test agents. The dose response curve graph was plotted between growth
inhibitions (y-axis) vs concentrations of the respective test agents (x-axis)
to determine IC50 value.
DNA docking
studies
To perform the DOCK calculations that predict the
best orientations of the ligand in the binding site of the receptor we require
preparing the receptor and ligand as inputs. UCSF Chimera is a visualizing tool
used here to prepare the receptor and ligand with its Dock Prep tool option
[31]. The
structure of DNA PDB ID 1d29 was selected as receptor and
downloaded from Protein Data Bank (PDB) [32]. The three compounds are taken as
ligands to check if they are making any interactions with the DNA moiety. Hydrogen
atoms
and partial charges were added to both ligand and receptor. AM1-BCC charges
were added to receptor, gasteiger charges were added to ligand and files were
saved in mol2 format as program DOCK read file in Mol2 format. Molecular
surface of receptor was prepared by DMS program. The DOCK
accessory program sphgen was used to generate the spheres with a probe radius
of 1.4 angstrom. It generated 12 clusters and the cluster 1 with maximum number
of spheres i.e. 38 was selected for construction of box with the help of show
box DOCK accessory program. The maximum 38 spheres in cluster 1 were retained
for docking (Figure 2).
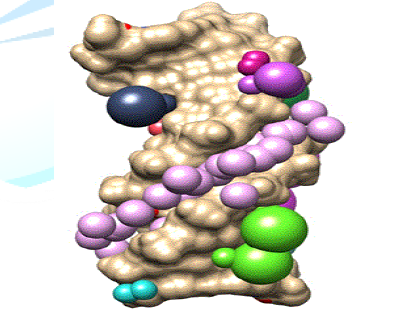
Figure
2: Surface
diagram of DNA (PDB ID: 1d29) representing the cluster 1 with maximum numbers
of violet colored spheres.
Following
the construction of box, the DOCK accessory program grid was used to
pre-compute the energy interaction points with grid spacing of 0.3 angstrom
resolution within the box [33]. The number of grid points on x, y, and z axis
was 109, 85, and 108 Å, respectively with box dimension 32.375, 25.076, 32.008Å
and center on 12.814, 23.837, and 4.833 Å (Figure
3). Once the grid box was set we performed the docking by treating the
ligand as flexible. All the parameters were set as default value given in
standard protocols file. The maximum number of orientation was set as 1000 and
maximum number of conformations was kept 10 for each compound.
Electrophoretic mobility of plasmid pBR322 DNA
Electrophoretic
mobility of pBR322
plasmid DNA was performed to assess the direct interaction of compounds with
DNA. Briefly, agarose gel (1%) was prepared in 1x TAE buffer (70mL) by heating
for 1min followed by its casting in gel tray at room conditions. pBR322 DNA (500ng, 5µLwell) was mixed
either with PBS (control) or with compounds 1, 2, 3 (2.5µM), and doxorubicin (250 nM) and placed at 37ºC for
30min. Loading buffer (3µL, bromophenol blue, xylene cyanol and glycerol in a
ratio of 11120) was applied to the above reaction mixture. This sample was
loaded in the wells of the agarose gel and electrophoresis was performed in TAE
buffer at 70 V for 1.5h. The gel was dipped in ethidium bromide solution
(5μgµL) for 20min and washed with tap water. The mobility pattern
of the circular DNA was observed under UV light and
photographed.
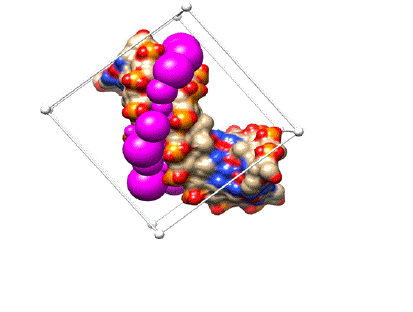
Figure
3: Grid box
setting.
Statistical analysis
Duncan’s multiple range test using SPSS 17 program. The data was analyzed
by using one-way
ANOVA with p<0.05 level was considered as significant
followed by.
Results and Discussion
Compound 1
was purified as white powder having the molecular formula C11H8O2
([M+] mz 172.05). The IR spectrum showed absorption peaks at 3486cm-1.The
1H-NMR shows four doublets of the aromatic proton at δ 8.32 (d, J = 8.5 Hz,
1H), δ 7.96 (d, J = 7.9 Hz, 1H), δ 7.78 (d, J = 8.5 Hz, 1H), δ 7.59 (m, 1H), δ
7.41 (m, 1H) and δ 7.12 (d, J = 9 Hz, 1H). Two singlets at δ 10.792 and 13.14
were appeared for aldehyde proton and hydroxyl proton resp.Compound 2 was isolated as white amorphous
powder. The molecular ion [M+] peak was appeared at mz 456.4 in
EI-MS spectrum matching to C30H48O3. Other
characteristic peaks were appeared at mz 248, 203 and 133. In ultra-violet
spectrum, an absorption band was appeared at 213 nm. The infra-red spectrum of
compound 2 shows absorption peak in the area of 2940.9cm-1 for
symmetric vibrations of CH2cm-1 group and at 1696.1cm-1
appears a characteristic band of carbonyl group (C=O). A broad peak was also
appeared in the area of 3446.7 cm-1 for hydroxyl group. The 1H-NMR
spectrum of compound 2 revealed
seven singlets of tertiary methyl protons at δ 0.66, 0.67, 0.79, 0.79, 0.81,
0.86 and 1.03. A doublet of doublet of C-18 proton at δ 2.71 and a triplet of
one vinyl proton of C-12 at δ 3.09 indicates an olea-12-ene skeleton. One broad
singlet peak at δ 4.8 showed the signal of O-H group. The above mentioned
spectral data of compound 2 were in complete agreement with those reported in
literature for oleanolic acid [34].
Compound 3 was obtained as white
amorphous solid and revealed to have the molecular formula C36H52O5
([M]+ at mz 564.3814, calculated 564.3815) by HREI-MS. The fragment
ion peaks at mz 472.3 [M-C6H5O]+ showed the
loss of phenol moiety. Two fragment ion peaks at mz 454.4 [M-H2O]+
and at mz 437.3 [M-2H2O]+ indicate that compound 3 contained two hydroxyl groups.The UV
spectrum showed absorption band at 230 and 298 nm. In infra-red spectrum, a
very intensive absorption peak in the area of 2932 cm-1 for
symmetric vibrations of CH2 group and at 1699 cm-1
appears a characteristic band of carbonyl group (C=O). A broad peak was also
appeared in the area of 3289 cm-1 for hydroxyl group. The 1H
NMR spectra of compound 3 showed the
presence of five methyl signals at δ 0.75, 0.99, 1.05, 1.09, and 1.17 two
methyl doublets that appeared at δ 0.92 and 1.01. The 1H NMR spectra
of compound 3 also showed two
oxymethine protons resonating at δ 3.32 and 3.37 and a olefinic proton at δ
5.21. The
presence of five methyl singlets and two methyl doublets suggested that compound
3 belongs to ursane type
triterpenoid having two secondary hydroxyl groups and a tri substituted double
bond between C-12C-13. In aromatic range, two doublet of doublet appeared at δ
6.97 and 7.48. The spectrum also displayed a multiplet at δ 7.22 and a doublet
at δ 7.34. The 13C-NMR values
for all the protons and carbons were assigned on the basis of HMQC and HMBC
correlations and were given in Table 1.
The appearance of an ester carbonyl group resonating at δ 180.1 in the 13C
NMR spectral data of 3 suggested the
presence of an ester functional group and its location was identified at C-28
by the key COSY and HMBC correlations as shown in Figure 4.
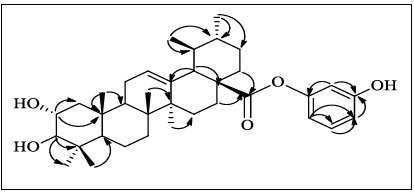
Figure
4: HMBC
correlation of compound 3.
Table
1: NMR
spectral data of compound 3 (1H-NMR 500 Hz, 13C 125 MHz).
A search in literature found that the spectral
characteristics of 3 were consistent
to the reported literature values of Corosolic acid except the aromatic
spectral data that confirmed by the key COSY and HMBC correlations as shown in Figure 3. The correlation between
protons and carbon of compound 3 are
summarized in table 1.
Figures 5 and 6 depicts compound 1 was not effective against non-small
cell lung
cancer cell line (NCI-H460) while it displayed growth
inhibition against breast cancer cells (MCF-7) with IC50 value of
~43 µM. In addition, compound 2 and 3 exhibited growth inhibition against
both non-small cell lung and breast cancer cells. In lung cancer cell line
(NCI-H460), HI-6 exhibited IC50 value of ~2.8 µM which was ~2x more
potent than that of HI-7. However, in case of breast cancer cells (MCF-7), both
were equipotent with IC50 value of ~3 µM (Figure
7).
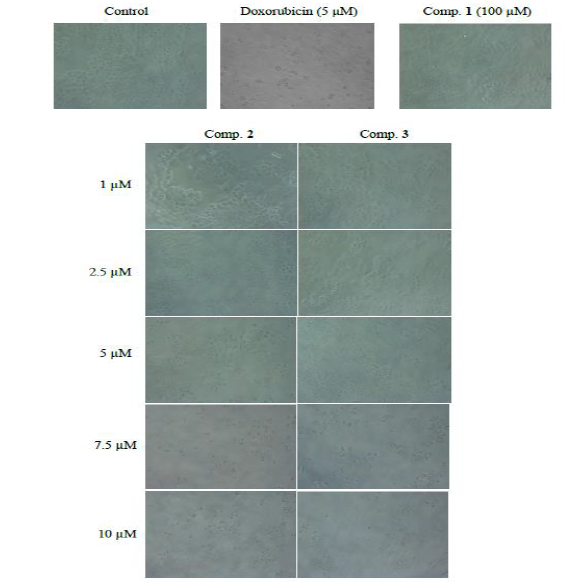
Figure
5: Growth
inhibitory effects of HI-2, HI-6, and HI-7 on non-small cell lung cancer
(NCI-H460) cell line.
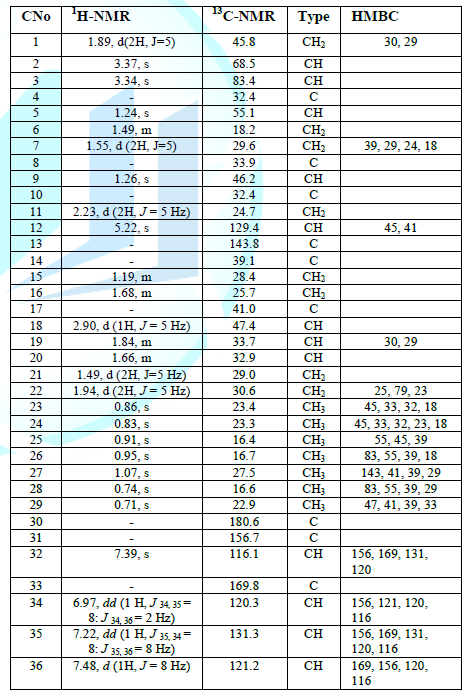
Figure
6: Growth
inhibitory effects of comp. 1, 2 and 3against breast
cancer (MCF-7) cell line.
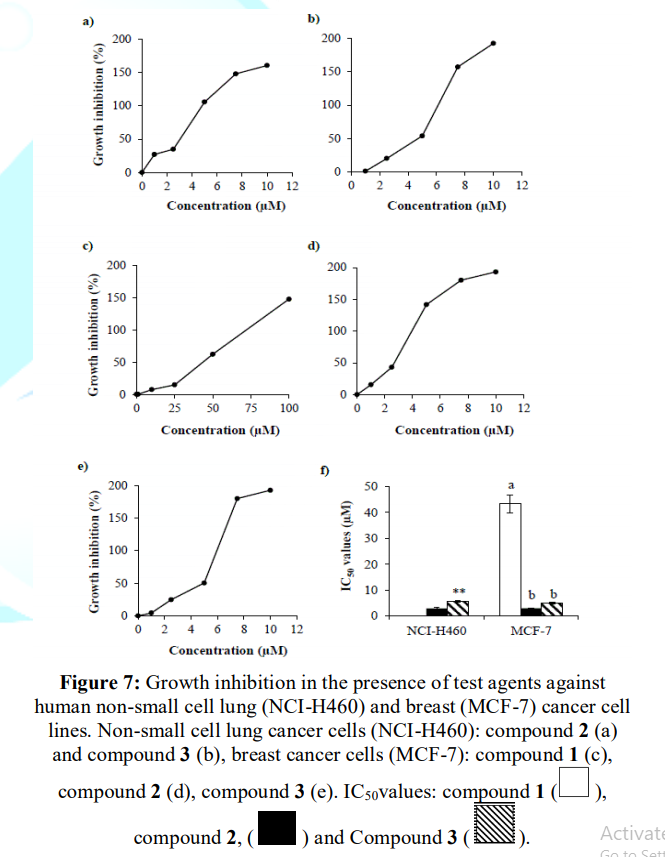
Figure 7: Growth inhibition in the presence of test agents
against human non-small cell lung (NCI-H460) and breast (MCF-7) cancer cell
lines. Non-small cell lung cancer cells (NCI-H460)
After successful docking runs, the best
docked conformation for each compound was viewed in UCSF chimera by using View Dock tool
option. All three compounds were docked in the minor
groove of DNA model (Figure 8).
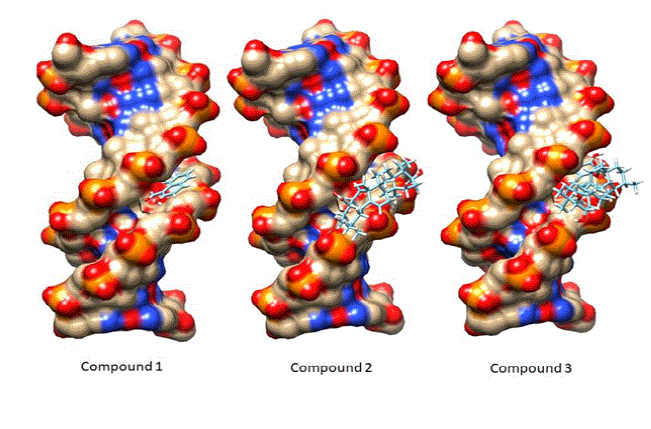
Figure
8: All three
compounds docked in the minor groove of DNA.
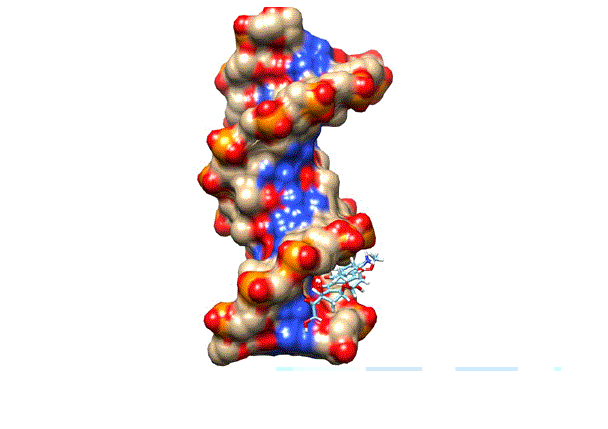
Figure
9: The
docking of doxorubicin in the minor groove of DNA.
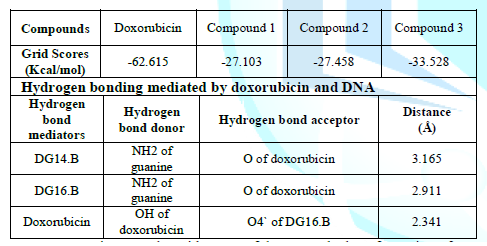
Table
2:Given are
the grid scores of the top ranked conformation of doxorubicin and all three
compounds. The details of hydrogen bonding mediated by doxorubicin and DNA.
Structure analysis of each compound was done by Structural
analysis tool. We did not find any hydrogen bond interactions
between DNA and our top ranked conformations of three compounds. They formed
weak interactions such as van dar waal and hydrophobic interactions with the
DNA. We also docked the Doxorubicin by following the same protocols. It
produces its anticancer activity through intercalation mode. The doxorubicin
was also docked in the minor groove but at the different position (Figure 9). The docking of doxorubicin
in minor grooves suggests that minor groove binding is the dominant
pre-intercalation step (Lei, 2012 #17). The rigid scores of all compounds and
doxorubicin are given in Table 2.
The high negative value of doxorubicin indicates that it is a strong DNA binder
than our compounds. The docking outcomes also correlate with the gel
electrophoresis run where doxorubicin is showing high affinity as compared to
our three compounds.
The energy score of compound 3 has a
relatively high negative value than compounds 1 and 2. In case of
doxorubicin while performing the structure analysis with the help of UCSF
chimera, three hydrogen bonds were found. The purine bases guanine (DG14.B and
DG16.B) of strand B are involved in mediating the hydrogen bonding shown in Figure 10. The details of the hydrogen
bond mediators, donors, acceptor and distances of doxorubicin and DNA are given
in table 2.
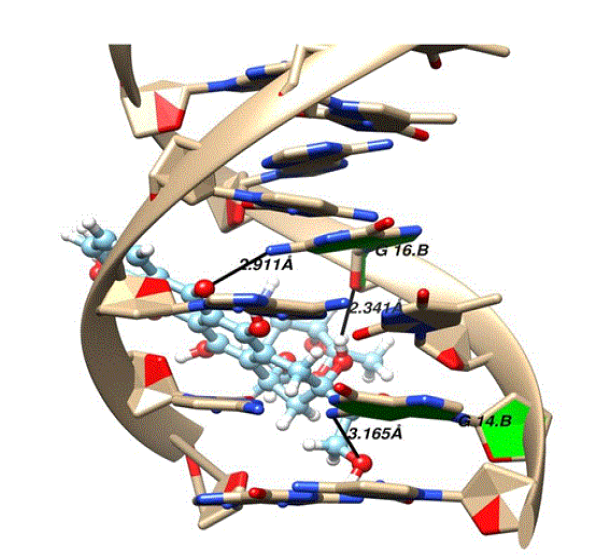
Figure
10: The
three hydrogen bond interactions formed between doxorubicin and DNA.
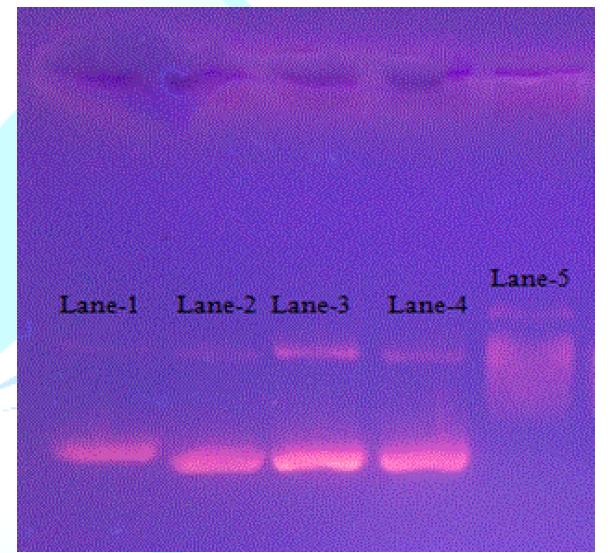
Figure
11: Effect
of HI-2, HI-6, HI-7 and doxorubicin on plasmid pBR322 DNA. Control (Lane-1),
2.5 μM of compound 1 (Lane-2), compound 2 (Lane-3), compound 3
(Lane-4), and doxorubicin (250 nM, Lane-5).
Figure 11 depicts that
in control (lane-1), two bands of similar shape were observed and no change was
observed in the presence of 1, 2, 3 at 2.5μM (lanes -2, -3 and -4,
respectively). However, at 250nM, doxorubicin (lane-5) exhibited smear
formation suggesting its interaction and damaging effect on DNA. From the DNA
docking and electrophoretic mobility experiments, it is noted that anticancer
activity of these three compounds is not related to DNA intercalation. However,
weak interactions of these compounds in the minor groove of DNA suggest that
these may modify the DNA function at the level of gene expression [35].
Therefore, further studies at transcriptional level should be performed to
determine the mechanism of their anticancer activity, whereas the docking
result of doxorubicin suggests clearly that it is a strong DNA binder rendering
it as an anticancer
agent.
Conclusions
It is concluded that the new compound 3 was isolated from the sea buck thorn.
It displayed potent anticancer activity against lung cancer than that of known
compounds 1 and 2 with no structural DNA damage. Their weak interactions with minor
groove of DNA suggest that they may modify gene expression to induce anticancer
activity. Lahore, Pakistan. The plant materials leaf, stems and
seeds were properly cleaned and kept in room temperature.
References
- Bal LM, Meda V, Naik S, Satya S.
Sea buckthorn berries: a potential source of valuable nutrients for
nutraceuticals and cosmoceuticals (2011) Food Res Int 44:1718-1727. https://doi.org/10.1016/j.foodres.2011.03.002
- Malinowska P, Olas B. Sea
buckthorn-valuable plant for health (2016) Kosmos 65:285-292.
- Shivapriya S, Ilango K, Dubey G.
Evaluation of antioxidant and neuroprotective effect of Hippophae rhamnoides (L.) on oxidative stress induced cytotoxicity
in human neural cell line IMR32 (2015) Saud J Biol Sci 22:645-650.https://doi.org/10.1016/j.sjbs.2015.04.011
- Upadhyay NK, Kumar R, Siddiqui M,
Gupta A. Mechanism of wound-healing activity of Hippophae rhamnoides L. leaf extract in experimental burns (2011)
Evidence-based complementary and alternative medicine. https://dx.doi.org/10.1093/ecam/nep189
- Li TS, Beveridge TH. Sea
Buckthorn (Hippophae rhamnoides L.)
Production and Utilization (2003) NRC Research Press, Canada.
- Rousi A. The genus Hippophae L. A taxonomic study Paper (1971)
Annales Botanici Fennici 8:177-227.
- Beveridge T, Li TS, Oomah BD, Smith
A. Sea buckthorn products: manufacture and composition (1999) J Agri Food Chem
47:3480-3488. https://doi.org/10.1021/jf981331m
- Zeb A. Chemical and nutritional
constituents of sea buckthorn juice (2004) Pakistan J Nutrition 3:99-106. http://dx.doi.org/10.3923/pjn.2004.99.106
- Mäkinen KK, Söderllng E. A
quantitative study of mannitol, sorbitol, xylitol, and xylose in wild berries
and commercial fruits (1980) J Food Sci 45: 367-371. https://doi.org/10.1111/j.1365-2621.1980.tb02616.x
- Yang B, Kallio HP. Fatty acid
composition of lipids in sea buckthorn (Hippophaë
rhamnoides L.) berries of different origins (2001) J Agri Food chem 49:1939-1947. https://doi.org/10.1021/jf001059s
- Geetha S, Jayamurthy P, Pal K,
Pandey S, Kumar R, et al. Hepatoprotective effects of sea buckthorn (Hippophae rhamnoides L.) against carbon
tetrachloride induced liver injury in rats (2008) J Sci Food Agri 88:1592-1597. https://doi.org/10.1002/jsfa.3255
- Hsu YW, Tsai CF, Chen WK, Lu FJ.
Protective effects of seabuckthorn (Hippophae
rhamnoides L.) seed oil against carbon tetrachloride-induced hepatotoxicity
in mice (2009) Food Chem Toxicol 47:2281-2288. https://doi.org/10.1016/j.fct.2009.06.015
- Sabir SM, Maqsood H, Hayat I,
Khan M, Khaliq A. Elemental and nutritional analysis of sea buckthorn (Hippophae rhamnoides ssp. turkestanica)
berries of Pakistani origin (2005) J Med Food 8:518-522.
https://doi.org/10.1089/jmf.2005.8.518
- Zeb A. Anticarcinogenic potential
of lipids from Hippophae: evidence from the recent literature (2006) Asian
Pacific J Cancer Prevent 7: 32.
- Basu M, Prasad R, Jayamurthy P,
Pal K, Arumughan C, et al. Anti-atherogenic effects of seabuck thorn (Hippophaea rhamnoides) seed oil (2007)
Phytomedicine 14:770-777. https://doi.org/10.1016/j.phymed.2007.03.018
- Chawla R, Arora R, Singh S, Sagar
RK, Sharma RK, et al. Radioprotective and antioxidant activity of fractionated
extracts of berries of Hippophae rhamnoides
(2007) J Med Food 10: 101-109. https://doi.org/10.1089/jmf.2006.007
- Gao ZL, Gu XH, Cheng FT, Jiang
FH. Effect of sea buckthorn on liver fibrosis: a clinical study (2003) World J
Gastroenterology 9:1615-1617. https://dx.doi.org/10.3748%2Fwjg.v9.i7.1615
- Geetha S, Ram MS, Singh V,
Ilavazhagan G, Sawhney R. Anti-oxidant and immune-modulatory properties of
seabuck thorn (Hippophae rhamnoides) -
an in vitro study (2002) J Ethno pharma 79:373-378. https://doi.org/10.1016/S0378-8741(01)00406-8
- Geetha S, Ram MS, Singh V,
Ilavazhagan G, Sawhney R. Effect of seabuck thorn on sodium
nitroprusside-induced cytotoxicity in murine macrophages (2002) Biomed pharmaco
therapy 56:463-467. https://doi.org/10.1016/S0753-3322(02)00290-1
- Goel H, Prasad J, Singh S, Sagar
R, Kumar IP, et al. Radioprotection by a herbal preparation of Hippophae rhamnoides, RH-3, against
whole body lethal irradiation in mice (2002) Phyto med 9:15-25. https://doi.org/10.1078/0944-7113-00077
- Gupta A, Kumar R, Pal K, Banerjee
PK, Sawhney RC. A preclinical study of the effects of seabuck thorn (Hippophae rhamnoides L.) leaf extract on
cutaneous wound healing in albino rats (2005) The Int J Low Extrem Wounds 4:88-92. https://doi.org/10.1177/1534734605277401
- Saggu S, Divekar HM, Sawhney RC,
GuptaV, Banerjee PK, et al. Adaptogenic and toxicity evaluation of Sea
buckthorn (Hippophae rhamnoides) leaf
extract: a dose dependent study (2006) Toxicol Lett 164:S196.https://doi.org/10.1016/j.toxlet.2006.07.066
- Süleyman H, Demirezer L,
Büyükokuroglu M, Akcay M, Gepdiremen A, et al. Antiulcerogenic effect of Hippophae rhamnoides L (2001) Phyto Ther
Research 15:625-627. https://doi.org/10.1002/ptr.831
- Upadhyay N, Kumar R, Mandotra S,
Meena R, Siddiqui M,et al. Safety and healing efficacy of Sea buckthorn (Hippophae rhamnoides L.) seed oil on
burn wounds in rats (2009) Food Chem Toxico 47:1146-1153. https://doi.org/10.1016/j.fct.2009.02.002
- Xing J, Yang B, Dong Y, Wang B,
Wang J, et al. Effects of sea buckthorn (Hippophae
rhamnoides L.) seed and pulp oils on experimental models of gastric ulcer
in rats (2002) Fitoterapia 73: 644-650. https://doi.org/10.1016/S0367-326X(02)00221-6
- Yang B, Kallio H. Composition and
physiological effects of sea buckthorn (Hippophae)
lipids (2002) Trends Food Sci Tech 13:160-167. https://doi.org/10.1016/S0924-2244(02)00136-X
- Zhang W, Zhao J, Wang J, Pang X,
Zhuang X, et al. Hypoglycemic effect of aqueous extract of seabuck thorn (Hippophae rhamnoides L.) seed residues
in streptozotocin induced diabetic rats (2010) Phyto Ther Res 24:228-232. https://doi.org/10.1002/ptr.2917
- Kim YM, Wang MH, Rhee HI. A novel
α-glucosidase inhibitor from pine barks (2004) Carbohydrate Res 339:715-717.
- Cao Q, QuW, Deng Y, Zhang Z, Niu
W, et al. Effect of flavonoids from the seed and fruit residue of Hippophae rhamnoides L. on glycol-metabolism
in mice (2003) J Chinese Medi Mat 26:735-737. https://doi.org/10.1016/j.carres.2003.11.005
- Bhardwaj P, Varshneya C, Kaistha
K, Tandon T. In vitro evaluation of
anti-diabetic and antioxidant activity of Seabuckthorn (Hippophae rhamnoides L.) leaves (2015) J Medi Plants Re 9:929-932. https://doi.org/10.5897/JMPR2015.5416
- Pettersen EF, Goddard TD, Huang
CC, Couch GS, Greenblatt DM, et al. UCSF Chimera-a visualization system for exploratory
research and analysis (2004) J Comput Chem 25:1605-1612. https://doi.org/10.1002/jcc.20084
- Berman HM, Westbrook J, Feng Z,
Gilliland G, Bhat TN, et al. International tables for crystallography volume F:
crystallography of biological macromolecules (2006) Springer, USA.
- Allen WJ, Balius TE, Mukherjee S,
Brozell SR, Moustakas DT, et al.Impact of new features and current docking
performance (2015) J Comput Chem 36:1132-1156. https://doi.org/10.1002/jcc.23905
- Onoja E, Ndukwe I. Isolation of
oleanolic acid from chloroform extracts of Borreria
stachydea (2013) J Nat Prod Plant Resour 3:57-60.
- Baraldi PG, Bovero A, Fruttarolo
F, Preti D, Tabrizi MA, et al. DNA minor groove binders as potential antitumor
and antimicrobial agents (2004) Med Res Rev 24:475-528. https://doi.org/10.1002/med.20000
*Corresponding author:
Huma
Aslam Bhatti, HEJ Research Institute of Chemistry International Center for
Chemical and Biological Sciences, University of Karachi, Karachi, Pakistan, Tel: +92
21 99261779, Fax: +92 21 34819018-19, E-mail: huma_aslam31@hotmail.com
Citation:
AliI, ZahraNA, Reazuddin, Sharif H, Mudassar, et al. A new potent
anti-cancer corosolic ester identified from the super miracle plant hippophae rhamnoides (sea buckthorn) (2019) Biochem Modern
Appli2: 24-29