
 PDF
PDF
Introduction
The focus of these early years of
the 21st Century’s second decade is clearly on sustainability,
whether that is consideration of weather, or crops, of safety and even of
shoreline disappearing, stranding hundreds of millions, perhaps many more. Ask
most people about their feeling towards sustainability, without any other
modifying factor such as cost or dislocation, and the answer will be obvious in
virtually all cases. Unless the person has been fast asleep for decades, the
likely answer is a concern, one way or another, with sustainability, and the
recognition that on planet earth ‘something is changing, and not necessary for
the better.’ Hundreds of books, thousands of academic research papers, and
uncountable newspaper and magazine articles are developed to sustainability
[1].
A great deal of the information
that people receive is of a general sort, with no specific call to action.
Occasionally, however, a specific issue emerges in sustainability, one which
requests the individual to donate money for support, or at least to sign a
petition. Despite the noble intentions of those who send these messages, we do
not know the degree to which the specific messages can be understood, and
whether the messages, after being understood, are sufficiently strong to be
acted on. The specific topic for this Mind Genomics cartography is wind-power,
specifically wind-power in Texas. The study was occasioned by the opportunity
to create an energy farm which could produce a great deal of the necessary
energy for Texas. Wind-power itself is a key source of energy, a source which
could provide uninterrupted energy to consumers [2,3]. Suggest that “wind and nuclear
energy power plants have the highest sustainability indicators”, addressing
many the concerns about such uninterruptable energy. Despite its promise, however,
wind-power has not performed well.
There is a strong positive
feeling about wind-power, but only a moderate success rate. A great deal of the
issue with wind-farms can be traced to the refusal of people to have wind-farms
near their problem, which call “NIMBY”, or ‘not in my back yard’ [4]. The issue
of NIMBY may be thought to affect only those countries with richer landowners,
where the presence of wind power turbines may be unsightly and lower property. Yet
NIMBY with respect to public opinion occurs even in poorer countries like
China, in rural areas [5]. In China, NIMBY can be rephrased as ‘not in my
backyard, but not far from me either.’ Acceptance of wind power because of the
towers is least when the towers are located in one’s village, but acceptance
increases when the towers are located in a different rural area or in towns. The
specific study reported here was occasioned by the opportunity to purchase a
very large tract of undeveloped land, for sale in Texas. The objective of the
study was to identify the specific messages that one might use with citizens of
Texas, those messages presenting information about the opportunity to help
Texas with its energy needs. The messages which were ‘successful’ in the study
were to be considered for use in a public campaign to raise the necessary money
to purchase the land.
The study itself emerges from
three areas, energy and climate concern (economic sustainability), ‘giving’
(the research about appeals for worthy causes), and ‘market
research’ (specifically approaches to understand the mind of the person who
is asked to donate.) All three topics have extensive histories, with a variety
of references summarizing the general topics of sustainability [6]. As our
final point of introduction, we note that the study deals with a real, specific
occasion, emerging publicly in the second half of 2019. The study was
occasioned by the plan to prepare a campaign, to be conducted by author
Thistle. The hope was that the research would reveal extremely strong messages
that could be incorporated into the messaging to raise the necessary monies for
the land purchase.
Method
The Mind Genomics approach has
been presented in detail in previous papers. The approach follows a series of
well-choreographed steps, with the goal to extract patterns of information from
the ratings, these patterns revealing a linkage between the responses and the
specific elements, or pieces of relevant information [7-9].
Part 1: Setting up the study, executing it, receiving the modeled data in a report and in data tables
Identify the overarching topic: For this study the overarching topic is the situation and the opportunity to forward the technology of wind-power by the purchase of available land, and the construction of wind turbines which convert wind power to electrical power. The topic focuses on Texas, where the land is available for purchase. Tell a specific story about the topic, formulated in the form of questions: (Table 1) shows the four questions. The questions will not be shown in the research but are necessary in order to drive the creation of statements, answers to the question. For each question create four answers which address the specific question: The answer may be grounded in fact, may be a hypothesis about what could happen, or may be totally fanciful yet relevant in terms of connection to the question. Make every effort to generate simple phrases, easy to read, easy to understand. Avoid mental tasks such as if/then, and so forth. All phrases should be written in a simple, declarative form, with few if any subordinate phrases. The strategy to develop these questions (and answers) follows the Socratic way of thinking.
Experimental
Design: Use a underlying plan, the experimental
design, to specify 24 combinations of the answers, the 24 vignettes, with the
property that each of the 16 elements is statistically independent of every
other element, and that each element appears equally often across the 24
vignettes. The experimental design may be likened to a set of 24 recipes. The
number 24 was arrived at by creating alternative experimental designs in which
the elements remain the same, but the combinations of elements changed. The
permutation scheme generates several hundred of these 24-vigette designs, all
structurally the same, but different in their specific combinations. Indeed,
for up to 100 different designs, more than 95% of the vignettes are unique
allowing the design to span the range of different combinations.
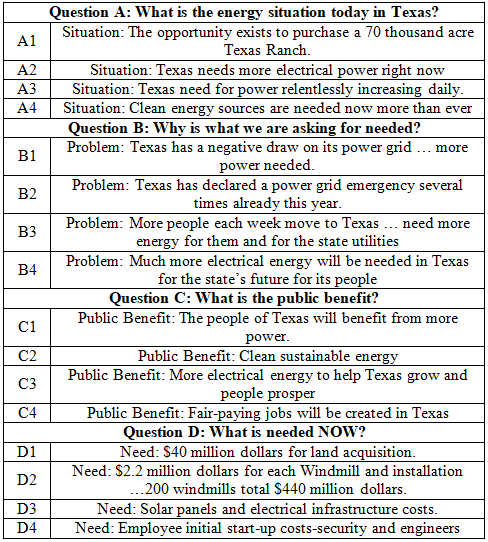
Table 1: The four
questions and the four answers to each question.
Create a meaningful rating question: Select a rating question, anchored at both ends. Minimize the number of scale points, choosing 3,5,7 or 9 scale points. Early studies with Mind Genomics worked with 9-point scales. More recent studies have worked with 5-point scales. Anchor the scales at the end, and if relevant, anchor each scale point. Each scale point was anchored in this study, in order to create two scales, one for ‘understanding the message’, one for ‘recommending the message.’ Create an introduction to anchor the experiment: Create a simple, very short, 1-2 line introduction to the study. The introduction or orientation tells the respondent what to expect, or more correctly, instructs the respondent to read the vignette (aforementioned combination of elements), treat the vignette as one idea, and assign a rating to the full vignette. The less said to the respondent at this stage the better. The real information will come from the elements themselves.’ The short introduction does not bias the respondent. Invite respondents to participate: In this study the respondents were recruited from individuals participating with Luc.id. These respondents had preregistered to participate and were totally unknown to the researchers, other than fitting the specifications about age and gender. The standard age was constrained to be 18 years old or older. No restrictions were put upon the precise distribution of the ages. The market was to be Texas, since the issue of wind power and available land was to be in Texas. Execute the experiment: Run the sort experiment on the Internet, with each respondent proceeding at the pace most convenient. Across most studies the experiment takes approximately 4-5 minutes.
Receive
the full basic analysis in a PowerPoint® and in an
Excel® file within one minute of the end of the on-line experiment. The time
for the experiment with 50 respondents is approximately one hour, so the full
results, except for the additional analyses, are available in approximately one
hour. The analysis can then proceed to a further ‘deep dive’ into the data.
Most of the modeling and clustering (segmentation) is already complete.
Part 2: How the data are
analyzed by the Mind Genomics ‘machine’ (BimiLeap).
· The
preliminary processing converts all scale points dealing with ‘Understand’ to
100 (ratings of 3 and 5 respectively). The other three scale points, dealing
with ‘Not understand, (ratings of 1, 2 and 4 respectively) are converted to 0.
The same process converts all scale point dealing with ‘Recommend’ to 100
(ratings of 4 and 5). The other three scale points, dealing with ‘Not recommend
(ratings of 1,2 and 3, respectively) are converted to 0. After the
transformation, a small random number (<10-5) is added to all the
transformed data, to ensure that the OLS regression will not ‘crash’.
· The
first analysis uses OLS (ordinary least-squares) regression to the relate the
presence/absence of the elements to the one key dependent variable, specified
above, ‘Recommend’ (1,2,3 transformed to 0,4,5 transformed to 100). The
analysis does so at the level of the individual respondent. And an example, for
Study 1 this modeling generated 51 equations, showing the relation between the
16 elements and the response ‘recommend - yes.’ The data from this first model
at the individual respondent level will be used in the analysis used to divide
the respondents into two mind-sets, groups with different mind. The division is
done by clustering [10]. The approach is spelled out in detail in recent papers
[11].
· The
data now comprises results for Total Panel, Gender (male versus female), Age
(under 29, 30 and older) and two emergent mind-sets based upon recommendations.
In all there are seven groups, five specified by the respondent (age, gender,
total), and two specified by the pattern of results, mind-sets). Each
respondent can thus be assigned to an age group, a gender group, a mind-set,
and of course to the total panel, by definition.
· The
OLS regression now creates an equation relating the presence/absence of the 16
elements to the transformed rating. The equation or model is expressed as:
Binary Rating = k0 + k1 (A1) + k2(A2)…k16(D4).
The OLS regression creates seven separate equations for each variable, one for
total, two for the genders, two for the ages, and two for the mind-sets.
· The
additive constant k0, is the expected percent of the time that the
respondent will answer with a rating such as ‘would recommend’, in the absence
of elements, and when the dependent variable is the binary expansion for ‘would
recommend,’ viz., ratings of 4 or 5. The additive constant is a purely
estimated parameter, but as the analysis below shows, the additive constant
provides insight into the predilection of the respondents to assign a specific
rating.
· The
coefficients, in turn, k1-k16, show the additional
percent of positive responses (e.g., would recommend) when the specific element
is inserted into the vignette. The binary transformation from the Likert Scale
to the binary scale means that these coefficients have ratio-scale properties,
so a 2 is twice as much as a 1. The experimental design ensures that these
coefficients have absolute value, allowing them to be compared across groups,
archived, and their variation studied over time and across situations.
· The
coefficients are additive, and can be combined with the additive constant in
order to create a sum, showing the estimated percent of responses of a certain
type (e.g., recommend), based upon the predilection to assign that response
(additive constant), and the incremental or decremental contributions from the
individual elements. It is important to create combinations of no more than
four elements, and at most one element from a specific question, paralleling
the approach used to create the vignettes.
· The
same approach is used to relate the presence/absence of the elements to the
response time. The only difference is that the model for response time does not
have an additive constant.
Rating of “Recommend”
Our
first analysis (Table 2) look at the
summary results from the equation for the rating of recommends (ratings 4 and 5).
Table 2 shows us that when we look at the Total Panel we see a very strong
proclivity to say that one will recommend (additive constant = 64). In the
absence of elements, we expect 64% of the responses to be ‘I recommend. Some of
these judgments come from the selection of ‘I understand or I would recommend,’
as well as from the less fulsome praise, specifically ‘I don’t understand, but
I would still recommend’. When we look at the Total Panel, we see very few
strong performing elements. Previous experience with Mind Genomics studies of
this sort suggest that only in the most obvious of cases do we see very high
positive coefficients from the total panel. Those who look for very high
coefficients from the total panel may have to run the study many times to
happen upon the appropriate messaging. The high coefficients will emerge from
the mind-sets, as we will see.
There
are gender
differences, although not dramatic ones. Males are slightly less likely to
recommend than are females (additive constant 57 for males versus 66 for
females). Males are more focused on the immediate need, in a concrete way,
D4 Need: Employee
initial start-up costs-security and engineers.
D1 Need: $40 million
dollars for land acquisition.
Females
are more responsive to general needs,
B4 Problem: Much more
electrical energy will be needed in Texas for the state’s future for its people.
There are age differences as well. The proclivity to recommend is the same for
both younger and older respondents, with similar additive constants (61 and 67
respectively). Younger respondent more focused on specific,
D1 Need: $40 million
dollars for land acquisition. Older respondent-respond to messages about the
future
B4 Problem: Much more
electrical energy will be needed in Texas for the state’s future for its people.
B3 Problem: More people
each week move to Texas need more energy for them and for the state utilities.
Two Mind Sets Emerge
Mind-Set 1: Global view,
look at the positive opportunities for Texas. Mind-Set 1 shows a lower
likelihood to recommend, until the right message is delivered. The additive
constant is 55, meaning that in the absence of a compelling message,
respondents in Mind-Set 1 may or may not recommend. Here are the compelling
messages for Mind-Set 1.
B4 Problem: Much more
electrical energy will be needed in Texas for the state’s future for its people.
B3 Problem: More people
each week move to Texas need more energy for them and for the state utilities.
C4 Public Benefit:
Fair-paying jobs will be created in Texas.
C2 Public Benefit: Clean
sustainable energy.
Mind
Set 2 is a lot more likely to recommend (additive constant is 75) but focuses
on the specifics of the job. Mind-Set 2 would be more likely to be an effective
manager.
D4
Need: Employee initial start-up costs-security
and engineers.
Driving
to understand
Our second analysis looks at the
ratings which signal that they understand the vignettes, and thus the messages
contained within the vignettes. The rating of 3 or 5 was converted to 100, and
the other ratings were converted to 0. We are not interested in whether the
understanding is connected to recommend, or not recommend, but rather simply we
look at understanding. As noted above, the OLS (ordinary least squares)
regression was done on the data from the ‘relevant
respondents.’ One pass through all the relevant data generated the
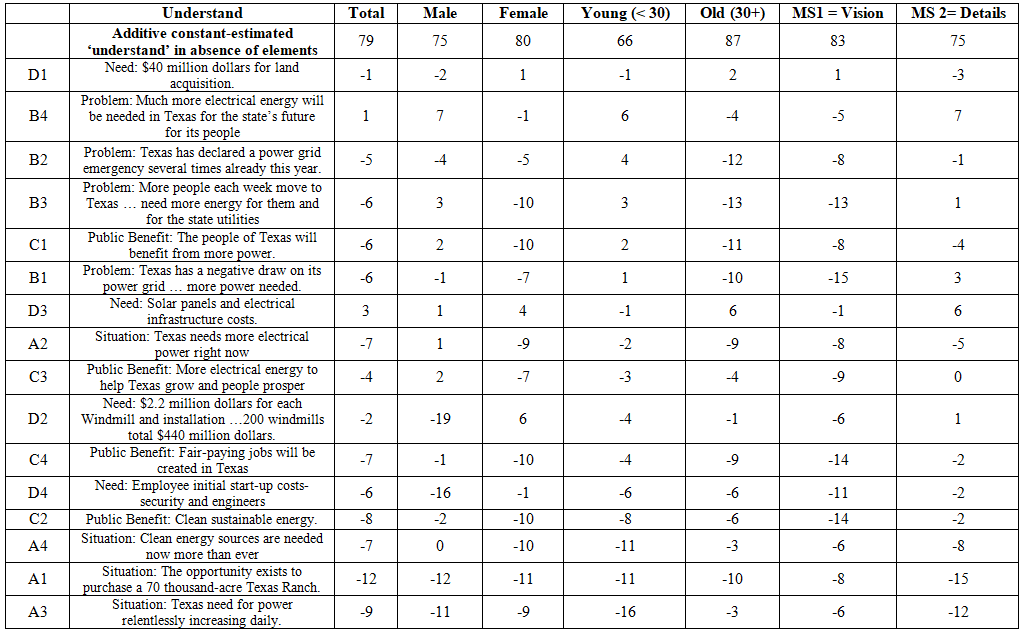
coefficients, including the additive constant and the 16 coefficients. Table 3
suggests that in the case of understanding most of the responses will be Yes, I
understand (rating 3 or 5), whether the vignette is recommended or not
recommended. The overwhelming response of ‘Yes, I understand” can be seen from
the high additive constant. Combining all respondents generates an equation
whose additive constant is 79; meaning four out of five responses will be 3 or
5. The key groups showing differences in basic understanding are age, with the
younger respondents (under 30) saying that they understand only 66% of the time
(additive constant 66), whereas the older respondents (30 or older) saying that
they understand 87% of time. With high additive constants, we do not expect to
see many elements showing coefficients of 8 or higher, on a rounded basis, a
level that is considered to be both statistically significant at the 95% level
of confidence, as well as a level covering with relevant exogenous
behavior, when such exogenous behavior is actually measured. Table 3 confirms that expectation,
showing no strong performing elements increasing understanding beyond the basic
high level.
Driving
to ‘would not recommend’
The focus of most research is
positive, either recommend or understand. Mind Genomics allows the researcher
to explore the rating of ‘not understand’ and ‘not recommend.’ For most
research where patterns of response are interesting, considering the negative
part of the rating scale is not particularly instructive, simply because the
negative part of the scale is the ‘absence’ of the desired behavior. Mind
Genomics makes that negative portion of the scale interesting, simply because
the test stimuli, the messages, are cognitively meaningful.
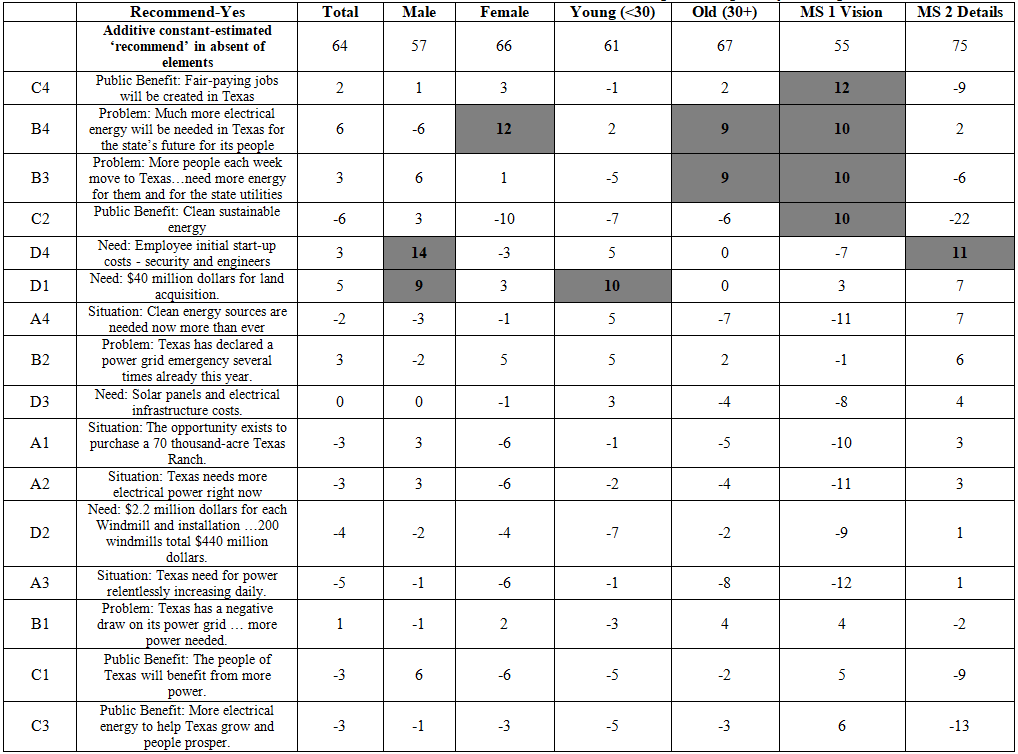
Table 2: Relation between elements and rating of ‘Likely to recommend’ (rating 4 and 5 on the 5-point rating scale).
“Absence of positive response’ is
linked with a specific, meaningful element, i.e., a ‘cognitively rich’ element.
Our third analysis deals with three scale points about ‘not recommending’
(1,2,3). As noted above, we transformed ratings of 1,2, or 3 to 100, and
ratings of 4 and 5 (recommend) to their complementary value 0.
(Table
4) shows the parameters of the models. Additive
constants are low to moderate, suggesting that without any elements, about a
third to almost half of the ratings would be ‘do not recommend.’ These additive
constants are the complement to the values for the additive constant for
‘recommend’, the bigger story emerges from the elements.
Total panel-No elements drives ‘not recommend’, Males and females are not against any element Exception: Females for C2 above (Public Benefit” Clean sustainable energy). Age does not drive elements into not recommend: Exception: Older respondents for A3 (Situation, Texas need for power relentlessly increasing daily). Mind-Set makes a difference.
Mind-Set 1 (Vision) does not want to recommend
messages these specific details: A3 Situation:
Texas need for power relentlessly increasing daily.
D2 Need: $2.2 million
dollars for each Windmill and installation …200 windmills total $440 million
dollars.
A1 Situation: The
opportunity exists to purchase a 70 thousand-acre Texas Ranch.
A2 Situation: Texas needs
more electrical power right now
A4 Situation: Clean energy
sources are needed now more than ever
D3 Need: Solar panels
and electrical infrastructure costs.
Mind-Set 2 (Details) does not want to recommended
messages with these general but not ‘proven’ or ‘explicated’ benefits
C2 Public Benefit: Clean
sustainable energy.
C1 Public Benefit: The
people of Texas will benefit from more power.
C3 Public Benefit: More
electrical energy to help Texas grow and people prosper.
C4 Public Benefit:
Fair-paying jobs will be created in Texas.
Driving to ‘Do Not Understand’
We can look at
the scale from the reverse direction, ‘do not understand’ (Table 5).
Total
Panel: The strongest elements driving ‘Do Not Understand’ are those talking about
the situation in Texas
A1 Situation: The opportunity
exists to purchase a 70 thousand-acre Texas Ranch.
A3 Situation: Texas need for
power relentlessly increasing daily.
C2 Public
Benefit:
Clean sustainable energy
The genders
differ.
Women seem to say
‘I DON’T UNDERSTAND’ for quite a number of elements
A1 Situation: The opportunity
exists to purchase a 70 thousand-acre Texas Ranch
A3 Situation: Texas need for
power relentlessly increasing daily.
C2 Public
Benefit:
Clean sustainable energy
A2 Situation: Texas needs more
electrical power right now
A4 Situation: Clean energy
sources are needed now more than ever
C4 Public
Benefit:
Fair-paying jobs will be created in Texas
Men
A1 Situation: The opportunity
exists to purchase a 70 thousand-acre Texas Ranch.
A3 Situation: Texas need for
power relentlessly increasing daily.
The ages differ
as well, both in the additive constant, and in a number of specific elements.
The younger
respondents are more likely to be negative than the older respondents additive constant
13 for older, vs. 34 for younger). The younger respondents simply do not
understand.
The
younger respondents do not understand a sense of immediacy
A3 Situation: Texas need for
power relentlessly increasing daily.
In contrast, the
older respondents do not understand
B1 Problem: Texas has a
negative draw on its power grid…more power needed.
B3 Problem: More people each
week move to Texas…need more energy for them and for the state utilities
C1 Public
Benefit:
The people of Texas will benefit from more power
B2 Problem: Texas has
declared a power grid emergency several times already this year. The two
mind-sets differ dramatically,
Mind
Set 1 (vision) does not understand the specifics involve in the planning
B1 Problem: Texas has a
negative draw on its power grid…more power needed.
B3 Problem: More people each
week move to Texas…need more energy for them and for the state utilities
D4 Need: Employee initial
start-up costs-security and engineers
Mind
Set 2 (details) does not understand the ‘big picture’
A1 Situation: The opportunity
exists to purchase a 70 thousand-acre Texas Ranch.
A3 Situation: Texas need for
power relentlessly increasing daily.
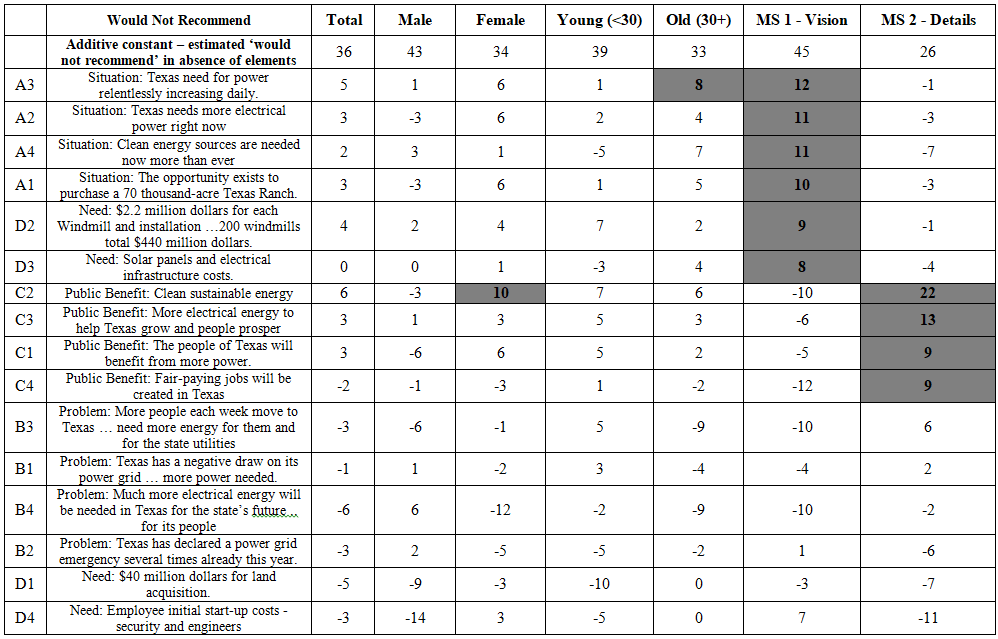
Table 4:Models relating the presence/absence of the elements to ‘not recommend’(ratings 1, 2, and 3 on the 5-point rating scale).
Consideration Time
Up to now we have
dealt with messages and their ability to convince. An emerging measure,
actually a measure reconsidered after some years of disuse, is consideration
time, or ‘reaction time’ in the parlance of experimental psychology. The notion
is that additional insights into the way people think about messages can be
gained by measuring the time during which they are engaged in reading and
processing information. The history of reaction time in experimental
psychology, especially for processing information, can be readily obtained from
classics, such as E.G. Boring’s History of Experimental Psychology
[12]. More modern efforts are found in the literature especially early efforts
in the world of cognitive psychology [13]. The market research community is
trying to commercial these approaches, primarily as measurement tools, to
detect truth-telling vs. lying [14,15]. The traditional methods for measuring
reaction time involve presenting the stimulus to the respondent, instructing
the respondent to signal as soon as the respondent either detects the stimulus
or understands the stimulus (detection versus recognition), and then measure
the time elapsed. The time is presumed to be occupied by cognitive activities, such
as reading and making the decision.
Mind Genomics
moves in this direction, to measure consideration time, but does so in a
simpler manner, one which provides a great deal more information. Recall that
the test stimuli comprise systematically varied combinations. The dependent
variable now becomes the time between the presentation of the test stimulus,
the vignette, and the response, viz., the rating. The respondent need not be
cued into responding, but rather the ratings need to be measured in terms of
‘time elapse.’ The analysis of such elapsed time or in ‘consideration time’ is
quite straightforward, thanks to the types of analyses made possibly by the
experimental design, and ‘systematic
variation.’ Just as we were able to deconstruct the rating (after binary
transformation) into the contributions of the different elements, once again we
create model, this time relating the Consideration Time (response time) to the
16 different elements. The equation, generated from all respondents and data
appropriate to the key subgroup, is: Consideration Time=k1(A1) + k2(A2)….
K16(D4). The additive constant is absent, based upon the fact that
in the absence of elements the consideration time must be 0. There is nothing
to which one can react. Following this convention, we see the 16 coefficients,
one for each element, for each group, in (Table
6). The coefficients are the estimated number of seconds required for the
respondent to read the element and assign a rating. It is the experimental
design, keeping the 16 elements statistically independent, which allows us to
assign some consideration time to each element, that consideration time being
shown numerically by the coefficient.
To reiterate, a
key objective of Mind Genomics is to understand the nature of the underlying
decision processes. The experimental design, coupled with the OLS regression,
assigns different coefficients, namely different consideration times to each
element. Table 6 shows that for the total panel, the longest consideration
times, 1.3 seconds or longer, are occasioned by the presentation of relevant
information. When there is this information which ‘tell a story’ in a general
sense, people pay attention. The number of seconds for each element is 1.3 or
more for these engaging messages.
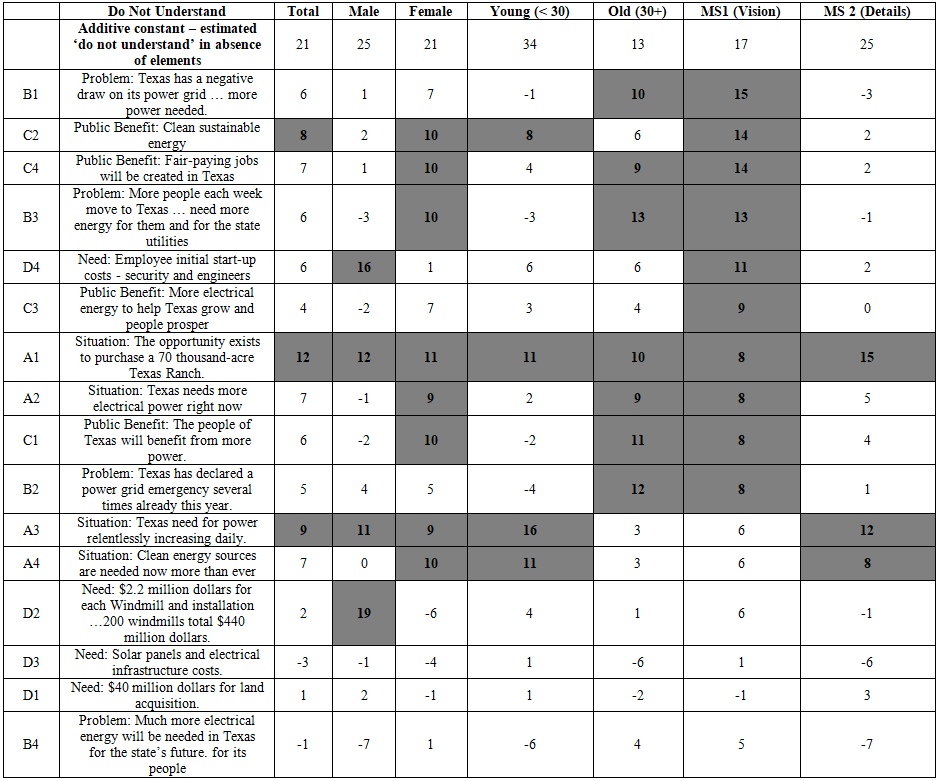
Table 5: Models relating
the presence/absence of the elements to ‘not understand’ (ratings 1, 2, and 4
on the 5-point scale).
B1
Problem:
Texas has a negative draw on its power grid … more power needed
A4
Situation:
Clean energy sources are needed now more than ever
B3
Problem:
More people each week move to Texas need more energy for them and for the state
utilities
C2
Public Benefit:
Clean sustainable energy
C3
Public Benefit:
More electrical energy to help Texas grow and people prosper
When the element
is an ‘ask’ of a certain amount of money, the respondent engages a mere 0.6
seconds, rather than 1.3 seconds or longer
D1 Need: $40 million
dollars for land acquisition
Moving to
Genders, we see dramatic differences, Men-pay longer attention to concrete
information
B1
Problem:
Texas has a negative draw on its power grid … more power needed
C2
Public Benefit:
Clean sustainable energy
C3
Public Benefit:
More electrical energy to help Texas grow and people prosper
A1
Situation:
The opportunity exists to purchase a 70 thousand-acre Texas Ranch
A3 Situation: Texas need for power relentlessly increasing daily.
Females-similar
responses-a slightly deeper focus on messages about people
B1
Problem:
Texas has a negative draw on its power grid…more power needed
A4
Situation:
Clean energy sources are needed now more than ever
B3
Problem:
More people each week move to Texas…need more energy for them and for the state
utilities
C2
Public Benefit:
Clean sustainable energy
C3
Public Benefit:
More electrical energy to help Texas grow and people prosper
D4
Need:
Employee initial start-up costs-security and engineers
Younger
(Age<30)-A sense of evening the ‘playing field’ for jobs
B3
Problem:
More people each week move to Texas … need more energy for them and for the
state utilities
C3
Public Benefit:
More electrical energy to help Texas grow and people prosper
B1
Problem:
Texas has a negative draw on its power grid…more power needed
C2
Public Benefit:
Clean sustainable energy
Older
(Age 30+)-A sense of structural need
A4
Situation:
Clean energy sources are needed now more than ever
B1 Problem: Texas has a
negative draw on its power grid…more power needed
C2
Public Benefit:
Clean sustainable energy
A1 Situation: The opportunity
exists to purchase a 70 thousand-acre Texas Ranch
A3
Situation:
Texas need for power relentlessly increasing daily
B2
Problem:
Texas has declared a power grid emergency several times already this year
D3
Need:
Solar panels and electrical infrastructure costs
Mind-Set
1-Pays attention to messages about the general benefit of wind power
C2
Public Benefit:
Clean sustainable energy
C1
Public Benefit:
The people of Texas will benefit from more power.
D4
Need:
Employee initial start-up costs-security and engineers
C3
Public Benefit:
More electrical energy to help Texas grow and people prosper.
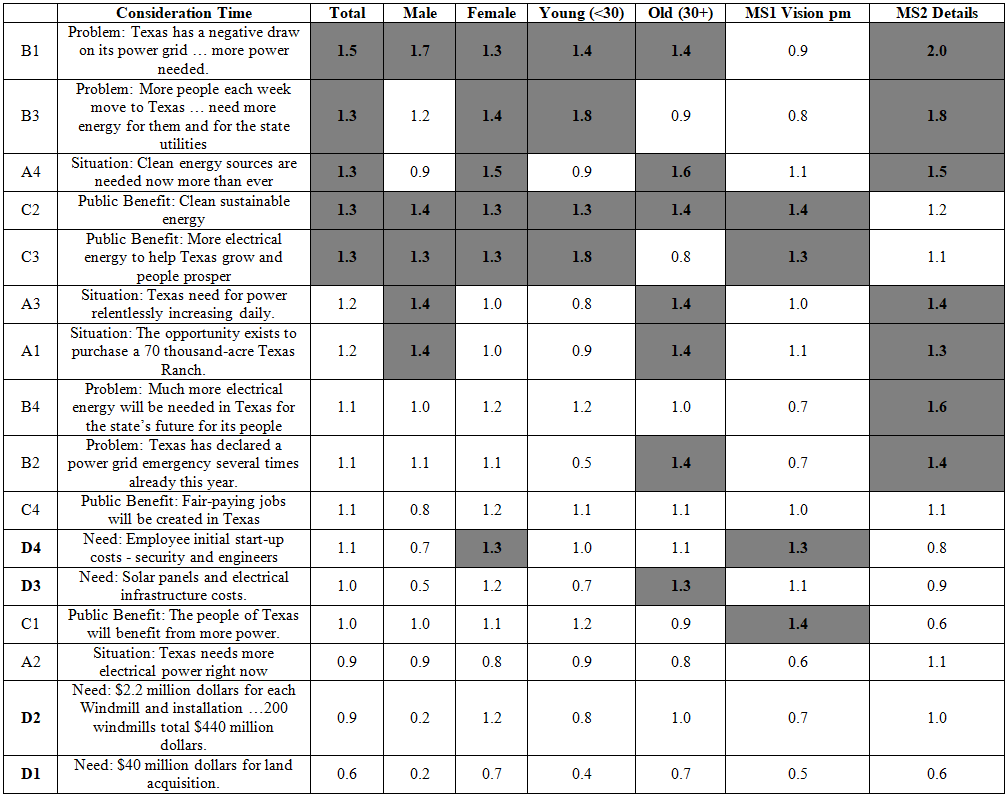
Table 6: Consideration
Time for all elements for total panel each key subgroup.
Mind-set
2-Pays attention to facts
B1 Problem: Texas has a negative draw on its power grid more power needed
B3 Problem: More people each week
move to Texas need more energy for them and for the state utilities
B4
Problem:
Much more electrical energy will be needed in Texas for the state’s future for
its people
A4
Situation:
Clean energy sources are needed now more than ever
A3
Situation:
Texas need for power relentlessly increasing daily.
B2
Problem:
Texas has declared a power grid emergency several times already this year
A1
Situation:
The opportunity exists to purchase a 70 thousand-acre Texas Ranch
Uncovering
pairwise interactions among messages-demonstration of scenario analysis using
‘Situation’
Mind Genomics
allows the researcher to test many combinations of messages, not just a few
combinations repeated dozens or hundreds of times to reduce the error of
estimate, a strategy used by most other researchers. By testing many
combinations through the systematic permutation of the underlying experimental
design a valuable byproduct emerges [16]. That byproduct is the fact that most
of the vignettes, the combinations of messages according to design, in fact,
differ from each other. It is that degree of difference which allows the
researcher to discover the interactions.
The interactions
are discovered by a surprisingly process, of four steps:
Step 1: Create a new variable, “By”, such as ByA. The ByA variable takes on the value 1 when A=1, value 2 when A=2, the value 3 when A=3, and finally the value 4 when A=4. When the vignette has no A, the variable ByA takes on the value 0.
Step 2: Sort the database according to the value of ByA. The sort produces five distinct strata, corresponding to the five levels of ByA.
Step 3: Run a separate OLS regression relating the presence/absence of the 12 remaining elements (B1-D4) to the binary rating. The additive constant shows the expected value of the vignette with the fixed value of (A1-A4), but without any other element. The coefficients for a specific element (e.g., B1) can compare across five levels of A, ‘situation’ to show how ‘situation’ affects the specific element.
Step
4:
Look for interactions. Compare the coefficient an element in the absence of
Situation (ByA=0) to the coefficient of the same element in the presence of a
specific situation (e.g., ByA=1 or ByA=2, 3, or 4, respectively). A large
positive increase in the coefficient in the presence of a specific situation
vs. the value of the same coefficient in the absence of a situation (ByA=0) is
evidence of a synergism. (Table 7)
presents the summary data for the scenario analysis using question a,
situation, as the stratifying variable.
Typing the mind
A continuing
theme in Mind Genomics is the emergence of mind-sets. One can think about
mind-sets as ‘primaries’, such as the red, the blue and the green, of a topic.
Mind-Sets are different ways of thinking about a topic. Mind-Sets emerge from
the statistical analysis of the pattern of coefficients. The coefficients may
be thought of as the weights one puts on different pieces of information.
People with similar patterns of coefficients may be considered to think about
the topic in the same way, at least for the specifics of the topic studied in
the experiment. People with different patterns of coefficients may be
considered to think about the topic in different ways. Finally, the clustering
exercise reduces the inter-personal differences, revealed by the coefficients,
into a limited set of ‘basic’ patterns. (Table
8) shows a two-way table. The columns show the total panel and the two
complementary mind-sets emerging from this Mind Genomics cartography. The rows
show the classification by gender, by age, and by declared concern with the
environment and energy. The two mind-sets distribute in roughly equal
proportions on each classification variable.

Table 7: Summary of scenario analysis, showing how elements from Question A (Situation) interact with the remaining elements to drive the rating of recommendation.
Traditional
methods to ‘weight’ the different classification variables simply will not work
in this situation, where we deal with a micro-topic, quite specific, but in
fact quite relevant and actionable. Other Mind Genomics studies confirm the
fact that at the level where ‘action ability’ is important, the typical
segmentation simply fails, unless the segmentation is obvious. We deal here
with a typical situation, where we want to work with how people think, but only
can measure who people are. With this short introduction to the variation of
people, the question now becomes how to ‘find’ these individuals. Virtually
every Mind Genomics study suggests that it will be virtually impossible to
identify individuals knowing only who they are, such as age and gender. Most
Mind Genomics studies further suggest that it is quite unlikely to discover an
easy to use set of general questions which can predict the specific mind-set to
which a person will belong. (Vision) or Mind-Set 2 (details). The approach uses
a Monte Carlo simulation, adding random error to the data from the coefficients
for each mind-set, and assigning a respondent to the mind-set, based upon
“distance” from An approach, the PVI (personal
viewpoint identifier) has been suggested to solve the problem of assigning
new people to one of the specific mind-sets developed in a specific study
(e.g., assign a person to Mind-Set1 the average profile for the mind-set. The
approach, developed by author Gere, has been implemented in an automated
approach. The output of the PVI is simple set of six questions, and a 2-point
scale. (Figure 1) shows a screen
shot of the PVI created for this study. The PVI algorithm identifies the six
questions, which are six of the 16 elements in the study, ensuring that the PVI
assigns a new person to the mind-sets uncovered by this study. The respondent
answers, shown on the right side, are selected by the researcher, and can be
changed, when the response terms are fundamentally NO or YES, respectively.
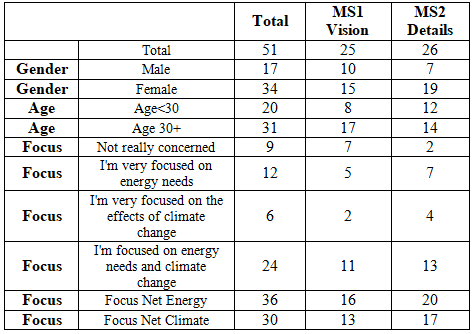
Table 8: Distribution of
respondents by gender by age and by self-declared focus on energy and
environment.
The PVI requests
both information about the respondent as well as presenting the six questions,
as of this writing (winter, 2020) the PVI can be found at this site: https://www.pvi360.com/TypingToolPage.aspx?projectid=122anduserid=2018

Figure 1: The PVI (personal viewpoint identifier) created for this study.
Study
2-Beyond attitude to economics
In the second experiment a new set of 51 new respondents participated, (15 males, 35 females; 32 age 23-39, 18 age 40-71). The Mind Genomics test experience was parallel, except for the rating scale. The respondent was presented with the systematically varied vignettes, but this time were instructed to assign a rating to reflect how much they felt a share of the stock would be, if the vignette reflected the stock. The respondents were given a 9-point scale, with the anchor point 1 corresponding to $0, and the anchor point 9 corresponding to $100. The respondent assigned a single rating, which was converted to dollar value, following a linear transform: 1=$0, 2=$12.50, 3=$25, 4=$37.50, 5=$50, 6=$62.50, 7=$75, 8=$87.50, 9=$100. OLS (Ordinary Least-Squares) regression, done at the level of the respondent, estimated the 16 coefficients of the model relating the presence/absence of the elements versus the dollar value. Once again, the experimental design allowed for the individual-level modeling. The additive model did not have a constant based on the rationale that in the absence of message, no one would know what the stock is about. The clustering to find groups was once again conducted on the coefficients, this time based first on the coefficients from the dollar value, and then second based on the coefficients from Consideration Time. The age groups were slightly different in Study 2 because the focus in Study 2 was on older respondents.
Results-Models
based on dollar value as the dependent variable (Study 2): Table 9 shows the
coefficients for the models looking at the linkage between dollar value and
presence/absent of the elements. Each element has seven columns of numbers one
column for each group as defined either by the self-profiling questionnaire
(age, gender) or by the clustering using the dollar values of each of the 16
messages. (Table 9) suggests that
for economics-based response scales, such as dollar value, there is relatively
little difference in the pattern of coefficients among the different
self-defined subgroups. Across groups there are a few elements which drive the
price higher (higher coefficients), and elements which play no role
(coefficients near 0) People think alike.
There may be
differences of $5 to $7 for the same element across groups, but little else.
One of the continuing findings of Mind Genomics is that ‘homo economicus’,
economic man, is much more homogeneous than ‘homo emotionalis,’ feeling man,
people divided by how they feel about a topic. Instruct people to act like
objective measuring instruments, and they respond differently, with a more
constrained, more ‘accurate’ or at least more ‘considered’ rating. Big group
differences emerge with mind-sets based upon patterns price for the different
elements. We are not talking about one group willing to pay more than another
group, but rather about patterns. Mind-Set 3 focuses on the specifics. Mind-Set
4 focuses on the benefits to the state and its people, on what the power will
accomplish.
Results-Segmentation based on Consideration Time (Study 2): We finish the data analysis with segmentation based upon consideration time. We often think of consideration time in terms of simple processing and assume somehow that there is a link between what is processed by reading, and what becomes the focus of attention. Can we uncover different ‘mind-sets,’ based not on the content of the messages, the usual approach, but rather based upon the pattern of Consideration Times? We did the same analysis, this time for consideration times, focusing on Study 2. (Table 10) shows the set of response times for who the respondent IS (total, gender, age), but also how long it takes the respondent to process the information. Mind-Sets 5 and 6 shows the emergence once again of two mind-sets, one focusing on process (needs and what to do), the other focusing on benefits to the population.
Discussion
The wind power lesson: From the hypothetico-deductive to the cartographic and
inductive: The
literature in public relations about measuring attitudes is almost beyond
measure. Public opinion is a temptation for one to sway the any aspect of life
where people are free to spend their money and time. The world of today is
awash with causes, with organizations set up to ameliorate the problems, and
with the funds and willpower to sway public opinion towards their own ends. Traditional
polling asks simple questions, obtains simple answers, and presents these as
stand-alone facts. Pollsters focus on the representativeness of their samples,
on the execution of the poll, with the assumption that the poll questions are
correct. To pollsters, and
indeed too many political analysts, it is the correct sample, the correct
execution, the non-biased question, respectively, which is of interest. The
Mind Genomics approach to the sustainability issue of wind power goes far
deeper into the issue than typical polls. As the approach presented here shows,
the issue of wind power is not simply a question of whether one approves of the
technology to help the state of Texas. Rather, it is the different aspects of
the story of Texas’ need, the solution provided by wind power, what must be
done which must be disentangled, and evaluated against each other in novel
combinations.
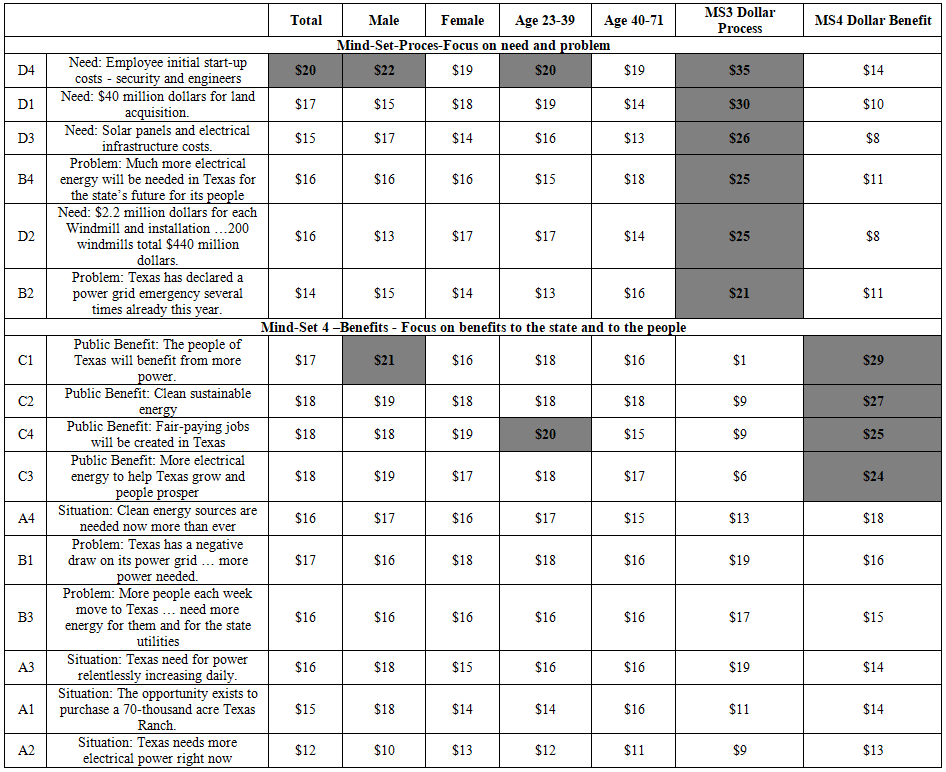
Table 9: Relation between element, and coefficient representing dollar value.
Doing so ensures
that a compound or complex story, such as wind power to help a state, does not
produced biased results because one part of the story moves in one direction
(e.g., positive) does not suppress or hide another part of the story moving in
the opposite direction (e.g., negative). The strategy of mixing and matching
parts of the story, along with alternatives, gives a sense of the dynamics of
the issue. What continues to surprise in the Mind Genomics effort is the
emergence of new mind-sets, different patterns of responses to the same
element, along with the radically different response patterns. Most pollsters
and researchers will readily admit that the human condition leads to different
ways of thinking about a problem. At the same time, however, it seems to have
been virtually impossible to understand these different ways of thinking about
a problem, except in the most obvious of cases. Mind Genomics opens up these
differences.
Coda-The Science of the Every Day
A great deal of today’s
science follows a prescribed path of placing one’s research into the matrix of
previous studies, then developing a hypothesis, and either confirming or
disconfirming that hypothesis. In this type of spirit of inquiry, the natural
exuberance of the scientist is suppressed, in order to follow the specified
‘steps’ of an intellectual dance. New topics cannot emerge unless they can be
tied to old studies. New research must address the gaps in the literature. New
ideas must be rigorously proved. The above-mentioned set of strictures on
research, whether formally or informally imposed, would have kept the
wind-power study from being done in the first place. The literature provides no
call for unanswered questions. There are only situations to be understood. There
are no experiments to do, other than with people. And finally, there are no
grand discoveries about the mind of people, no generalities. There is simple
the science of the everyday, as unromantic as that sounds. The data from this
study, or perhaps better described the data from this cartography of the mind
for a situation, provides a sense of people in general. Thousands of these
studies, on all aspects of interest in the intersection of the environment and
energy, will likely and eventually create the knowledge base needed for the
next generations of society.
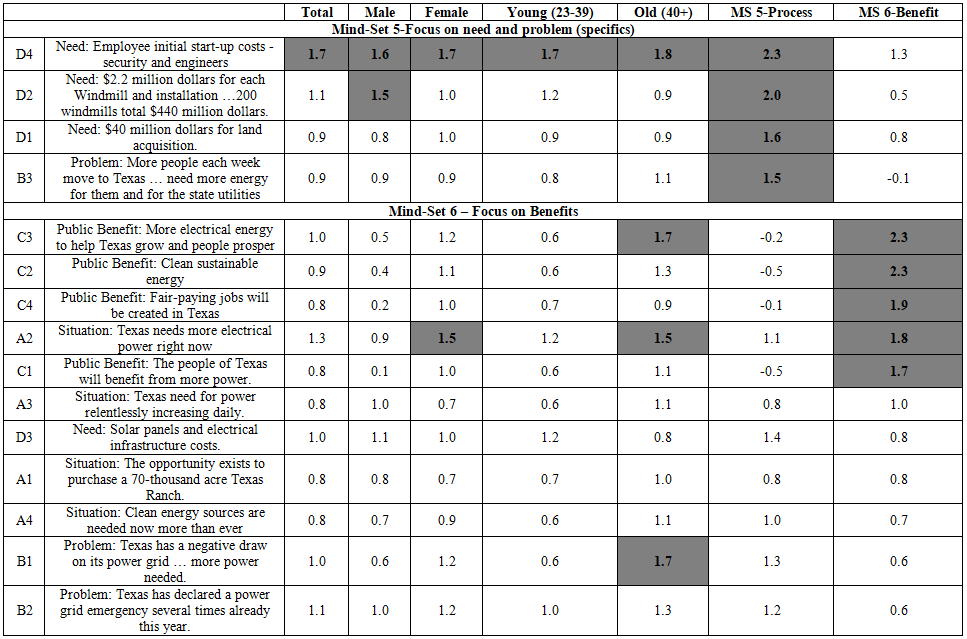
Table 10: Relation between
element, and coefficient showing Consideration Time in seconds. The data shows
the coefficients for the total panel, for gender, for age, and for two emergent
mind-sets coming from the analysis of coefficients for consideration time (aka
response time).
Acknowledgment
Attila Gere would
like to acknowledge the support of the Premium Postdoctoral Researcher Program
of the Hungarian Academy of Sciences.
References
- Martens
P. Sustainability: science or fiction? (2006) Sustainability: Science, Practice
and Policy 2: 36-41.
- Szarka
J. Wind Power in Europe: Politics, Business and Society (2007) Palgrave
Macmillan, United Kingdom.
- Onat
N and Bayar H. The sustainability indicators of power production systems (2010)
Renewable and Sustainable Energy Reviews 14: 3108-3115 https://doi.org/10.1016/j.rser.2010.07.022
- Bell
D, Gray T, Haggett C and Swaffield J. Re-visiting the ‘social gap’: public
opinion and relations of power in the local politics of wind energy (2013)
Environmental Politics 22: 115-135. https://doi.org/10.1080/09644016.2013.755793
- Guo Y, Ru P, Su J and Anadon LD. Not in my backyard, but not far away from me: Local acceptance of wind power in China (2015) Energy 82: 722-733. https://doi.org/10.1016/j.energy.2015.01.082
- Chabowski
BR, Mena JA and Gonzalez PTL. The structure of sustainability research in
marketing, 1958-2008: a basis for future research opportunities (2011) Journal
Academy Marketing Science 39: 55-70. https://doi.org/10.1007/s11747-010-0212-7
- Moskowitz
HR. Mind Genomics’: The experimental inductive science of the ordinary, and its
application to aspects of food and feeding (2012) Physiology and Behavior 107:
606-613. https://doi.org/10.1016/j.physbeh.2012.04.009
- Moskowitz
HR, Gofman A, Beckley J and Ashman H. Founding a new science: Mind Genomics
(2006) Journal Sensory Studies 21: 266-307. https://doi.org/10.1111/j.1745-459x.2004.00066.x
- Moskowitz
HR, Gofman A, Itty B, Katz R, Manchaiah M, et al. Rapid, inexpensive,
actionable concept generation and optimization: the use and promise of
self-authoring conjoint analysis for the food service industry (2001) Food
Service Technology 1: 149-167. https://doi.org/10.1046/j.1471-5740.2001.00021.x
- Dubes
R and Jain AK. Clustering methodologies in exploratory data analysis (1980)
Advances in Computers 19: 113-238. https://doi.org/10.1016/s0065-2458(08)60034-0
- Reichig
L, Gere A, Papajorji P, Shelley R, Starke S, et al. Prospects for students as
students see them: A Mind Genomics Exploration (2019) Ageing Science and Mental
Health Studies 3: 1-12.
- Boring
EG. History of experimental psychology (2008) Genesis Publishing Pvt Ltd,
India.
- Kristjánsson
A and Egeth H. How feature integration theory integrated cognitive psychology,
neurophysiology and psychophysics (2019) Attention, Perception and
Psychophysics 82: 1-17. https://doi.org/10.3758/s13414-019-01803-7
- Suchotzki,
Kristina, Verschuere, Bruno, Bockstaele V, et al. Lying takes time: A
meta-analysis on reaction time measures of deception (2017) Psychological
Bulletin 143: 428-453. https://doi.org/10.1037/bul0000087
- Thomas
AR, Pop NA, Iorga AM and Ducu C. Ethics and Neuromarketng: Implications for
Market Research and Business Practice (2016) Springer. https://doi.org/10.1007/978-3-319-45609-6
- Moskowitz
HR, Gofman A, Itty B, Katz R, Manchaiah M, et al. Rapid, inexpensive, actionable
concept generation and optimization: the use and promise of self-authoring
conjoint analysis for the food service industry (2001) Food Service Technology
1: 149-167. https://doi.org/10.1046/j.1471-5740.2001.00021.x
*Corresponding author
Howard Moskowitz, Mind Genomics Associates, Inc., White Plains, New York, USA, E-mail: mjihrm@gmail.comCitation
Moskowitz H, Thistle JD, Ortega G, Aber J and Gere A. Communicating to drive sustainability-a worked example with wind power (2020) Edelweiss Appli Sci Tech 4: 19-32.Keywords
Wind-power, nuclear energy, economic sustainability
and electrical power.
