
 PDF
PDF
The World Today
This paper grows out of a 52-year personal history by the
author, beginning at Harvard University in psychophysics (the study of the
relation between physical stimuli and subjective responses), and moving on to
the world of sensory testing of products, and finally (thus far) evolving to
consumer research, applied sensory analysis of foods, and finally product
optimization and the creation of new consumer products.
In the author’s opinion a great deal of the issue involving
base size emerge from the discussions of the conflict-attracting topic of
discrimination, all-or-none judgments, the controversy between significant at a
statistical level and significant at a ‘meaningfulness’ level. The notion of
‘significant differences’ comes from the rather extensive discipline of
inferential statistics, fertilized by the practical issue of ‘what is the right
answer?’ Discussions of base size focus on answering the simple question ‘Is A
different from B’, whether different means better vs the not better,
perceptibly different vs not perceptibly different,’ and so forth. The issue is
whether the data suggest ‘signal’, or really just noise without signal. The
origins of this thinking come from the belief that the job of the human judge
is to act as a’ rather blunt instrument’, in the words of Nestle’s Director of
Marketing Research, Frederic Nauckoff (personal communication to the author,
2010).
The problem of today’s research literature can be traced, in
part, to the failure to focus on ‘why’ one needs a certain base size. Is the
issue the ability to reach the ‘right answer,’ and the implications of number
of measurements needed to get to that ‘right answer’ viz, same vs different,
larger, smaller, etc. In such a world there IS a right answer. The research
objective is to reproduce that right answer and be confident about it. The
search for patterns as perceived when the respondent evaluates different
products, calls into play a set of different issues. No longer is the attempt
to get the right answer,’ but rather to identify a pattern necessary for
product development. The pattern may emerge when the respondents scale the
degree of liking, or provide input for ‘mapping’ the products on a
multi-dimensional map [1,2].
In the opinion of this author, when the focus is guidance
for development, the issue of base becomes one of stability of patterns. It is
the pattern which guides the developer, rather than the individual data point.
Patterns often emerge with as few as 10 judgments per point, such stability
emerging when the study is a so-called ‘within-subjects design,’ where every
respondent evaluates every stimulus. When the focus changes, so that the
precision of measurement for a single point becomes important, then the topic
of base size becomes important. The reason for the test is not guidance, and
thus the issue is not the stability of the pattern. Rather, the issue is ‘when
is sufficient, enough’ when the topic is the measurement of one or two points
to make all or none statements, such as same/different, better/worse, and so
forth. In such situations, it become statistically evident that ‘more people
mean greater likelihood of a correct answer’ but the question remains ‘how many
are enough? [3,4].
The two worlds, forward-looking as in the case of
development versus backwards-looking in the case of a binary decision to be
made, emerge from different orientations to and different thoughts about, base
size. The issue of base size plays a minor, almost irrelevant role in the
former (development), and a pre-eminent role in the latter (testing for
signal).
Roots in Psychology: The Migration to Numbers from the Informal Beginnings
Those who are familiar with the history of psychology on the
one hand, and with the history of sensory research on the other will no doubt
recognize that over the years the research has migrated from observing to
testing, from reporting to analyzing through statistics, from looking at
patterns to looking at points.
The evolution in the science of psychology and sensory
analysis, and the change from observation and report to test, comes from the
subtleties of an evolving science, and at the same time, the demands from
brutal economic considerations imposed by business need. More than two thirds
of a century ago sensory analysis began to evolve, having no formal procedures,
but inevitably metamorphizing into descriptive analysis, yet absent the
recognition of what statistics could possibly provide (e.g., the Arthur D.
Little Flavor Profile [5]. Three decades later, descriptive analysis would
incorporate statistics (QDA, Quantitative Descriptive Analysis) [6], indeed
making inferential statistics a cornerstone. The underlying world-view of
sensory analysis is that people differ from each other, and act as sources of
random variation.
In typical practice, sensory analysis focused on the value
of single points, sensory attribute levels of products, perhaps for comparison
purposes against each other, or against a ‘gold standard.’ In this situation
the issue of ‘how many respondents should participate’ become relevant because
the need is for an accurate measure of a single percept, the level of a sensory
attribute in an in-market product or product prototype in-development. The
appropriate base size is the one which lets the true description emerge. It is
not an issue of base size per se as something holy, but rather the appropriate
number of judges and/or judgments sufficient to average out the random
variation in the data, an inevitable concomitant of error.
When we look at a parallel science, psychophysics, the study
of the relation between stimulus and perception, we find the same evolution.
Psychophysics was always numerate, dealing with numbers, with patterns, and
with equations. The issue was not base size, since in the mind of the
psychophysicist even one respondent suffices to reveal the relation between the
stimulus and the percept. To the psychophysicist, the issue of base size, the
number of respondents, is simply one of using a number of observations in order
to cancel out random variation, and thus better approximate the true underlying
function.
The evolution to numbers is not only the history of sensory
analysis. It is the history of psychology. The early work did not use numbers,
except perhaps to describe the personal patterns, the personal equation [7]. Numbers
would emerge, but primarily to quantify behavior, to show differences, to show
patterns. For many of the early studies, the focus was on relations between
variables, on the right answers. There were, of course issues with whether the
phenomenon being observed was real, but those issues were generally addressed
by careful control of the test environment, and of course by replication in
other laboratories. Indeed, it is probably the ability to replicate the repeat
the study and get the same result, which is important.
We can say, therefore, that the early history of sensory research and of psychology may have used numbers, but it was numbers, and not statistics. There was no notion of sampling distributions, or if there was, there was no notion of testing groups against each other. The goal was to discover nature, not to show differences in effects. The scientists were cartographers of the mind, of taste preferences, but not statistically based, at least not in the way to which we have become accustomed [8].
The Clash between the Idiographic and the Nomothetic
One of the fundamental ideas in science, especially
psychological science, is the difference between the study of the individual,
idiographic, and the study of the group, the average, nomothetic. Those who are
afficionados of the history of science can read about this clash, but it only
happens at the start of the 20th century. Before that, the science was the
observation of the individual. Certainly, people took averages, but the focus
was not so much on the statistics as on the process. No one tested
significance, departures from a true ‘zero,’ and so forth. Taking the average
meant simply a better estimate of the central tendency. It was the measure of
the item, the thing, the event, the process, which was important, not the
variance.
Over time, and with the measurement of sociology and
cross-sectional behavior, the issue of base size and numbers became
increasingly important. Whereas one might do research on the ‘society’ of a
single family, an increasing number of ‘projects,’ i.e., the intellectual
efforts, were focused on the behavior of many people. The idea was not to look
deeply at the individual behavior through various circumstances, a longitudinal
view, but rather to look at the behavior of many individuals, sampled at one
point in their lives responding or behaving. The random variation was there. It
was no longer a matter of suppressing noise through careful control, but
letting the underlying patterns emerge by averaging. Psychologists were looking
for interpretable individual patterns, and underlying laws of behavior.
Sociologists were looking for emerging signals, those signals emerging from an
inherently noisy background, and descriptive patterns, not necessarily laws.
The introduction of ‘notion of ‘cross section’ means that
the patterns come from disparate organisms. The organisms, the behaving
individuals, each exhibit some aspect of the behavior being studied, but at the
same time manifest a great deal of other behaviors, behaviors that we would
rightly call ‘noise’ or extraneous variability. This extraneously variability
is part and parcel of the world of the subjects, whose ideas and behavior are
being studied.
How then does one measure what is relevant, in the light of
this cross-sectional variation from person to person? Experimentation allows
the research to suppress the variability, so that eventually only the variable
of interest emerges. The other variability is suppressed by careful controls,
by picking the appropriate respondent, by ensuring that all test conditions
match except where the variable must play a role. Experimenters can do that
easily, at least in theory, although in practice it might be a totally
different story.
Moving to Foods-Sensory Versus Hedonic
Anyone who observes shopping or eating knows almost
immediately that we may taste things in a similar way, but some of us like
certain flavors, whereas others hate the same flavors. The language of food and
drink begins with the expression of hedonics, like and dislike, and only then
proceeds to the description of that which is. One might feel that to get the
‘right answer’ it is more important to have a large base size when it comes to
hedonics, but one can do as well with a smaller base size when it comes to
sensory processes. That conjecture is certainly reasonable, and has eventuated
in prescriptions such as claims tests for the NAD which require a base size of
300 people), and policy by some journals that papers dealing with hedonics
should have at least 100 respondents [9].
When we deal with the issue of likes, the question of base
size become extremely important, if not for science, then for policy. How do we
establish the requisite base size for hedonics? What operational definitions do
we use to define the minimal number of respondents? The question is deeper than
might seem at the start. In commercial studies designed to show preference of
one product versus another, one might say that one product is preferred to
another at a statistically significant level when the preference ratio is 52/48
with 100 people. Yet the same level of statistical significance can be achieved
with (50.3/49.7) by simply increasing the base size, albeit dramatically.
The focus on the base size, the number of respondents,
becomes increasingly important when the measurement that we make leads to a
decision with consequences, such as action steps. Such a situation occurs when
we measure the degree of liking of a product, not so much for science, as for
business. When we ‘know’ by experience that products with a low level of
acceptance, below some cutoff, are losers in the market, and consequently end
up wasting the resources and time of the company marketing them, one can quite
sure that the company wants to know just how well the product scores. Not so
much for the information content, which is nice, but rather to know whether the
product is likely to succeed (good, will probably make money), or is likely to
fail (bad, will probably drain money).
When the issue is economic or of similar import, base size
is important. We want to measure acceptance with a great deal of certainty. We
know that the error around the mean decreases with the square root of the base
size. Go from 10 people to 40 people, a quadrupling of the base size, and the
precision of the mean increases. There is just less variability in the means or
averages when we repeat the study with different groups of 40 than different
groups of 10. Increase the base size from 40 to 360, an increase of 9, and we further
decrease the variability by a factor of 3, so we are even more precise.
The topic of base size in decision making has been addressed in the world of food research, not so much from the point of view of a scientific issue as from the point of view of a business issue, where the decisions have business consequences [10-12].
Side Issues and Base Size
What is Our Goal – Knowledge of Patterns or Accuracy of a Single Point Estimate?
If we were to summarize the issue of base size in the world
of sensory and consumer research, we might well come down to the simple
question of what are we going to do with the data? If we are looking for
patterns, we get the most amount of information from the first rating of many
stimuli. Each additional rating moves the mean by a value of 1/n where n is the
number of previous ratings of the stimulus.
If we are interested in whether we have a stable mean, then
there is no perfect base size in and of itself. There must be an external
criterion which imposes a penalty. In previous papers the author has suggested
that one do an experiment, either with a set of physical products, or with a
set of concepts that have been systematically varied according to an
experimental design.
An operational way, albeit not one blessed by statisticians
but yet intuitively attractive, is to discover where the ‘pattern believed to
be ‘true’ breaks down. One begins with the pattern of means or averages from a
group of test stimuli, eg., ratings of a set of products on overall liking,
from a panel of respondents. ‘Truth’ is defined by the pattern of the means
from the total. One can then take portions of the data, such data provided by a
proportion of the respondents, compute the means, and compare the averages from
this smaller group to the average obtain from the total panel.
With a set of products or concept elements, usually great than four or five, one can plot the averages from the decreasing-sized panel to the total panel, to determine when the pattern ‘breaks down.’ Figure 1 shows an example. The research can do the same exercise many hundreds of times to get a sense of the fraction of respondents at which the pattern breaks down, although ‘break down’ is a subjective decision. It becomes a matter of when the pattern ceases to be informative.
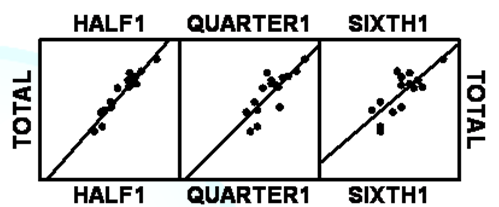
Figure
1: The pattern of 16 means for 120
respondents (Total), and how that pattern changes when a random group of 60
respondents, another of 30 respondents, and another of 20 respondents, is
selected and the means recalculated.
Implication for the ‘Project of Science’
With the growing popularity of
statistical inference, we see jumping to the forefront of consideration issues
regarding accepting a hypothesis when actually untrue, or rejecting a hypothesis
when actually true. Indeed, it would be remiss if we did not call out the
almost obsessive focus on base size by reviewers of submitted papers, the focus
being more on the base size than on the science.
Karl Popper’s notion of the ability
to ‘falsify’ one’s guesses about nature as key to the science project is not
something to be rejected, but rather something to be considered in terms of
what we are really doing [15]. When one reads the scientific literature, one is
struck by the pervasiveness of the hypothetico-deductive method, and either the
acceptance or rejection of the hypothesis based upon rigorous statistics. The
base size is often large, usually resulting from the desire of the researcher
to ‘show an effect.’ What is lost, again and again in these studies is the
informative nature of patterns, trends, suggestions. Those patterns do not need
the requisite base size to be proved. We are looking at the nature of ‘signals
from nature,’ and not a just yes or no. In the end, all the consideration of
base size should be to answer the question ‘Is the pattern from nature
sufficiently stable to suggest what is happening?’
Recommendations to the Practitioner
Product development looks for
patterns, not differences. The product developer needs to know what to do, not
whether the results of what have been done suggest a meaningful change. The
product developer needs knowledge at the start of the process to guide changes,
not the report of the blunt instrument that a change has been detected. When considered
in this perspective, guidance versus effect, forward-looking versus
backward-looking, the issue of base size evaporates as a relevant issue when
the focus is guidance. The issue of base size may remain relevant when the
focus is assessment, rather than guidance.
If there were to be a
recommendation(s) to the reader, it would be quite simply that one should take
into account the use to be affected by the base size. When the answer sought is
a simple Yes vs No, without interest in the nature of the underlying patterns,
which themselves cannot be ferreted out anyway, then the literature’s
recommendations are fine, or perhaps better said, what the reader accepts from
the literature will be acceptable. It is a matter of tolerance of error in the
judgment.
When, however, the issue is base in the search of patterns, then the reality is that the pattern emerges with the first judgment, albeit with error, and the pattern then becomes stable with many more judgments. How many more judgments are recommended? The answer starts from a low about 10, simply because it’s likely for error to cancel out, at least in psychophysical research. By the time the researcher has reached 25 respondents, all of who are testing a graded series of test stimuli, the relation between rating and underlying physical level should become quite stable. A group of 50 respondents is probably luxurious. Beyond these numbers, the research should also keep in mind the old adage ‘the appearance of virtue is better than virtue itself.’ Simply stated, by 25 replicate ratings across different respondents the patterns are stable. By 50 replicate ratings across different respondents, the emotions of the researcher toward the ‘validity’ of the patterns in turn become stable.
References
- Vidal L, Caden RS, Antùnez L, Giménez A, Varela P, et al. Stability of sample configurations from projective mapping: How many consumers are necessary? (2014) Food Quality and Preference 34: 79-87. https://doi.org/10.1016/j.foodqual.2013.12.006
- Valentin D, Chollet S, Lelievre M and Abdi H. Quick and dirty but still pretty good: A review of new descriptive methods in food science (2012) Int J Food Sci & Tech 47: 1563-1578. https://doi.org/10.1111/j.1365-2621.2012.03022.x
- Baak J, Keller D, Simon I, Shleissinger M, Schurer NY, et al. Consumer panel size in sensory cosmetic product evaluation: A pilot study from a statistical point of view (2018) Journal of Cosmetics, Dermatological Sciences and Applications 8: 97-109. https://doi.org/10.4236/jcdsa.2018.83012
- Carabante KM and Prinyawiwatkul W. Serving Duplicates in a Single Session Can Selectively Improve Sensitivity of Duplicated Intensity Ranking Tests (2018) J food sci 83: 1933-1940. https://doi.org/10.1111/1750-3841.14194
- Caul JF. The profile method of flavor analysis. In Advances in Food Research (1957) Academic Press 7: 1-40. https://doi.org/10.1016/S0065-2628(08)60245-1
- Stone H, Sidel J, Oliver S, Woolsey A and Singleton RC. Sensory evaluation by quantitative descriptive analysis (2008) Descriptive Sensory Analysis in Practice 23-34. https://doi.org/10.1002/9780470385036.ch1c
- Pearson KV. On the mathematical theory of errors of judgement, with special reference to the personal equation. Philosophical Transactions of the Royal Society of London. Series A Containing Papers of a Mathematical or Physical Character (1902) 198: 235-299. https://doi.org/10.1098/rsta.1902.0005
- Stevens SS. Psychophysics: An Introduction to its Perceptual, Neural and Social Prospects (1975) Wiley, New York, USA.
- Hough G, Wakeling I, Mucci A, Chambers IVE, Gallardo IM, et al. Number of consumers necessary for sensory acceptability tests (2006) Food Quality and Preference 17: 522-526. https://doi.org/10.1016/j.foodqual.2005.07.002
- Dus CA, Rudolph M, and Civille GV. Sensory testing methods used for claims substantiation. In Cosmetic Claims Substantiation (1997) CRC Press 227-276.
- Gacula Jr M and Rutenbeck S. Sample size in consumer test and descriptive analysis (2006) J Sensory Studies 21: 129-145. https://doi.org/10.1111/j.1745-459X.2006.00055.x
- Moskowitz HR. Base size in product testing: A psychophysical viewpoint and analysis (1997) Food Quality and Preference 8: 247-255. https://doi.org/10.1016/s0950-3293(97)00003-7
- Rousseau B. Sensory discrimination testing and consumer relevance (2015) Food Quality and Preference 43: 122-125. https://doi.org/10.1016/j.foodqual.2015.03.001
- Stevens SS. Personal communication to Howard Moskowitz (1966).
- Grünbaum A. Is falsifiability the touchstone of scientific rationality? Karl Popper versus inductivism. In Essays in Memory of Imre Lakatos (1976) Springer 213-252. https://doi.org/10.1007/978-94-010-1451-9_16
*Corresponding author:
Howard Moskowitz, Mind Genomics Associates, Inc., White Plains, New York, USA, E-mail: mjihrm@gmail.com
Citation:
Moskowitz H. Food and drink: thoughts on base size in sensory and consumer research (2020) Edelweiss Appli Sci Tech 4: 37-40.
Keywords
Food, Psychology, Psychophysics.
