
 PDF
PDF
Introduction
Stock market efficiency is an
essential property of the market. The classic paradigm of Efficient Market
Hypothesis (EMH) was widely accepted since the early 1970’s and is based on three
essential pillars such as investor rationality, uncorrelated errors, and the
assumption that there are no limits to arbitrage. According to [1] the ideal
financial market would be guided by the principle that prices provide accurate
signals for resource allocation. It implies that rational, profit-maximizing
investors are not able to consistently outperform the market since prices of
stocks in the market are fair, that is, there are no undervalued stocks in the
market. Price shocks also are an integral part of the stock market. The flow of
news is continuous and practically infinite, and from time to time some of them
may be very influential for a given stock, a group of stocks or the stock
market in general, and lead to large stock price changes, representing both a
serious risk and a great opportunity for stock market investors.
A vast strand of financial
literature deals with large one-day stock price changes and their consequences.
The major research question of these studies is: What are the patterns of stock
returns following index market changes and can we predict these returns to
build a profitable investment strategy? The answers to this question vary as a
function of the samples analyzed by the authors and the research approaches
applied by them. A few studies [2-5] document price reversals following initial
price moves, and therefore, suggest that the latter contain some element of
overreaction. Another cohort of studies either does not detect any significant
price patterns following major price changes [6,7] or finds some evidence of
reversals, but concludes that they are relatively small and cannot be
practically used for generating
profitable investment opportunities
[8-10]. The third influential group of studies [11-14] suggests that large
stock price moves should be analyzed in a wider company-specific context, and concentrates
on the role of public information in determining subsequent price patterns. The
general conclusion arising from this literature is that stock price moves
accompanied by public information releases result in price drifts, indicating
that investors tend to underreact to news about fundamentals, while those that
are not accompanied by any public news are followed by reversals, suggesting
that investors tend to overreact to other shocks that move stock prices, such
as shifts in investor sentiment or liquidity shocks.
The holiday effect is one of the
most widely analyzed calendar anomalies in stock markets. Its best-known aspect
refers to the observed fact that stock returns typically exhibit consistent
patterns around holidays, with systematically higher returns on days prior to
major holidays. The holiday effect is well-documented both in the US [15-17]
and worldwide [18-21] stock markets. The dominating explanation for the
existence of the holiday effect lies in investor psychology [17,22] suggesting
that investors tend to buy stocks before holidays because of ‘high spirits’ and
‘holiday euphoria’ [23,24] which cause them to
expect positive returns in the sequel. In recent empirical studies on calendar
anomalies or seasonal anomalies revealed that some of the calendar anomalies
like day of the week effect [25] month of the year effect and turn of the month
effect seem to have weakened or disappeared over the sample time period. To
test the existence of the holiday effect in the Vietnamese stock market, the
study is based on the daily return rate data sample of the VN-Index from March
1st, 2002. The period before Lunar New Year is defined as 5 trading
days before the market closes for Lunar New Year holiday. Similarly, the period
after the Lunar New Year is defined as 5 trading days after the Lunar New Year
holiday when the stock market is active again. The difference in the return on
indices in the period around the Lunar New Year compared to the rest of the
trading days is the basis for testing the existence of the Lunar New Year
effect on the Vietnamese stock market. This study uses the following
quantitative data analysis methods: basic descriptive statistical method,
Generalized Autoregressive Conditional Heteroskedasticity (GARCH).
Literature Review
The holiday effect is one of the
seasonal phenomena and this phenomenon presents a contradiction with the
efficient market theory an important financial hypothesis. Seasonal phenomena
can be understood as seasonal effects that produce either higher or lower
returns depending on the nature of the time series. These effects are also
known as market anomalies because these anomalies cannot be explained by
traditional asset pricing models. Examples of some popular effects such as
January Effect, Day-of-the week Effect, Turn of the month Effect, holiday
effect.
The holiday effect was first
identified by [26] since then there has been much debate about the effect of
the holiday. [27,15] show in their in-depth studies that pre-holiday returns
are higher than post-holiday returns. Unusual returns were found not only over
the weekend but for any given moment of trading. Lakonishok and Smidt even
pointed out that the holiday effect accounted for about 30-50% of the total
return on the US market in the early 1987. Ariel showed that pre-holiday
returns were eight times higher than post-holiday returns. He found that 8
public holidays per year accounted for 38% of total annual return rate. [16,17]
also found that the US holiday affected market indices from the New York Stock
Exchange, AMEX and NASDAQ from 1963-1987 and 1987-1993. Many other scholars
have also analyzed, have taken a closer look at stock returns both before and
after each holiday. Their research has shown differences in holidays in
countries other than the US (Canada, Japan, Hong Kong and Australia [28] Turkey
[29,30].
Cadsby and Ratner have studied the
holiday effect in international markets [28]. They observed Canadian, Japanese,
Hong Kong and Australian markets from 1962 to 1989 and examined local holidays
and market indicators from each country. The results point to a significant
pre-holiday effect in all observed markets, with highest returns occurring in
the days before the holiday. Kim and Park provided further evidence of the
holiday effect in research on the Nikkei (Japan) and the Financial Times (UK),
confirming the results of Cadsby and Ratner for the Japanese market.
Subsequently, [16] also noted an effect of the size of firms in these markets [18]. Examined the validity of vacation in 17 markets in
different countries. Their results show a clear 65% effect at the pre-holiday
in the observed samples. Studies in Southeast Asia [31,28,32,33,34] have
identified the presence of a New Year effect in China. [33] find evidence that
stock yields of post-holiday are significantly higher than pre-holiday in Hong
Kong, Japan, Malaysia, Singapore, Korea and Taiwan. [31] determined that both Chinese New Year and Ramadan's holiday had an
impact on the Kuala Lumpur stock market; [34] confirmed
the impact of the Chinese New Year on Thailand, Singapore and Malaysia markets
along with the Hindu holiday effect in Singapore and Malaysia.
Worthington [19] examined the
holiday effect in the Australian market and concluded that the holiday effect
is limited to small firms. He used 12 different stock indices in the Australian
stock exchange over a 10-year period (1996-2006) providing 2,635 observations
on the Australian Stock Exchange (ASX). His experiments showed that the holiday
effect in market representation indices with stock returns before vacation is
often 5 times higher than on other normal days. His research shows that the
performance of small-cap companies before the holiday, and for small-value
stocks, returns 10 times higher than on other trading days. The main
explanations of the holiday phenomenon are explained in detail according to the
following hypotheses of the efficient market theory. Firstly, it can be
explained by the investment psychology. Arguably the most promising explanation
for the holiday effect lies in investor sentiment [17,22]. The theory shows
that investors tend to buy stocks before the holiday because of “being in good
shape” and “holiday excitement”. Secondly, it can be explained by the end of
the transaction. One possible explanation is that high pre-holiday returns are
an expression of good closing prices, where high returns on stocks are observed
at the closing market. One research team linked pre-vacation activity to the
system models in the data set used to calculate pre-holiday returns. On the
behavior side, the explanations include from short-term sellers who end up risk
before the holiday, with psychological reasons such as investors' good
sentiment around vacations showing more optimism about the future.
Data’s and Research Methodology
To test the existence of the Lunar New Year effect in the Vietnamese stock market, this study has collected the data of the VN-Index from March 1st, 2002 to the end of 2018. The research chose the starting time of the data set is 2002 because the first 2 years (from 28/7/2000 the liquidity of the Vietnamese market is still low, there are only 3 transaction per week and the value of the transaction is low). The VN-Index daily closing price data was collected from March 1st, 2002 to December 31st, 2018, for a total of 4190 observations from the Ho Chi Minh City Stock Exchange. The VN-Index daily data is used to calculate the daily rate of return by using the following formula:
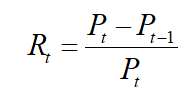
Including
Rt is stock return from day t-1 to
day t
Pt is closing price at
day t
Pt-1 is closing price at
day t-1
This study stipulates that the
period before the Lunar New Year is 5 trading days before, and the period after
the Lunar New Year is 5 trading days after. Since the Lunar New Year will take
place according to the repetitive rule of late January, early February, and
late February, if a longer observation range such as 15 days is used, it may be
affected by the January Effect. This study will apply the GARCH model (1,1) and
its extended models, and consider these models under the student-t
distribution. Similar models are applied by many previous studies such as that
of [15,26,34]. The GARCH (1,1) model will be developed to estimate the
coefficients of the variables and evaluate the significance of each
coefficient.
The model GARCH (1,1) in this study has the following equation
Expected equation
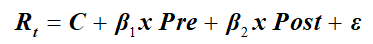
Including
Rt is the rate of return of the VN-Index
C is a constant, equal to the rate
of return on regular trading days
Pre is a dummy variable that takes
value of 1 for the period of 5 business days before the Lunar New Year holiday
and 0 for the remaining trading days.
Post is a dummy variable that takes
value of 1 for the period of 5 business days after the Lunar New Year holiday
and zero value for the rest of the trading days.
ε is the error (remainder) of the
regression model.
Variance equation
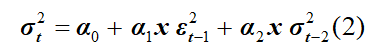
Including
α0 is a constant
Ɛ2t-1 Gives information about the
previous time fluctuation determined by squaring the error (remainder) from the
expected equation. (ARCH term)
σ2t-2 is the predictive variance in
the previous period (GARCH term)
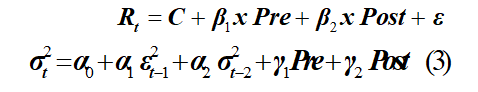
The Modified-GARCH (1,1) modified GARCH model adds the
impact of the pre- and post-Lunar New Year periods to the variance equation by
adding dummy variables Pre and Post. The Modified-GARCH (1,1) model looks like
this:
Next, to observe the relationship between the return and the respective risk, the variance σ2t-2 is added to the right side of the expected equation (1). The GARCH-M model looks like this
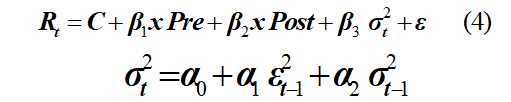
Another popular extended model of the GARCH model proposed by Nelson (1991) is the Exponential General Autoregressive Conditional Heteroskedastic (EGARCH) or EGARCH (EGARCH) model. The EGARCH model has the following equation
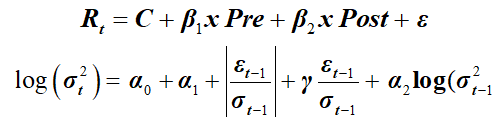
As can be seen, since log (σ2t-2)
can be negative while log (σ2t) is always positive, the
EGARCH model removes the constraints of the usual GARCH model parameters. The
study will use EViews software to apply GARCH, Modified-GARCH, GARCH-M and
EGARCH models in turn to test the existence of the Lunar New Year effect on the
stock return. After that the research compares the Akaike Info Criterion (AIC)
and Schwarz Criterion (SC) to find the most suitable model.
Empirical Result
Table 1 and Table 2 report the basic descriptive statistical results and the estimated results of the stock return as well as the periods around the Lunar New Year.

Table 1: Descriptive statistic of stock return.
Firstly, the study classified 4190
daily return of VN-Index into periods before Lunar New Year, after Lunar New
Year and other trading days. During the period before Lunar New Year and after
Lunar New Year, there are 80 observations, a total of 160 observations around
the Lunar New Year, the remaining 4030 observations of the remaining trading
days. From Table 1, the VN-Index's average daily return is 0.03680 with a
standard deviation of 1.40513 while the average return on trading days outside
the Lunar New Year period is low, it is 0.02556.
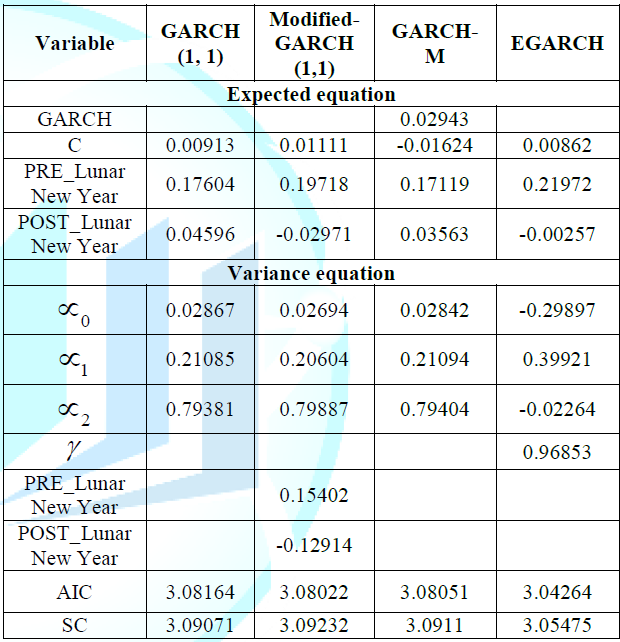
Table 2: Result of ARCH estimation.
The average daily stock return of
the 5-day period before the Lunar New Year is 0.45555, many times higher than
that of the whole VN-Index and with normal trading days. However, the deviation
of the post- Lunar New Year return rate is higher than the average for the
whole index, meaning that the risk of the post-Lunar New Year period is higher
than the average. In addition, the Lunar New Year period also brings a higher
than normal rate of return but does not come with a higher level of risk. From
there, the existence of a positive effect of the Lunar New Year period on the VN-Index
is completely grounded.
In general, through analyzing the
preliminary statistical statistics, it can initially be seen that the existence
of the Lunar New Year effect on the VN-Index is quite clear, especially in the
period before Lunar New Year. Up to this step, some previous studies such as by
Mills and Coutts (1995) have concluded the existence of a holiday effect in the
UK stock market from 1986 to 1992. However, this is also the limitation of
these studies because it will be the lack of conclusion when the stock return
data source indicators do not follow the normal distribution.
This shows that if only based on the
average return, standard deviation to conclude the existence of the Lunar New
Year effect on the VN-Index will be a major omission.
Models GARCH (1,1), adjusted GARCH (1,1),
GARCH-M and EGARCH were applied to estimate the coefficients of the rate of
return in the period before and after the Lunar New Year. Table 2 presents the
regression results on the Lunar New Year effect and the volatility of stock
returns from March 1, 2002 to December 31, 2018. To find the optimal model
among the above 4 models, we use the Akaike info criterion (AIC) and the Schwarz
Criterion (SC). These indicators are in which model the smallest value gives
the best model. We see, EGARCH model has the lowest AIC and SIC indices, so
this model is more optimal than the other models. Estimated results by EGARCH
model, the trading days outside the Lunar New Year period give a low profit
margin of 0.21972 and the positive effect of the period before the Lunar New
Year exists at 5% significance level.
The stock return after Lunar New
Year holiday was lower than other days, but it was not statistically
significant at 5%. The equation of variance with the addition of an asymmetric
coefficient value less than 0 indicates that positive effects (good news) will
cause lower volatility than negative effects (bad news). At the same time, there
is no sign of leverage effect on the VN-Index. However, the coefficient is not
statistically significant. Through the EGARCH model, this study noted the
positive influence of the period before the Lunar New Year, in other words the
existence of the Lunar New Year effect on the VN-Index.
Conclusions
Based on previous studies related to
the calendar effect, especially the holiday effect, this study examines the
existence of the Lunar New Year effect on the Vietnamese stock market through
VN-Index data from March 1, 2002 to December 31, 2018. Simple descriptive
statistics show that the stock return in the period before and after the Lunar
New Year is higher than the average of the remaining trading days. However, the
impact index of the period before Lunar New Year is statistically significant. Regression
model according to the ARCH is applied in this study.
The OLS method is the simplest and
is also widely used in previous experimental studies, but the conclusion is
inconsistent because of the existence of cointegration and variable variance of
the data series. The GARCH (1,1) model allows variance to change over time. The
Modified-GARCH (1,1) model adds the impact of periods before and after the
Lunar New Year to the equation of variance. The GARCH-M model adds a risk
factor to the regression equation. The EGARCH model removes the constraint of
parameters in conventional GARCH models. Although the above models all have
their own advantages and the regression results are quite similar, the research
selected EGARCH model as the most optimal model to publish conclusions.
Regression results from the EGARCH
model recognized the existence of a positive impact of the period before the
Lunar New Year on the stock return of the VN-Index. The results of this study
present clear evidence of the existence of the Lunar New Year effect on the
Vietnamese stock market. The emergence of a seasonal phenomenon (holiday
effect) on the Ho Chi Minh City Stock Exchange has proven ineffective in the
market, the most obvious manifestation of which is the existence of the period
around the Lunar New Year.
The stock return increased many
times compared to the average of normal trading days but not accompanied by an
increase in risk made it difficult for investors to sit still and watch.
Investors can refer to the results of this study to determine their investment
duration. Investors can take advantage of the Lunar New Year effect, buy stocks
in corrective sessions before the Lunar New Year and hold until the period
before Lunar New Year to sell when the market rallies. Short-term investors can
fully apply the strategy of buying in in the correction sessions before the
Lunar New Year and selling in the last trading session before Lunar New Year
holiday. However, investors should note that if all investors apply similar investment
tactics to take advantage of the Lunar New Year effect, this effect will
disappear and disable the above investment strategies.
Acknowledgment
Pham Dan Khanh would like to acknowledge the support of the National Economics University. This research paper is resulted of the research project at university level code KTQD/V2020.42 of the National Economics University.
Reference
1. Fama E. Efficient Capital Markets: a review of theory and empirical work (1970) The J Finance 25: 383-417. https://doi.org/10.2307/2325486
2. Zarowin P. Short-Run Overreaction: Size and Seasonality Effects (1989) J Portfolio Management 15: 26-29. https://doi.org/10.3905/jpm.1989.409209
3. Marc B and Sweeney JR. The Reversal of Large StockPrice Decreases (1991) J Finance 46: 747-754. https://doi.org/10.1111/j.1540-6261.1991.tb02684.x
4. Cooper M. Filter rules based on price and volume in individual security overreaction (1999) Review of Financial Studies 12: 901-935. https://doi.org/10.1093/rfs/12.4.901
5. Sturm RR. Investor confidence and returns following large one-day price changes (2003) The Journal of Behavioral Finance 4: 201-216. https://doi.org/10.1207/s15427579jpfm0404_3
6. Lasfer MA, Melnik A and Thomas D. Stock Price reaction in Stressful Circumstances: An International Comparison (2003) J Banking and Finance 27: 1959-1977. https://doi.org/10.1016/s0378-4266(02)00313-8
7. Mazouz K, Nathan LJ and Joulmer J. Stock price reaction following large one-day price changes: UK evidence (2009) J Banking and Finance 33: 1481-1493. https://doi.org/10.1016/j.jbankfin.2009.02.010
8. Atkins AB and Dyl EA. Price reversals, Bid-Ask Spreads and Market Efficiency (1990) J Financial and Quantitative Analysis, 25: 535-547. https://doi.org/10.2307/2331015
9. Park J. A Market Microstructure Explaining for Predictable Variations in Stock returns following large Price Changes (1995) J Financial and Quantitative Analysis 30: 241-256. https://doi.org/10.2307/2331119
10. Fehle F and Zdorovtsov V. Large Price Declines, news, liquidity and Trading Strategies: An Intraday Analysis (2003) University of South Carolina Working Paper. https://doi.org/10.2139/ssrn.298092
11. Pritamani M and Singal V. Return Predictability following large Price Changes and Information releases (2001) J Banking and Finance 25: 631-656. https://doi.org/10.1016/s0378-4266(00)00091-1
12. Chan WS. Stock Price reaction to news and no-news: Drift and reversal after headlines (2003) J Financial Economics 70: 223-260. https://doi.org/10.1016/s0304-405x(03)00146-6
13. Tetlock PC. Does Public financial news resolve Asymmetric Information? (2010) Review of Financial Studies 23: 3520-3557. https://doi.org/10.1093/rfs/hhq052
14. Savor P. Stock returns after Major Price Shocks: The Impact of Information (2012) J Financial Economics, 106: 635-659. https://doi.org/10.1016/j.jfineco.2012.06.011
15. Lakonishok J and Smidt S. Are Seasonal Anomalies Real? A Ninety-Year Perspective (1988) Review of Financial Studies 4: 403-425. https://doi.org/10.1093/rfs/1.4.403
16. Kim CW and Park J. Holiday Effects and Stock Returns: Further Evidence (1994) J Financial Quantitative Analysis 29: 145-157. https://doi.org/10.2307/2331196
17. Brockman P and Michayluk D. The persistent holiday effect: Additional evidence (1998) Taylor and Francis J 5: 205-209. http://doi.org/10.1080/135048598354825
18. Agrawal A and Tandon K. Anomalies or illusions? Evidence from stock markets in eighteen countries (1994) J Int Money Finance 13: 83-106. https://doi.org/10.1016/0261-5606(94)90026-4
19. Marrett GJ and Worthington AC. An empirical note on the holiday effect in the Australian stock market, 1996-2006 (2008) Appli Economics Letters 16: 1769-1772. https://doi.org/10.1080/13504850701675474
20. Bley J and Saad M. Cross cultural differences in seasonality (2010) Int Review of Financial Analysis 19: 306-312. https://doi.org/10.1016/j.irfa.2010.08.004
21. Dodd O and Gakhovich A. The holiday effect in central and eastern european financial markets (2011) Investment Management and Financial Innovations 8: 29-35.
22. Vergin RC and McGinnis J. Revisiting the Holiday Effect: Is it on Holiday? (1999) Appli Financial Economics 9: 477-482. https://doi.org/10.1080/096031099332131
23. Frieder L and Subrahmanyam A. Nonsecular regularities in returns and volume (2004) Financial Analysts Journal 60: 29-34. https://doi.org/10.2469/faj.v60.n4.2634
24. Bergsma K and Jiang D. Cultural New Year Holidays and Stock Returns around the World (2016) Financial Management Association Int 45: 3-35. https://doi.org/10.1111/fima.12094
25. Nhuong BH, Khanh PD and Dat PT. Calendar effects: Empirical evidence from the Vietnam stock markets (2020) Int J Advanced App Sci 7: 48-55. https://doi.org/10.21833/ijaas.2020.12.005
26. Fields MJ. Security prices and stock exchange holidays in relation to short Selling (1934) J Business 7: 328-338. https://doi.org/10.1086/232387
27. Ariel R. High stock returns before holidays: Existence and evidence on possible causes (1990) J Finance 45: 1611-1626. https://doi.org/10.1111/j.1540-6261.1990.tb03731.x
28. Cadsby BC and Ratner M. Turn-of-the-Month and Pre-Holiday effects in stock returns (1992) J Banking and Finance 16: 497-509. https://doi.org/10.1016/0378-4266(92)90041-W
29. Bildik R. Effects of Price Limits on Volatility: Evidence from the Istanbul Stock Exchange (2004) Emerging Markets Finance and Trade 40: 5-34. https://doi.org/10.1080/1540496x.2004.11052563
30. Bergsma K and Jiang D. Cultural New Year Holidays and Stock Returns around the World (2016) Financial Management Association Int 45: 3-35. https://doi.org/10.1111/fima.12094
31. Wong PL, Neoh SK, Lee KH and Thong TS. Seasonality in the Malaysian stock market (1990) Asia Pacific J Management 7: 43-62. https://doi.org/10.1080/096031099332131
32. Tong WHS. An analysis of the January effect of the united states, Taiwan and south Korean stock returns (1992) Asia Pacific J Management 9: 189-207. https://doi.org/10.1007/bf01732896
33. Yen H and Shyy AL. Chinese New Year effect in Asian Stock Markets (1993) Taiwan National University Management J 4: 417-436.
34. Chan MWL, Khanthavit A and Hugh T. Seasonality and Cultural Influences on Four Asian Stock Markets (1996) Asia Pacific J Management 13.
Corresponding author
Pham
Dan Khanh, School of Advanced Education Program, National Economics University,
207 Giai Phong Road, Ha Noi, Vietnam, Tel: 0948095169, E-mail: khanhpd@neu.edu.vn
Citation
Khanh DP, Thanh DP and Nhuong HB. A re-examination of the holiday effect in stock returns: the case of Vietnam (2020) Edelweiss Appli Sci Tech 4: 51-54.
Keywords
Calendar effects, Efficient market hypothesis, Dummy
variable regression, Holiday effect, VN-Index and Lunar New Year.
