
 PDF
PDF
Introduction
The need to classify regions according to various factors is determined by the fact that the Russian Federation has a huge territory, in some parts of which there are distinctive climatic, demographic and socio-economic features, which is manifested in the differentiation of regions according to various indicators. The study and analysis of individual parameters of the socio-economic development of territories will not allow getting an understanding of the features of the development of subjects, only the use of the main indicators makes it possible to conduct a comprehensive assessment of differentiation in the territorial context. The state regional policy is aimed at ensuring a balanced socio-economic development of the constituent entities of Russia. One of the most important goals of the Concept of long-term socio-economic development of the Russian Federation for the period up to 2020 is to reduce the level of interregional differentiation in the socio-economic state of regions and the quality of life [1].
According to the presidential decrees in May, one of the goals of the
country's sustainable development until 2024 is to increase the real incomes of
citizens of all constituent entities of Russia, which largely determines the
standard of living of the population. However, one can recall the opinion of [2]
that achieving equality of all regions is an almost impossible task due to too
strong differences in the resources and potential of the regions, their
climatic and territorial characteristics, population, etc. Therefore, it is
important to emphasize that the task is to reduce regional differentiation, and
not to completely eliminate it.
The uneven development and specificity of the sectoral structure of the economy
of individual regions of Russia determine the presence of differences in the
socio-economic development of territories. Achievement of target indicators
stipulated by state programs presupposes the development and implementation of
comprehensive measures in regions that are similar in various socio-economic
parameters. In this regard, it becomes necessary to form stable groups
(clusters) of regions. A cluster in this regard is a group of similar by
specific characteristic regions, not necessary territorially close, which can
be used as a method for governing the multiregional country and better
policymaking.
In scientific publications, there are various methods of grouping
regions according to the level of socio-economic development. One of the major
of them is modal division, based on the distribution of objects into clusters,
which are evenly divided between the minimum and maximum value of a parameter. The
other is automatically dividing the objects into clusters according to the
distribution theory, etc [3]. The methods, generally used for cluster analysis
are thoroughly described in a most widespread approach is based on the
calculation of the integral index, in accordance with which the regions are
grouped. This method is used both in international and domestic practice. An
alternative to the index method is the multivariate statistical approach, which
is based on methods of cluster analysis. According to the purpose of the study,
cluster analysis seems to be the optimal segmentation method, since the method
has a variety of tools that allow us to assess the quality and stability of the
formed groups. In international practice, the European Observatory on Clusters
and Industrial
Change (EOCIC) has a special place in working with clusters. It provides
political support for existing or new cluster initiatives at the national and
regional levels. This definition is achieved through conceptual schemes and
descriptions of modern cluster policy, which contributes to regional structural
changes and the development of new industries.
EOCIC helps
European regions and countries develop more effective and evidence-based
cluster policies and initiatives to:
·
Developing world-class clusters with competitive value
chains that span all sectors,
·
Support of industrial modernization,
·
Development of entrepreneurship in emerging industries
with growth potential,
·
Expanding access of SMEs to clusters and
internationalization of activities, etc.
EOCIC builds on the work of the European Cluster Observatory [4] and the
European Service Innovation Center, with a strong focus on industrial change
and its key drivers such as service innovation, entrepreneurship, key enabling
technologies, digitalization, creativity and eco-innovation, and
resource-saving solutions... A set of indicators drives each of these
dimensions with a specific focus on triggering and zooming in. EOCIC is
considering supporting clusters in 29 European countries, 49 European regions,
and 10 countries outside Europe (Brazil, Canada, China, Israel, Japan, Mexico,
Singapore, South Korea, Taiwan and the United States) [5].
An in-depth analysis of a wide range of cluster programs in Europe and
beyond shows what goals are being pursued by cluster programs in different
parts of the world and how they are being achieved. In general, the analysis of
EOCIC activities shows that cluster policy is widespread and that cluster
support is an essential tool for economic development in Europe and around the
world. EOCIC uses a data visualization tool called Cluster Mapping, which shows
the result of cluster
mapping in a regional ecosystem scoreboard. It displays industry,
cross-industry and regional indicators of industry clustering and their size,
business performance and other statistical information. Thus, clustering as a
tool for assessing regional differentiation is relevant both in domestic and
foreign practice. This study will use the main parameters of the socio-economic
development of territories and their distribution into characteristic, similar
groups (clusters).
Methodology
At the initial stage, it is necessary to determine a list of indicators on the basis of which the grouping of regions will be carried out. The feature space of cluster analysis is formed on the basis of the system of indicators of socio-economic development of territories used in the work. The system of statistical indicators proposed by the team of authors characterizing the main parameters of the socio-economic development of the territory is compiled on the basis of the following principles: simplicity, brevity and compactness. Thus, in the presented in Figure 1 system of indicators highlighted the enlarged groups that characterize the relevant areas of socio-economic development of the territory: economic (macroeconomic indicators), demographic (characterizing the population and its change), standard of living and labor market. This method considers the nature of the change in the spread of Wtotal with an increase in the number of groups k. Further, knowing the number of clusters, a cluster analysis was carried out by the k-means method using the SPSS Statistics application package. We choose Euclidean distance as a metric. Based on the cluster analysis of the regions of Russia by these indicators, the authors divide them into clusters and form objective recommendations for the policymaking process in Russia [6].

Figure 1: The main indicators for cluster analysis.
Results
Composition
of Clusters by Main Indicators of Socio-Economic Development of Russian Regions
The classification of the regions of
the Russian Federation into qualitatively formed homogeneous groups makes it
possible to identify regional differentiation, as well as to identify
characteristic groups based on actual data on the main indicators of the
socio-economic development of regions. In the process of conducting cluster
analysis, much attention was paid to such issues as: complex classification of
regions, identification of similarities and differences between them,
inconsistency of classifications of the same objects on several grounds, the
nature of the solution of these contradictions. In the study, for the purpose
of conducting cluster analysis, the official statistical data presented in the
open resources of the Federal State Statistics Service (Rosstat) for 2018 were
used (for a number of indicators, data for 2019 are not available at the time
of the study) [4].
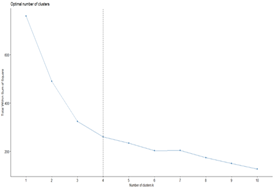
Figure 2: “Elbow” for the Russian regions cluster analysis (calculated by authors).
All 85 constituent entities of the Russian Federation are included in the clustering procedure. Cluster analysis of the country's regions in terms of socio-economic development was carried out using the SPSS Statistics and R. The results of the analysis of the number of clusters, proposed here above, is presented on (Figure 2). Combining all 85 observations into one group, we have the largest intra-cluster variance, which will decrease to 0 as k → nk → n. At a certain stage, one can see that the decrease in this variance slows down-on the graph, this occurs at the point called the “elbow” (Figure 2). Determination of the number of clusters by the main indicators of the socio-economic development of the regions of the Russian Federation for 2018. So, now, when we can tell the concrete number of clusters, we can group the regions in them. Let's construct a grouping in a complete feature space. Clustering of the constituent entities of Russia by the nearest neighbour method also allowed us to conclude that the studied administrative-territorial units should be organized into four clusters (Figure 3).
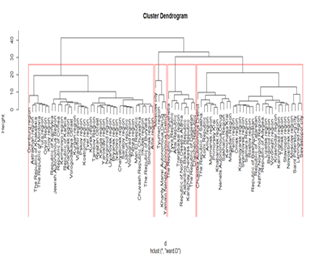
Figure 3: Clusterization results, presented in dendrogram form (developed by authors).
Clustering of Russian regions by the main indicators of socio-economic
development in 2018 by the method of the nearest neighbor.
As a result, the clusters have the following size: 1 cluster - 33 subjects, 2 clusters - 39 subjects, 3 clusters - 4 subjects and 4 clusters - 9 subjects. The composition of the clusters is as follows (Table 1). Composition of clusters by main indicators of socio-economic development of Russian regions in 2018. The dimensions of the clusters presented in Table 1 are different. Thus, the largest number of regions is included in cluster 2 (39 subjects of the federation). In this cluster, there are subjects from 7 federal districts, only representatives of the North Caucasian Federal District are absent. The next largest cluster - 1, includes 33 regions of Russia, representing all 8 federal districts of the country. Clusters 3 and 4 differ significantly: they include 4 and 9 subjects of the federation, respectively. Cluster 3 includes regions that are representatives of the Central and Ural Federal Districts, in fact, including the city of Moscow and the Tyumen Region with two autonomous districts. A distinctive feature of cluster 4 is that it includes national republics from the South, North Caucasian and Siberian federal districts. Thus, 85 constituent entities of the Russian Federation, according to the main indicators of socio-economic development, according to official statistics for 2018, according to the system of indicators used in this study, after applying the clustering procedure, were divided into 4 groups with similar content. Structurally, the largest, the second cluster includes 45.8% of the country's regions, the first cluster - 38.7% and the smallest clusters are three and four, 5% and 10.5%, respectively.
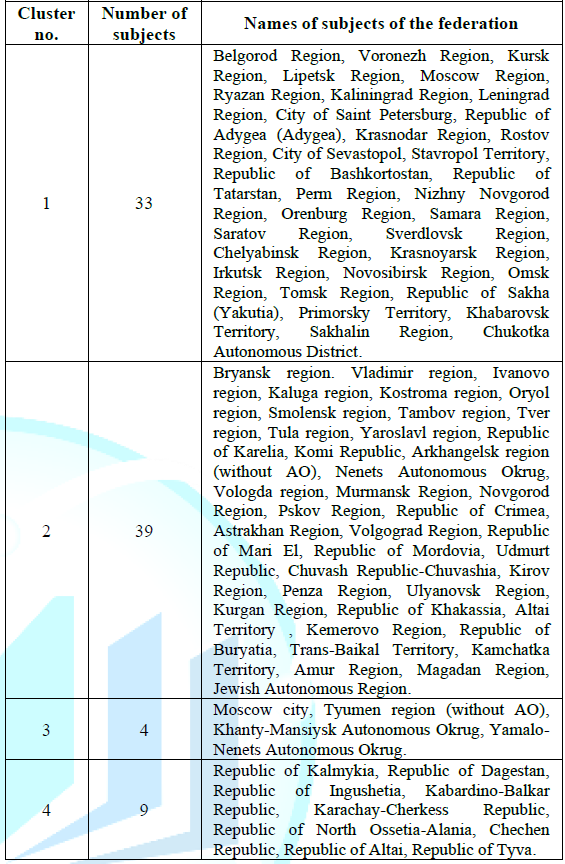
Table 1: Clusterization results in table form (developed by authors).
Average
Values of Factors for Enlarged Groups and Their Analysis
In order to better understand and analyze the above clusters, average values are calculated. The enlarged groups of indicators include the main indicators characterizing the socio-economic development of the territory: economic (GRP per capita, rubles; The volume of investments in fixed assets, million rubles; The cost of fixed assets, million rubles; Costs of technological innovation, million rubles; Industrial producer price index%), demographic (Population change%; Natural population growth rates per 1000 people; Migration growth rates per 10,000 people; Demographic load factors, per 1000 people of working age; Expected life expectancy at birth, years), standard of living (Average per capita cash income, rubles; The share of the population with cash incomes below the subsistence minimum, in%; Gini coefficient, in times; Consumer price index%; The cost of a fixed set of consumer goods and services, rubles) and the labor market (number of labor resources, thousand people; Share of people under working age employed in the economy in the total number of employed%; Unemployment rate%; Real accrued wages of employees of organizations%).
Characterization of the main parameters of the economic development of the subjects of the Federation makes it possible to assess the activity and involvement of territories in the economic life of the country, their comparison and comparison (Table 2).
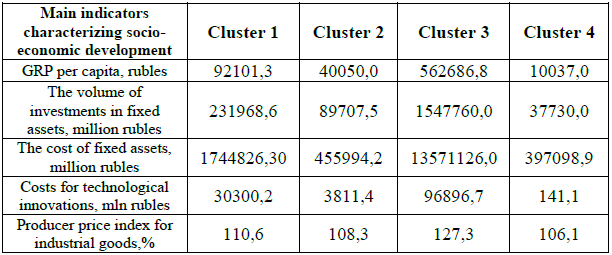
Table 2: Main macroeconomic indicators values for every cluster (developed by authors) [8].
Average values of key indicators characterizing the economic development
of territories for each cluster according to the main indicators of socio-economic
development of Russian regions in 2018. Analyzing the average values of the
main indicators characterizing the economic development of territories by
clusters, the following feature is highlighted: all the maximum values of the
enlarged group under consideration are characteristic of cluster 3, which
includes the city of Moscow, Tyumen region (without AO), Khanty-Mansiysk
Autonomous Okrug, Yamalo-Nenets Autonomous Okrug, and all the minimum values
are inherent in cluster 4 (Republic of Kalmykia, Republic of Dagestan, Republic
of Ingushetia, Kabardino-Balkar Republic, Karachay-Cherkess Republic, Republic
of North Ossetia-Alania, Chechen Republic, Altai Republic, Tyva Republic) [9].
The differences between the clusters are significant. So, for example,
GRP per capita according to the average values of the third cluster is 56 times
higher than the average values of cluster 4, and the cost of technological
innovation is 687 times! The significant differences in the average values for
the main indicators characterizing economic development for clusters 3 and 4
can be explained primarily by the composition of regions in clusters. Cluster 3
includes regions with abnormally high economic indicators: Moscow, the capital
of Russia, a city of federal significance, the largest financial center on a
national scale and a center for managing a significant part of the country's
economy. For example, more than half of the banks registered in the country are
concentrated in Moscow, while they account for 90% of banking assets.
In addition, most of the largest companies are registered and have their
central offices in Moscow, although their production can be completely located
thousands of kilometers from the capital. As of November 2019, 104 of the
country's 200 largest enterprises are registered in Moscow. In the Tyumen
region (including the AO) in recent years, the economic growth rate has become
one of the highest among the regions of Russia [10]. The region ranks first in
the country in terms of industrial output. The main industry of specialization
is oil and gas production, concentrated mainly in the Khanty-Mansi Autonomous
Okrug-Yugra and Yamalo-Nenets Autonomous Okrug. In the south of the Tyumen
region there are petrochemical enterprises, mechanical engineering (production
of oil field, geological exploration, oil refining equipment), agro-industrial
complex (production of meat and dairy products and vegetables), scientific and
educational institutions.
Cluster 4 includes most of the subjects of the North Caucasus Federal
District (with the exception of the Stavropol Territory), the regions of which
are subsidized. So, in 2019 in Dagestan, subsidies accounted for 52% of the
revenues of the consolidated budget of the region, in Chechnya-50%, in
Ingushetia-49%, in Kabardino-Balkaria-35%, in Karachay-Cherkessia-34%. The
Republic of Tyva became the most dependent on federal subsidies-subsidies
accounted for 54% of the region's consolidated budget revenues. Historically,
the regions represented in cluster 4 have not had large-scale industries or
mining operations. The most traditional for these republics are agriculture
(livestock and crop production), trade and government. With the exception of the
Republic of Tuva. In this region, the first place in terms of the main types of
economic activity is mining.
Closer to the maximum values are the average values of cluster 1 (33
subjects of the federation). The cluster includes the most successful regions
of each of the federal districts of Russia-all the average values of key
indicators characterizing the economic development of territories are located
immediately after the leader of the group, ranking second in all positions. In
2018, the average value for the cluster of the gross regional product per
capita is 92,101.3 rubles, which is 6 times less than the average value for
cluster 3 (the highest values for this group of indicators), but at the same
time, the presented value is more than 9 times more than the average for
cluster 4 (the lowest values for this group of indicators). The average value
for the cluster of the cost of fixed assets is 1,744,826.3 million rubles,
which is almost 8 times less than the average value for cluster 3 and 4.5 times
more than the average value for cluster 4.
It should be noted that the smallest differences are characteristic of
the costs of technological innovation-the difference with the highest average
values of the 3rd cluster is 3.2 times. According to this indicator, there are
tangible differences in the average values for clusters: the highest values are
in cluster 3, cluster 1 is next, then cluster 2, whose values are 25 times less
than cluster 3 and almost 8 times less than cluster 1, and 4 is an indisputable
outsider in the analyzed group. cluster-687 times less than the average values
of cluster 3, 215 times less than cluster 1 and 27 times less than cluster 2.
Thus, the regions included in cluster 1 are characterized by significant
economic activity, significant volumes of investments in fixed assets,
developing technological innovations.
The largest cluster 2 (39 subjects) included those regions that have not
yet entered the group of economic outsiders, but at the same time do not have
particularly high values in terms of the average values of key indicators
characterizing the economic development of territories-for five analyzed In
terms of parameters, cluster always ranks third behind the recognized leader
(cluster 3) and cluster 1, but ahead of the least economically prosperous
cluster 4. For example, the average cost of technological innovation in cluster
2 is 27 times higher than the similar values of cluster 4. At the same time,
there are practically no differences in the average values of the cost of fixed
assets (about 15%); in the regions included in clusters 2 and 4, the cost of
fixed assets is extremely low, which may indicate both a significant
deterioration of fixed assets and their obsolescence.
Summarizing the results of the cluster analysis for an enlarged group of
indicators characterizing the main parameters of the economic development of
regions, the following conclusions can be drawn. First, the system of
statistical indicators developed by the authors and used in the work carries
the task of analyzing the key parameters of socio-economic development and does
not include an extended list of indicators. Secondly, the results of the
clustering procedure carried out made it possible to group the regions of the
country according to similar characteristics. Thirdly, from the 4 obtained
clusters, a small leader cluster (cluster 3) and an outsider cluster (cluster
4), including 4 and 9 subjects of the federation, respectively, stand out.
Fourth, the most voluminous clusters 1 (33 subjects) and 2 (39 subjects)
characterize about 85% of the country's regions, each of the clusters has its
own peculiarity. Fifthly, for a more detailed disclosure of the processes
occurring at the regional level, the directions and speed of changes, it is
necessary to continue working on the topic, including the study of both time
series and expanding the system of indicators. The next enlarged group of
indicators includes key parameters that characterize the standard of living of
the population. In modern conditions of economic development, the concept of
"living standards of the population" is of particular importance,
since it most reflects the development of health care, education and other
spheres of the country's life. The standard of living is a complex and multifaceted
category that requires statistical analysis taking into account the
multifactorial and dynamic nature of socio-economic processes.
According to the Convention of the International Labor Organization (hereinafter referred to as the ILO) "On the main goals and norms of social policy", an individual has the right to the standard of living that is necessary to maintain the health and well-being of himself and his family at a decent level, as well as the right to safety in case of loss of livelihood in circumstances beyond his control. As the United Nations (hereinafter referred to as the UN) recommends, a person's standard of living should be assessed by a system of indicators that indicate health, consumption, employment, education, housing, social security and other characteristics. The standard of living of the population is a complex socio-economic category that characterizes the level of satisfaction of the needs of the population in tangible goods and intangible services, as well as the conditions in society for the development and satisfaction of these needs. In the study of the socio-economic development of Russian regions, the clustering procedure includes five key indicators (Table 3).
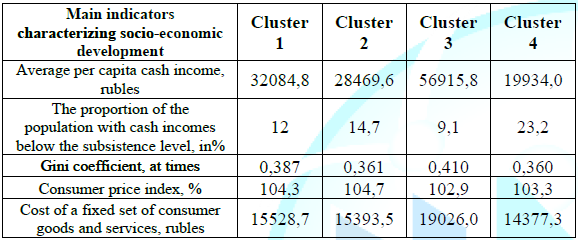
Table 3: Main socio-economic indicatorsvalues for every cluster (developed by authors) [8].
Average values of key indicators characterizing the standard of living
of the population for each cluster according to the main indicators of
socio-economic development of Russian regions in 2018. The average per capita
monetary income of the population in 2018 in Russia as a whole amounted to
33,178 rubles. This figure is 23,737.8 rubles. (71.55%) less than the average
income of the population of the four regions of the richest cluster 3 and
higher than the same indicators for subjects from the other three clusters. The
most approximate are the values of average per capita money income for cluster
1-the average values for the cluster are lower than the national ones by
1,093.2 rubles or 3.3%.
The most tense situation was recorded in the regions of cluster 4-the average
values for the cluster are lower than the national ones by 13,244 rubles or
40%, which is quite expected for the values that were identified in the
enlarged group of indicators characterizing the economic development of
territories. The average per capita money income for cluster 2 is lower than
the national average, and the average for clusters 1 and 3, but higher than
cluster 4. In 2018, in the Russian
Federation, about 12.60% of the population had cash incomes below the
subsistence level, which is 3.5 pp. (by 27.8%) higher than the poverty level in
the richest regions of Russia (cluster 3). The volumes of the population with
monetary incomes below the subsistence level in cluster 1 are closest to the
federal ones-12.0%, which is 4.8% lower. The average value of the indicator for
cluster 2 and 4 is higher than the national values by 16.7% and 84.1%,
respectively. Thus, the most tense situation with the level of poverty in the
regions included in cluster 4-almost a quarter of the population lives below
the poverty line.
Economists believe that the Gini coefficient should not be higher than
0.3-0.4. When the index is higher, there is high inequality in the country. It
slows down the pace of economic development and forms a "poverty
trap" in which society becomes poorer with each generation. The degree of
differentiation of the Russian population in terms of money income was high.
The Gini coefficient in 2018 was 0.413 times, which exceeds the same indicators
for the regions of all four clusters. The highest average value of the
coefficient for the regions of Russia in 2018 corresponds to cluster 4, the
most economically prosperous-0.410 times. Thus, high economic indicators and
the highest average per capita money incomes do not guarantee income equality in
society. The rest of the clusters, despite significant differences in the
previous socio-economic indicators, have normal values of the Gini coefficient.
The consumer price index in the analyzed period for the country as a
whole was 104.3%, an absolutely identical average value is characteristic of
cluster 1. In the regions of cluster 2, prices in 2018 grew more intensively
than the national ones by 0.4 pp, in regions of cluster 3 and 4 the average
rate of price growth is lower than in Russia as a whole. The cost of a fixed
set of consumer goods and services in the Russian Federation in 2018, according
to Rosstat, was 15467.9 rubles, which is 3558.1 rubles (or 23%) below the
average value of the most economically prosperous regions of cluster 3. The
regions have a slight advantage included in cluster 1 (60.8 rubles). The lowest
average values of the cost of a fixed set of consumer goods and services in the
regions included in cluster 4.
After analyzing the average values of key indicators characterizing the
standard of living of the population in 2018 for each cluster and comparing
them with the all-Russian values, we can formulate the following conclusions.
First, in the considered enlarged group of indicators, the leader remained
unchanged-the regions included in cluster 3 are invariably in the first
positions (with the exception of income differentiation). The outsider has not
changed either - the republics of cluster 4, with the exception of income
differentiation (in cluster 4, the lowest value of the coefficient) and the
consumer price index (below the all-Russian values) by key parameters
characterizing the standard of living of the population (average per capita
money income, poverty level, cost of a fixed goods and services) significantly
lag behind both the average values of other clusters and the national scale
[11].
Third, the average values of the regions included in cluster 1 are the
closest to the all-Russian values - deviations of all the indicators under
consideration are within 5%. Labor market statistics are a very important tool
for the development of economic and social policies of states, as well as for
analyzing the structure of the population. Labor market statistics consider the
size of the employed and unemployed population as two components of the labor
force, based on the measurement of the labor force, monitoring is carried out
and strategies are developed to increase the employment of the population
providing their labor for the production of goods and the provision of services.
The size and composition of labor resources, labor force, employed and
unemployed population is dynamic and changeable. Understanding the prevailing
trends in the indicators under consideration is possible only when reliable,
detailed and versatile information is used (Table
4).
Average values of key indicators characterizing the labor market of
territories for each cluster according to the main indicators of socio-economic
development of Russian regions in 2018. Four key indicators were used as the
main indicators characterizing regional labor markets in order to characterize
territorial differentiation. The number of labor resources is an indicator
characterizing the “free” labor reserves not participating in the regional
economy, which, if necessary, can be attracted. The highest average values for
clusters are typical for the third cluster - 3633.4 thousand people, the
smallest - for the fourth cluster, 7.3 times lower than the values of the
first. When comparing with the leader, it was revealed that the average values
of the indicator in the regions included in the first cluster are closer to the
leader, but nevertheless lag behind in values 2.4 times, the second cluster - 6
times.
Thus, the regions included in the third cluster have the largest labor reserve, the most tense situation with free labor resources in the republics included in the fourth cluster. To understand such a distribution, in addition to indicators characterizing the labor market, it is necessary to study the changes and structure of the population in the regions. The share of people under working age employed in the economy in the total number of employed - shows how much the number of labor resources in the regions is formed at the expense of young people who, for social and economic reasons, are forced to work outside of working age. The most tense situation in this case was formed in the regions included in the second cluster-there 12% of the employed were formed at the expense of persons younger than the working age. The most favorable situation is in the regions of the first cluster-about 1% of those employed in the economy are formed by people under the working age.
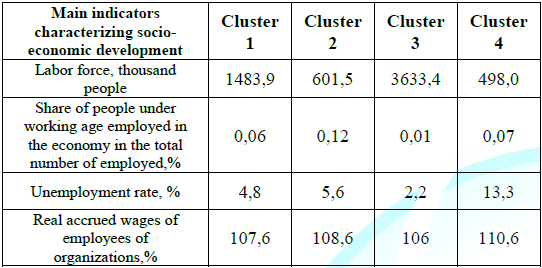
Table 4: Labor indicators for every cluster (developed by authors) [8].
The unemployment rate is a relative value that characterizes the ratio
of registered unemployed to the total labor force, and represents a
socio-economic phenomenon in which a part of the population capable and ready
to work cannot find a job. The most acute problem is registered unemployment in
the republics included in the fourth cluster. Such a distribution is quite
expected, given the values presented in the group of main indicators
characterizing the economic development of territories. The real accrued wages
of employees of organizations reflects the relative change in nominal wages,
taking into account changes in prices in the current period. The maximum
average values of this indicator are inherent in the fourth cluster - in this
case, we are talking more about a high share of government support measures,
including social transfers, rather than about significant economic growth or an
increase in wages of regional workers.
The labor market is one of the elements of a market economy. It is a
system of public relations in the coordination of the interests of employers
and hired labor. According to the key parameters included in the system of
indicators that characterize the regional labor market and for the four
clusters formed in the regions of Russia in 2018, the following is observed: a
significant level of unemployment with the least number of labor resources,
with the maximum value of real accrued wages, is characteristic of the fourth
cluster. The third cluster, being the leaders in the previous enlarged groups
of indicators, in the analysis of the labor market also occupies the leading
places - the smallest scale of the unemployment rate and the attraction of
people younger than the working age to work and the greatest value of labor
resources with a minimum increase in real gross wages.
As before, the average values for the first cluster are closer to the leader (cluster 3), and the average values of the second cluster are closer to the outsider. The demographic situation is a complex quantitative characteristic and qualitative assessment of the demographic processes occurring in a certain territory: their trends, outcomes for a certain period and consequences. It is formed due to many different indicators and that is why it is rational to analyze it on the basis of a certain list of sequential and logically interrelated tasks, the solution of which allows you to get a complete and comprehensive idea of the actual state and development prospects of the research object. In this study, the main parameters that characterize the demographic situation will be used (Table 5).
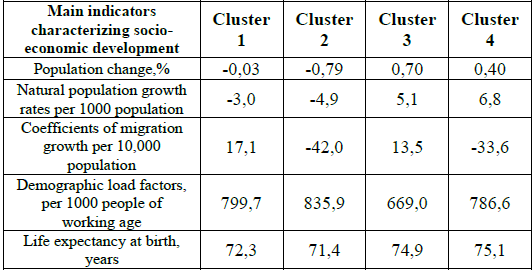
Table 5: Demographic indicators values for every cluster (developed by authors) [8].
In the economic and statistical study of the socio-economic situation,
both at the federal and regional levels, an important role belongs to the
analysis of population dynamics, which traditionally represents the overall
results of the development of society. This step allows us to judge the nature
of the transformation of administrative-territorial entities. The change in the
population size in 2018 for the analyzed 4 clusters is as follows: in the
regions included in clusters three and four, the population increases by 0.7%
and 0.4%, respectively, while in the largest first and second clusters (84.5%
of the subjects of the Federation in total) recorded an average decrease in the
population. Such transformations occur due to the predominance of negative phenomena,
such as the preponderance of mortality over births or the greater importance of
the number of those who left over those who arrived. The analysis of indicators
in absolute values for the purpose of their further comparison is incorrect,
since the population size in the regions is different. In the work, in order to
determine the factors of change in the population size, we used relative values
- the coefficients of natural and migratory population growth. From the point
of view of structural changes, the analyzed clusters have a very curious form.
The average values of the main demographic indicators in the regions
included in the first cluster were distributed as follows: natural population
decline (3 per 1000 people of the population) versus migration growth (17.1 per
10,000 people) ultimately gives a decrease in the population, i.e.; ... the
intensity of natural loss is higher and is not covered by migration gain. The
average values of the main demographic indicators in the regions included in
the second cluster are unidirectional, have negative values - both natural and
migration losses in total give the largest population decline among the
analyzed clusters (0.79%), i.e. on average, these regions are characterized by
high mortality rates with migratory unattractive territories.
The average values of the main demographic indicators in the regions included
in the third cluster are also unidirectional-both natural and migration growth,
as a result of the highest values of population growth in the cluster
environment (0.70%). A feature of the average values of the main demographic
indicators in the regions included in the fourth cluster is the fact that the
birth rate in these subjects is such that it not only compensates for
mortality, but also for migration decline, thereby ensuring an increase in the
population of the territories, i.e. these regions act as donors for the rest. Demographic
load ratios make it possible to determine the existing proportions in the age
structure of the population: the ratio of disabled people per 1000 people of
working age. The largest value of the coefficient falls on the average value of
the second cluster (835.9 per 1000 people of working age), the lowest value is
typical for the third cluster-669 people of disabled age per 1000 people of
working age.
Life expectancy at birth is the number of years that, on average, would
have to live for a person from the generation of births, provided that
throughout the life of this generation, the age-specific mortality remains at
the level of the year for which the indicator is calculated. Life expectancy is
the most adequate generalizing characteristic of mortality. The highest values
are in the republics included in the fourth cluster (75.1 years), and the
lowest in the regions of the second cluster-71.4 years. Thus, after analysing
the main parameters of the demographic development of Russian regions, the
following features of the territories were identified. First, from the point of
view of changes in the population size and its constituent elements, all
clusters are different (due to the directions of changes). Secondly, in the
second cluster, which has negative values for the change in population, the
expected high values of the dependency ratio. Thirdly, the highest values of
life expectancy at birth are typical for the republics included in cluster 4,
where 7 out of 9 are regions of the North Caucasus with national culture and
traditions of longevity.
Discussion
The major objective of the presented article is the classification of
the Russian regions into clusters, and its results are presented above. Still,
the other important issue remains uncovered. The practical significance of such
classification for Russia, especially for the policymaking in the sphere of
economy, demography and labor is significant. The main factors, contributing to
this significance are the necessity to differentiate the measures, taken by the
Government. For instance, the system of penalties for administrative crimes in
Russia doesn’t have any regional differentiation. It leads to the fact, that
such administrative crimes, as speeding or leaving trash out of the special
areas in Moscow, Moscow region and Vladimir region have different consequences
on the disposable income of the population. If in Moscow the penalty harms the
social position of the citizen not significantly (8% of the average monthly
income in case of serious speeding), the same penalty in Moscow region will
account for 16% of disposable income, while in Vladimir [12], the neighbouring
region, it will take 20% of disposable income. In this regard, the authors
propose to introduce a differentiated system of penalties in Russia, based on
the cluster analysis, presented above. This system will allow to make the
administrative system better and more just. The other issue is that the social
support of the citizens is also in equal. The migration rate and the
differences in the birth rates demonstrate the urge to leave the domestic
regions with growing population, leading to the deficit of labor force in these
regions and unemployment in the regions, which are flooded by the migrants from
the other regions. The differentiated system of the social support of the
population could have made the regions with naturally growing population
attractive for living. All in all, the proposed cauterization allows to for
focus spheres, which should be revised in Russia in order to smoothen the
social and economic factors, leading to the social inequity and unrest.
Conclusion
This study was carried out within the framework of the state task in the
field of scientific activity of the Ministry of Science and Higher Education of
the Russian Federation on the topic "Development of a methodology and
software platform for building digital twins, intellectual analysis and
forecasting of complex economic systems", project number FSSW-2020-0008. The
authors had the goal of assessing the regional differentiation of the
constituent entities of the Russian Federation by the level of socio-economic
development, having developed an original system of statistical indicators that
include the main parameters of the socio-economic development of territories
and using the method of cluster analysis to identify typical groups of regions
from the standpoint of the specifics and key parameters of the socio-economic
situation.
In the work, before compiling a system of statistical indicators, an analysis of scientific literature was carried out and the international practice of working with clusters was considered. The European Observatory on Clusters and Industrial Change provides policy support for existing or new cluster initiatives at national and regional levels. This was made possible by pilot regions in transition in industry, the cluster stress testing tool, and conceptual sketches and descriptions of modern cluster policies that facilitate regional structural change and the development of new industries. The system of statistical indicators developed and proposed by the authors includes key parameters of the socio-economic development of territories and at this stage of the study does not pretend to be an all-embracing one, since the team of authors is faced with the task of assessing the key parameters of the socio-economic development of the subjects of the federation with the subsequent improvement and expansion of the assessment system.
Cluster analysis of Russian regions by the parameters of socio-economic development was carried out using the SPSS Statistics and R software packages. 85 constituent entities of the Russian Federation by the main indicators of socio-economic development after applying the clustering procedure were divided into 4 groups similar in content. Structurally, the largest, the second cluster includes 45.8% of the country's regions, the first cluster -38.7% and the smallest clusters are three and four, 5% and 10.5%, respectively. Summing up the results of regional differentiation in terms of the level of socio-economic development of the constituent entities of the Russian Federation in 2018, it should be noted that in the course of analysis and interpretation of the results, clusters with leading values (cluster 3) and significantly lagging (cluster 4), as well as cluster 1, were identified, whose values were always closer to cluster 3 and all-Russian. This topic is relevant, has an applied nature and requires a more detailed disclosure of the processes occurring at the regional level, the directions and speed of changes. The team of authors considers it necessary to continue work on the topic by including the study of both time series and expanding the system of indicators.
Reference
1. UN Sustainable Development Goals [Electronic resource].
2. Natalia V and Zubarevich. Regional Development and Regional Policy in Russia during Ten Years of Economic Growth (2009) J New Economic Association 161-174.
3. Kozonogova E and Dubrovskaya J. The Method of Regions’ Typology by the Level of Cluster Potential (2019) Eurasian Studies in Business and Economics 10: 2.
4. Victor E. Dementiev Factors of regional differentiation by economic growth rates Central Terra Economicus (2020) 18: 6-21. https://doi.org/10.18522/2073-6606-2020-18-2-6-21
5. Moreno R, Paci R and Usai S. Geographical and sectoral clusters of innovation in Europe (2005) Ann Reg Sci 39: 715-739. https://doi.org/10.1007/s00168-005-0021-y
6. Fabrice Muhlenbach and Stephane Lallich. A New Clustering Algorithm Based on Regions of Influence with Self-Detection of the Best Number of Clusters (2009) Ninth IEEE Intl Conference on Data Mining, USA 884-88. https://doi.org/10.1109/icdm.2009.133
7. Unified interdepartmental statistical system (EMISS) Electronic resource.
8. Regions of Russia. Socio-economic indicators (2019) Electronic resource.
9. Khasbulatova OA. Russian state policy on bridging the gender gap in the digital economy: conceptual approaches (2018-2030) // Gender dimension of the digital economy: from strategy to action (2018-2030) 3: 116-20.
10. Map of Russian business. Where the largest Russian companies are registered [Electronic resource].
11. Galieva GM. The standard of living of the population through the prism of income and expenses (2018) Scientific and methodological J Concept 7: 18-26.
12. Moscow in numbers [Electronic resource].
Corresponding author
Olga A Zolotareva, Department of Statistics, Plekhanov Russian University of Economics, Russia, E-mail: zolotareva.oa@mail.ru
Citation
Sadovnikova AN, Davletshina AL, Zolotareva AO and Lebedinskaya OO. Regional differentiation of the constituent entities of the Russian federation by the level of socio-economic development (2021) Edelweiss Appli Sci Tech 5: 1-7.Keywords
Indicators of socio-economic development, System
of indicators, Clustering, Regional differentiation, Multidimensional
statistical analysis.
