
 PDF
PDF
Introduction
The demand for electricity has always grown from time to time compared to other energies. The electricity demand in Indonesia is projected to meet 2.214 TWh in 2050, or it can be said that the demand will increase for about 9 times from the electricity demand in 2018 in the amount of 254,6 TWh. The growth rate of electricity demand may reach an annual average score of 7% over the 2018-2050. The electricity demand during the projection period is relatively common with the largest portion of the household sector, industrial sector, commercial sector, transportation sector, and other sectors. The share of household electricity sector will increase from 49% in 2018 to 58% in 2050. This condition is primarily affected by the household growth number which may increase from 67 million in 2018 to approximately 80 million in 2050 [1,2].
The decrease in fossil energy production especially petroleum and global commitments in reducing greenhouse and gas emission has driven the Indonesian government to intensify important and sustainable roles in new and renewable energy as part of maintaining energy autonomy and endurance [3]. In accordance with PP regulation number 79 of 2014 concerning the National Energy Policy, the targetted new and renewable energy combination in 2025 is at least 23% and in 2050 is at least 31%. Indonesia has big potency on new and renewable energy which will be achievable and meet the primary target. Indonesia has a total renewable energy potential equivalent to 442 GW which can be used for electricity generation, whereas the utilization is only 8.8 GW or it is only 0.019% of the total renewable energy in 2018 [2]. The biggest potential for renewable energy may come from solar energy at 207.8 GWp.
To accelerate New and Renewable
energy development, the government has established several regulations such as
Peraturan Presiden No. 4 in 2016 (Article 14) concerning the Electricity
Infrastructure Acceleration prioritizing the use of new and renewable energy Peraturan
Menteri ESDM No. 50 in 2017 concerning the Utilization of Renewable Energy Sources
as the Supply of Electricity and Peraturan Menteri ESDM No. 49 in 2018
concerning the Use of Rooftop Solar Power Generation System by state-owned
corporation Perusahaan Listrik Negara (PLN) customers (Menteri Energi Dan
Sumber Daya Mineral Republik 2018) [4,5]. With the high potential of solar
energy in Indonesia and the indorsement from government regulations, this
system is expected to be a solution to comply with the high electricity demand
in the future by utilizing the solar cell as the source of electrical energy.
By considering the growing number of household customers, utilizing the
rooftop’s consumers as solar power generator base can be an effective and
efficient solution. Therefore, the purpose of this research is to analyze the
energy produced by rooftop solar power plant system with a household-scale
on-grid system with simulation in PVSyst 6.43 software and to analyze the
economic feasibility of rooftop solar power plant on grid system
household-scale.
Material and Methods
Solar Radiation
Solar radiation is defined as the
amount of energy received per unit area and time on earth. The value can be
determined depending on such factors, for instance, the location latitude, the
season and weather, and the timing. There are two types of radiation which are
direct radiation generated from the sun, and indirect radiation generated from
atmospheric particles scattering. Indonesia is geographically located on the
equator in exact and this resulting in such advantages and great potential of
solar energy utilization. Indonesia has a relatively high radiation level which
is equal to 4,80 kWh/m2/day [7-9].
Solar Power Plants
Solar Power Plant is a
sunlight-based power plant that uses solar cells to convert the photon sunray
radiation into electricity. Solar cells are made from sheer layers of pure
silicon and such semiconductor materials. Solar Power Plants is friendly to the
environment and it does not produce any noise nor harmful waste to the
surroundings. There are several factors that influence the solar cell output
power efficiency such as solar radiation, solar cell temperature, solar panel
orientation, and shadow leverages [10-12].
Technical Analysis
The technical analysis is conducted
based on the rooftop solar power plant capacity, major components specification
utilization and determination, solar panel orientation, and the generated power
from the plant. The power generated by rooftop solar power plant is affected by
some factors including sunray radiation in the research area, the solar panel slope
and its direction, sunlight, temperature, and the technical performance [13].
This technical performance is predicted to decrease in time because of the
solar module degradation [14]. The quality of rooftop solar power plant can
also be seen by its performance ratio. In general, performance ratio is shown
in percentage value that shows the total power produced by the system and also
the losses compared while the system is working in STC condition. Solar power
plant losses are due to solar panel efficiency, temperature, and inverter
efficiency [15,16].
Economic Feasibility Analysis
In general, economic analysis can be
defined as an economical analysis of technical investment. The purpose of this
analysis is to assess the technical investment proposal feasibility by doing an
alternative study that is considered the most profitable. Basically, technical
investments have a long economic cycle, mostly it has an annual cycle length.
On the other hand, the currency values vary time after time. Therefore, the equivalence
currency value process is needed [17].
Research on the economic solar cell
energy based uses some methods, which are Net Present Value (NPV) and
Discounted Payback Period (DPP). Economic research should be conducted due to
fairly high expenses in order to find out the optimal and economic result.
Net Present Value (NPV)
NPV is a method of calculating the net present value. The present assumption is to explain the initial time of the calculation to coincide with when the evaluation was carried out or in the zero year period (0) in the calculation of investment cash flow [18]. Cash flow consists of cash in and cash out, Cash flow that only calculated the benefits is called the Present Worth of Benefit (PWB), whereas if cash flow only calculated cost is called the Present Worth of Cosf (PWC). Meanwhile, NPV is obtained from PWB-PWC. To calculate the PWB, PWC, and NPV values, the following equation is used:
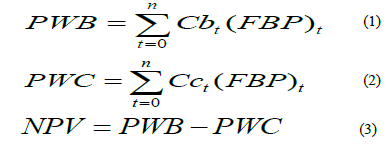
Which Cb is Cash flow benefit, Cc is
Cash flow cost, FBP is Present Interest Factor, t is Time Period, n is Age of
investment. If the NPV value is more than 0, it means that the investment is
feasible, whereas if the NPV value is less than 0, it means that the investment
is unfeasible [18].
Benefit Cost Ratio (BCR)
The benefit cost ratio (BCR) method is one of the methods often used in the initial evaluation stages of investment planning or as an additional analysis in order to validate the evaluation results that have been done with other methods. To calculate the value of bcr used equations as follows:

Where PWB is Present worth Benefit
and PWC is Present worth Cost.
To find out if an investment plan is
economically viable or not, a specific measure/criterion is required in the BCR
method if BCR is more than 1, it means that the investment is feasible. If BCR
is less than 1, it means that the investment is unfeasible.
Payback Period (PP)
Payback period (PP) is the time required to return the investment cost. The way to calculate the PP is to calculate the time needed (years) so that the estimated cumulative cash flow will be the same as the initial investment cost. To calculate the return period used, the calculation is as follows:

Where PP is Payback Period, k is
Period, CFt is Cash flow period -t.
If the PP time period is shorter
than the project life, the project investment will be feasible and if the PP
time period is longer than the project life, the project investment is not
feasible.
Internal Rate of Return (IRR)
This Internal Rate of Return (IRR)
method looks for interest rates when npv is equal to zero. So, in this IRR
method the resulting information relates to the level of cash flow capability
in returning the investment described in the form of a period of time. The
simple logic explains how much cash flow is capable of returning its capital
and how much liabilities it must meet. If the value of the IRR is greater than
the interest rate used in the calculation then it can be said to be feasible.
Results and Discussion
Simulation
To stimulate the solar power plant prototype design on PVSyst 6.43, such data are required, for instance, the factors that affect PVSyst 6.43 software simulation result. The factors are including the solar power plant geographic location, solar energy potential data, ambient temperature, solar panel orientation, specifications of the components used, and the daily load estimation. After the simulation process is conducted, the amount of potential electrical energy will be shown. There are numerous values that indicate the amount of produced electrical power, the amount of electricity delivered to the load, and the amount of electric power supplied to the grid. In addition, the solar power plant loss diagram and performance will be shown in graphical data. In this research, a household-scale rooftop solar power plant is designed in Sambiroto Asri Cluster residence number A.9 in Semarang City, Indonesia (Figure 1,2).
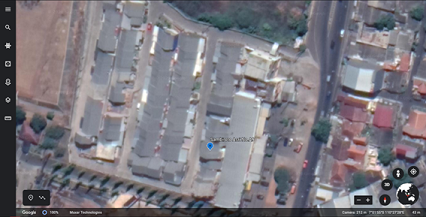
Figure 1: Research location in sambiroto asri cluster residence number A9, Semarang City.

The research area is located astronomically in 7°1'56.06" South Latitude and 110°27'28.58" East Longitude. According to NASA Prediction of Worldwide Energy Resources data, sun insolation in 2019 in this area is 5,59 kWh/m2/day. Moreover, Semarang city ambient temperature data is collected also. The data mentioned above can be used to generate the result of potential electricity production of a rooftop solar power plant in the research area [19] (Table 1).
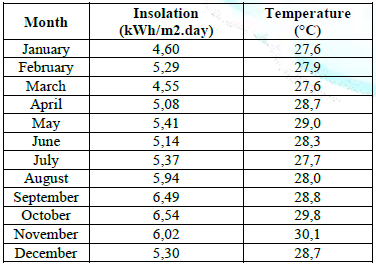
Table 1: Monthly insolation and temperature in site location.
According to the real condition in the research area, the planning of the Rooftop Solar Power Plant utilizes a fixed tilted plane with such adjustment to the rooftop condition for about 30° slope and -100° azimuth (Figure 3).
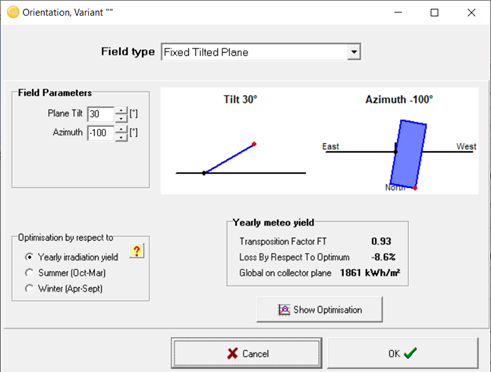
Figure 3: Solar module orientation.
The major components are solar panels and inverters. Each component consists of two alternative options. Solar Panel alternative option is polycrystalline or monocrystalline solar panel with 405 Wp capacity, while the inverter alternative option chosen for this research is an inverter with more than 97% efficiency. The alternative component options used for Solar Power Plant will be assigned into PVSyst 6.43 software and it will be stimulated in the Rooftop Solar Power Plant planning as explained below (Table 2-5).
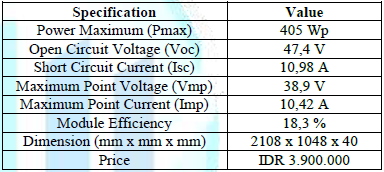
Table 2: Solar PanelSpecification Variation 1 (Canadian Solar CS3W405P).
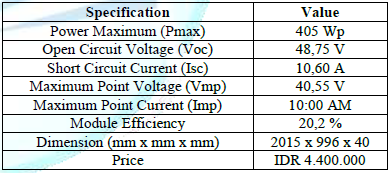
Table 3: Solar panel specification variaton 2 (Risen Solar RSM144-6- 405M).
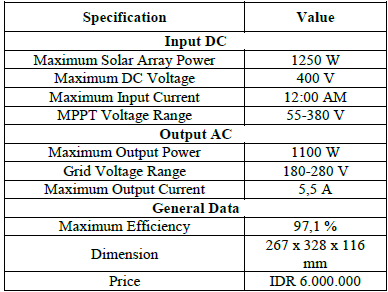
Table 4: Inverter specification variation 1 (Solax X1-1.1-S).
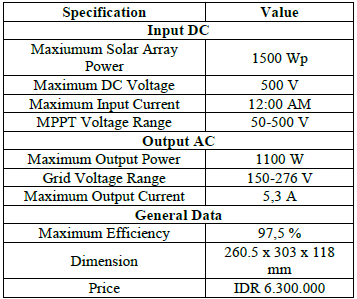
Table 5: Inverter specification variation 2 (Sofar 1,1 kW).
According to component alternatives above, Rooftop Solar Power Plant that will be stimulated have four different configurations as shown in Table 6 below.
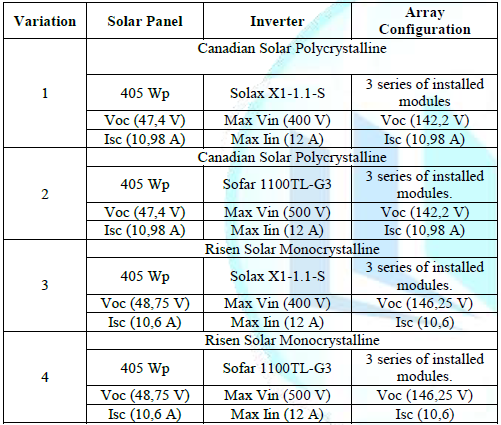
Table 6: Solar power plant variation.
Estimated daily load data in the research area is generated manually and periodically to obtain an exact daily load profile data. The research area has an installed electrical capacity of 1300VA. The following figure will display the daily load profile in the research area (Figure 4,5).
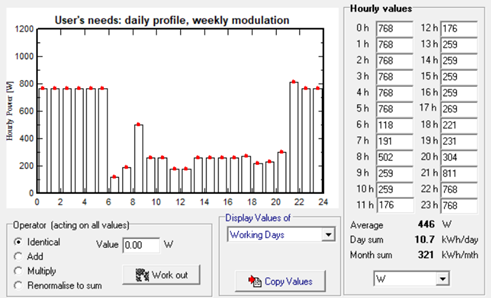
Figure 4: Daily hourly profile distribution in the research area Working Days.
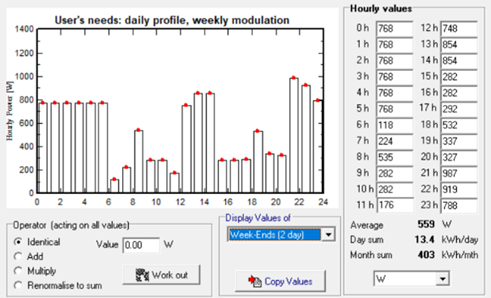
Figure 5: Daily hourly profile distribution in the research area Week Ends.
The simulation utilizing PVSyst 6.43
software can be conducted after determining and inputting all data.
Results
The result of PVSyst 6.43 simulation on household-scale rooftop solar power plant planning variations 1, 2, 3, and 4 can be seen in the figures below (Figures 6-9).
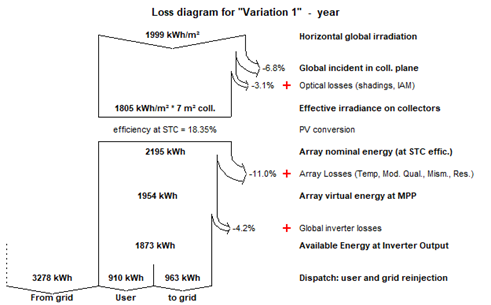
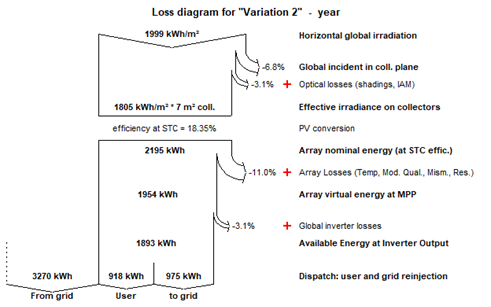
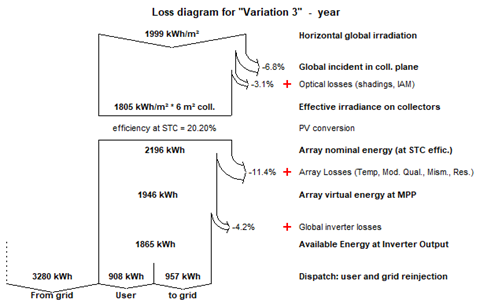
Figure 8: Variation 3 Results.
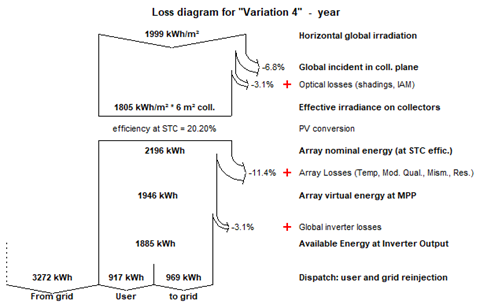
Figure 9: Variation 2 Results.
Technical Analysis
Based on the simulation results of PVSyst 6.43 software of each household-scale rooftop solar power plant in the research area, Table 7 is aimed to show each variations results as follows.

Table 7: The result of PVSyst 6.43 simulation in Rooftop Solar Power Plant Variation 1, 2, 3, and 4.
It can be concluded from Table 8
that the production sunray array electric energy production in variation 1 and
2 have smaller value in the amount of 2195 KWh per year rather than the variation
3 and 4 which equal to 2196 KWh per year. Thus, it has 1 KWh deviation caused
by the solar panel efficiency and surface area used in this research. The
variation 1 and 2 utilize Canadian Solar Panel type CS3W405P with an efficiency
value of 18.3% and it has surface area of 6,63 m2 which produces
electrical energy output array of 2195 KWh during STC condition.
On the other hand, the variation 3
and 4 utilize Risen Solar Panel with an efficiency value of 20,2% and it has
surface area of 6,02 m2 which produces electrical energy output array of 2196
KWh. Therefore, it can be concluded that the greater solar panel efficiency and
the larger solar panel surface area will be resulting in better results. The
efficiency is also depending on the type of solar panel. Monocrystalline solar
panel types generally have better efficiency because the primary material for
making panel which is silicone has greater concentration rather than the
polycrystalline type [20].
However, at the same rated power,
monocrystalline types have smaller panel surface area than the polycrystalline
types. The annual array output for electrical energy in variation 1 and 2
suffered losses from STC conditions of 241 kWh from the STC condition so it
becomes 1954 kWh. Moreover, the annual array output for electrical energy in
variation 3 and 4 suffered losses from STC conditions of 250 kWh from the STC
condition so it results of 1946 kWh. It can be said that these solar panel
types have similar losses characteristics for about 9 kWh adrift. If variation
1 and 2 is compared by also looking at the same type of panels, the output
electric energy in variation 2 is larger than variation 1. This due to the
usage of Sofar Inverter which has efficiency rate of 97.5% in variation 2 is
bigger than the usage of Solax inverter X1-1.1-S type which has efficiency rate
of 97.1%.
This also can be seen in variation 3
and 4. The output electric energy in variation 4 is larger than variation 2.
This due to the usage of Sofar Inverter which has efficiency rate of 97.5% in
variation 4 is bigger than the usage of Solax inverter X1-1.1-S type which has
efficiency rate of 97.1%. Hence, it could be said that the inverter with a
bigger efficiency produces a bigger electrical output as well. It can be
concluded that the variation with the biggest performance ratio is variation 2
which has 83.7% ratio, and the smallest performance ratio is variation 3 which
has 82,4% ratio.
Economic Analysis
The feasibility of the rooftop solar
power plant that will be designed in the research area will be determined by
Net Present Value (NPV) and Benefit Cost Ratio (BCR). While, the best variation
will be determined Payback Period (PP) dan Internal Rate of Return (IRR)
method. The simulation result is affected by the total investment costs,
operational costs, saving costs and electricity sales, discount rates, and
inflation values.
The total investment cost of each variation is obtained from surveys to several offline stores in Semarang city and also numerous e-commerce stores in Indonesia, while the discount rate and inflation value are obtained from the official website of Bank Indonesia [21]. The investment costs for each component in the design of a household-scale rooftop solar power plant system variations 1, 2, 3, and 4, can be seen in the Tables 8-11 below.

Table 8: Initial investment cost of Rooftop Solar Power Plant Variation 1.
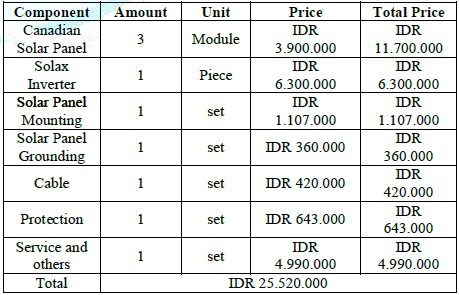
Table 9: Initial investment cost of Rooftop Solar Power Plant Variation 2.
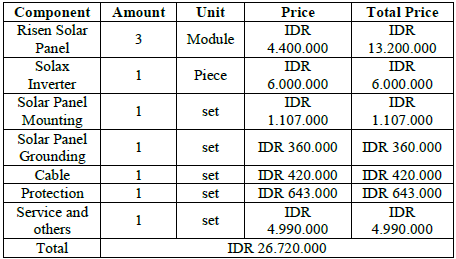
Table 10: Initial investment cost of Rooftop Solar Power Plant Variation 3.
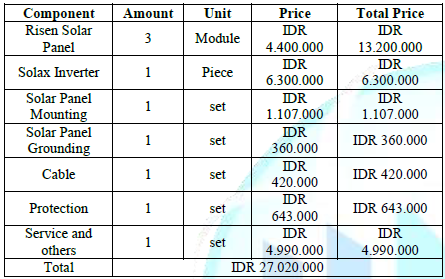
Table 11: Initial investment cost of Rooftop Solar Power Plant Variation 4.
After the initial investment cost is calculated, then the annual operational and maintenance cost will be estimated. The estimated cost of the Solar Power Plant system will be approximately 1-2% from the total initial investment cost so that the annual operational cost estimation can be seen in tables 12, 13, 14, and 15 below.

Table 12: Operational Cost of Solar Power Plant system Variation 1.
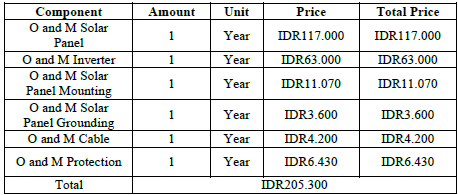
Table 13: Operational Cost of Solar Power Plant system Variation 2.
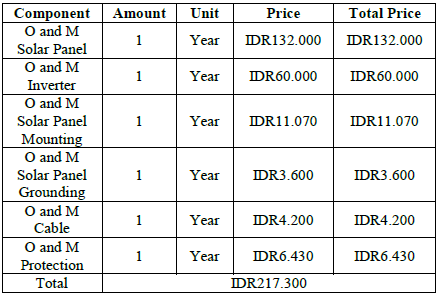
Table 14: Operational Cost of Solar Power Plant system Variation 3.
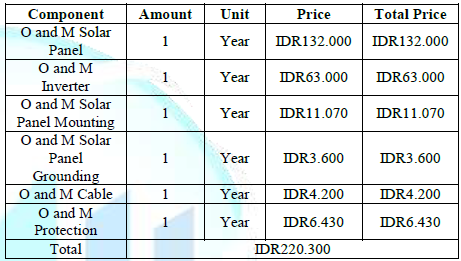
Table 15: Operational Cost of Solar Power Plant system Variation 4.
According to Minister of Energy and
Mineral Resources Regulation No. 49 in 2018 article 6, it is stated that the
electrical energy from Rooftop Solar Power Plant usage by PLN customers will be
calculated based on the export kWh recorded on the export-import kWh meter
multiplied by 65% of the applicable electricity tariff.
For the building as the research area is included in the S1 type, the applicable tariff would be IDR 1.467/kWh. Therefore, 65% of IDR1.467/kWh is IDR 953,55/kWh. This resulting in the estimated annual electricity savings and sales variation that can be seen in tables 16, 17, 18, and 19 as follows.
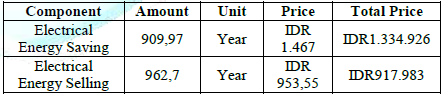
Table 16: Solar Power Plant system Revenue Variation 1.
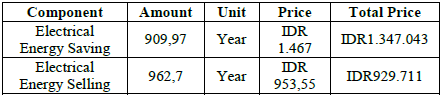
Table 17: Solar Power Plant system Revenue Variation 2.
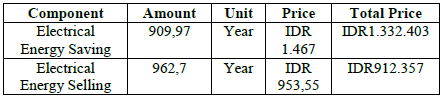
Table 18: Solar Power Plant system Revenue Variation 3.
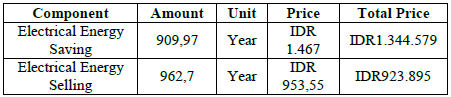
Table 19: Solar Power Plant system Revenue Variation 4.
The implied electrical energy saving is electricity produced from solar panel and it is used separately to supply the home loads needs in accordance with the PVSyst 6.43 software simulation result, whereas the intended electrical energy selling is electricity produced from solar panels and distributed to the grids. By using simulation results, the NPV, BCR, PP, and IRR values for each variation are as follows.
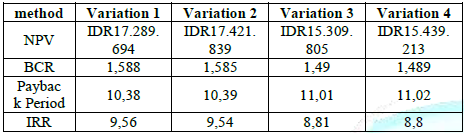
Table 20: NPV, BCR, PP and IRR value Variation 1, 2, 3 and 4.
According to Table 20, it is shown
that NPV value in each variations has more than 0 value dan BCR in each
variation has more than 1 value. Therefore, it can be said that the
housing-scale rooftop solar power plant investment for each variations are
feasible. While the best variation is variation 1 because it has smallest PP
value dan biggest IRR value compared to other variations.
Conclusions
The solar power plant system designed in this research is connected to the grid. The rooftop solar power plant planning has four different variations which utilizes 3 solar panels with a capacity of 405 Wp and a 1100 W inverter. The electricity produced from this household-scale rooftop solar power plant in the research area is ranging from 1865-1893 kWh with a performance ratio ranging from 82,4-83.7%. Based on the performance ratio result, the most efficient variation is variation 2 with an 83.7% performance ratio value. Each of these planning variations are also economically feasible because it has an NPV value above 0 and BCR value above , while the best variation is variation 1 because it has smallest PP value dan biggest IRR value compared to other variations.
References
- Kusumaningrum
SN. The Sensitivity of Residential Electricity Demand in Indonesia (2018)
Signifikan J Ilmu Ekon 7: 247-266 https://doi.org/10.15408/sjie.v7i2.6048
- Suharyati S,
Pambudi SH, Wibowo JL and Pratiwi NI. Outlook Energi Indonesia (2019).
- Owusu PA and
Sarkodie AS. A review of renewable energy sources, sustainability issues and
climate change mitigation (2016) Cogent Eng 3. https://doi.org/10.1080/23311916.2016.1167990
- Presidential
Regulation of the Republic of Indonesia Number 4 of 2016 concerning the
Acceleration of Electricity Infrastructure Development (2016) President of the
Republic of Indonesia.
- Regulation of minister of energy and mineral resource the
republic of Indonesia (2017) minister of energy and mineral resources
the republic of Indonesia.
- Regulation
of the Minister of Energy and Mineral Resources Number 49 of 2018 concerning
Use of Rooftop Solar Power Generation Systems by Consumers of PT Perusahaan
Listrik Negara (Persero) (2018) 1-18.
- Dennis H.
The Global Energy Balance in Global Physical Climatology (2016) pp-25-48.
- Windarta J,
Denis, Nugroho A and Bagaskoro B. Design and Analysis of Technical Economics of
Off-grid Systems Solar Power Plant Using Homer at Cemara Island, Brebes Regency
(2019) E3S Web Conf 125:2-7. https://doi.org/10.1051/e3sconf/201912511002
- Windarta J,
Pratama A, Denis and Nugroho A. Testing of Solar Power Plant Components
Off-Grid Systems and Engineering Economic Analysis at Cemara Island, Brebes
Regency, Indonesia (2019) E3S Web Conf 125. https://doi.org/10.1051/e3sconf/201912510003
- Setiawan AIK,
Kumara SIN and Sukerayasa IW. Economic Analysis of Electricity Sales Tariff for
1 MWp Solar Power in Bangli Using the Life Cycle Cost Method (2014) Maj Ilm
Teknol Elektro 13: 27-33. https://doi.org/10.24843/mite.1502.18
- Palanichamy
C and Goh A. Solar power for energy sustainability and environmental
friendliness of Curtin University Sarawak (2016) IOP Conf Ser Mater Sci Eng 121.
https://doi.org/10.1088/1757-899x/121/1/012011
- King DL,
Boyson, William E and Kratochvil J. Experimental optimization of the
performance and reliability of stand-alone photovoltaic systems (2002) Conference
Record of the Twenty-Ninth IEEE Photovoltaic Specialists Conference, United
States, pp-1356-1361. https://doi.org/10.1109/pvsc.2002.1190877
- Mustafa RJ,
Gomaa MR, Al-Dhaifallah M and Rezk H. Environmental impacts on the performance
of solar photovoltaic systems (2020) Sustain 12: 1-17. https://doi.org/10.3390/su12020608
- Jordan DC
and Kurtz SR. Photovoltaic degradation rates-An Analytical Review (2013) Prog
Photovoltaics Res Appl 21: 12-29 https://doi.org/10.1002/pip.1182
- Reich NH, Mueller
B, Armbruster A, Kiefer K, and et al. Performance ratio revisited: is PR >
90% realistic? (2012) Prog Photovoltaics Res Appl 20:7-726. https://doi.org/10.1002/pip.1219
- Utility-Scale
Solar photovoltaic power plants a project developer’s guide (2015) United
States.
- Pujawan IN
and Edisi TE. Yogyakarta: LAUTAN PUSTAKA, (2019).
- Giatman M
and Teknik E (2011) [3rd Ed] Jakarta: PT RajaGrafindo Persada.
- “NASA Prediction of Worldwide Energy
Resources.”
- Bagher AM.
Types of Solar Cells and Application (2015) Am J Opt Photonics 3: 94-113.
- Monetary Data Bank Indonesia.
Corresponding author
Jaka
Windarta, Associate Professor, Semarang, Indonesia, Tel: +62 821-3104-8558, E-mail:
jakawindarta@lecturer.undip.ac.id
Citation
Windarta J, Saptadi S, Denis, Satrio AD and Silaen S. Technical
and economical feasibility analysis on household-scale rooftop solar power
plant design with on-grid system in Semarang city (2021) Edelweiss
Appli Sci Tech 5: 14-20.
Keywords
Benefit cost ratio, Internal rate of return, Net
present value, Payback period, PVSyst 6.43, Solar Power Plant.
