
 PDF
PDF
Introduction
The faba bean
(Vicia faba L) belongs to the legume
family. It is one of the large families. Its genera is estimated at 727 and
19325 plant species. It is considered one of the most important crops because
its seeds contain a high percentage of protein, ranging between 23-37%. In addition
to containing quantities of soil, starch and some vitamins, plant residues are
used after harvest as animal fodder or their dry seeds are used as a source of
carbohydrate Ca, P, Fe, thyamin, neyasin, ascorbic acid and protein [1], in
addition to being an important source for improving soil properties by fixing
atmospheric nitrogen with root ganglia bacteria that coexist. Including FAO
(2003) [2]. The bean plant also contains a number of amino acids, carbohydrates
and vitamins. It is also used in the treatment of many pathological conditions
such as kidney failure, kidney stones and eye diseases [3]. The genus Vicia faba L. is characterized by a lower number of
chromosomes than other types of the genus (2N = 12), as the genome size is
13000 Mbp Genome. [4]. Studying the genetic dimension or genetic variation is
an important step for the success of breeding programs in developing cultivars
Distinguishing and knowing the degree of genetic kinship and the development of
new strains Al-Ghamdi (2009) [5] has also published many studies and research
that used molecular indicators in genetic selection or genetic purity of plant
varieties and strains.
Randomly Amplified Polymorphic (RAPD) indicators were used for this purpose and used this technique for its ease and accuracy And the possibility of detecting the largest area of the plant genome and its low cost compared to other indicators [6,7] where RAPD-PCR indicators contribute to early detection and selection of the desired strains and genotypes for field crops by identifying varieties that prove their superiority even before planting them in a faster and more efficient way compared to traditional methods Al-Sakmani et al. (2018) [8], and the bean plant is distinguished by a wide range of genetic variances as well About the lack of molecular studies of the barley in the Iraqi country, especially the genetic structures and the varieties whose cultivation began to spread in the city of Mosul. That is why we decided to conduct this molecular study of genetic indicators in the bean to determine the variance and genetic imprint of the studied genotypes and to find the genetic dimension to it.
Materials and working methods
Sample
collection
The plant samples represented by the young leaves of
the genotypes of the bean were collected after a month and a half, i.e. 45 days
from the date of planting, in the vegetable research fields of the Department
of Horticulture and Landscaping, College of Agriculture and Forestry,
University of Mosul, during the agricultural season of fall 2020/2021, the
seeds for all genotypes were sowing at 15th November 2021 [3]. 4-5 young leaves
were taken from the developing apex and placed in sterile bags, then they were
transferred to the laboratory directly to conduct the process of DNA isolation
from them according to the method [9,10] as shown in Table 1.
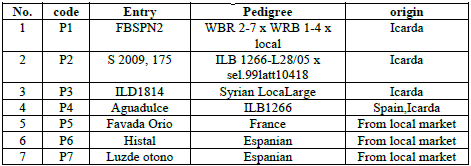
Table 1: The genotypes used in the study and their symbols used.
Genome DNA extraction
DNA was extracted from young leaves using the Kit method, according to Shehab (2020) [11], after which the DNA was purified and examined, i.e. the so-called quality control tests, which included three stages: The first stage was to determine the concentration of the extracted DNA, and the second stage included determining its purity. The DNA extracted by reading the absorbance using a Bionanodrop spectrometer at the wavelength (260-280) nm, respectively, where the third stage included the migration of DNA within the agarose gel and 13 ten starters were used as shown in Table (2).
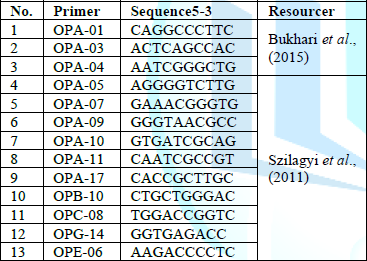
Table 2 shows the random prefixes used in the study.
Performing RAPD-PCR reactions
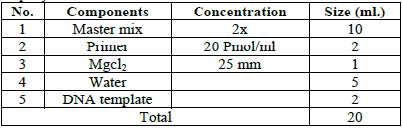
The indicators of random amplification prepared by the Korean Macrogen
company and shown in Table (3) were
used, and the volumes and concentrations of the amplification mixture were
determined according to the instructions of the Korean Macrogen company.
The
reaction components were mixed using a micro centrifuge for 5 seconds, then the
samples were placed in the thermo cycle to Perform Random Amplification (PCR)
by applying the program that is specified in the device for all subsequent
reactions and for all the studied genotypes [12]. After the amplification
process, samples that will be electrophoresed were prepared and prepared by
mixing (4) microliters of DNA Ladder from 2 microliters of loading dye, which
are placed in specific holes on one side of the agarose, and then 0.5
microliters of the polymerase chain products are withdrawn PCR is carried out
in karose pits without dye because it has a special color. Then the
electrophoresis is carried out at 80 volts for 60 minutes. After the migration
is completed, the gel is transferred and immersed in a water basin containing
distilled water, then exposed to a UV source on a UV-Transilluminotor, and then
photographed Gel using a high-resolution digital camera.
Statistical analysis
Estimation
of the relative efficiency and discriminatory ability of RAPD primers: the
efficiency of each primer was calculated by the equation of Grudman et al.
(1995) [13].
Efficiency
= Number of packets per initiator / Total number of multiply packets per
initiator x 100
While the
discriminating ability was calculated based on the following equation:
Discriminative
power = (Number of differentiated packets per prefix / Total number of variant
packets of all prefixes) x 100
Genetic estimation
The
genetic dimension of the studied genotypes was calculated and estimated by
converting the results of the RAPD indicators that appeared into tables by
placing (1) for the presence of the bundle and (0) for the absence and absence
of the bundle, in order to find the genetic relationship between the genotypes.
Statistical analyzes were also conducted by computer using the program
mentioned by Rohlf (1993) [14].
Results and Discussion
This study was used to find the genetic fingerprint and genetic
dimension for seven genotypes of bean using RAPD-PCR indicators (13) for
primers on genome sites and to produce different packages, revealed on agarose
gel, where all the primers used showed different packages between general and
differentiated and that the use of a large number One of the primers in the
RADP indicators is an indicator for increasing the high accuracy in deviating
the genetic dimension, and this agrees with Tahi (2015) [15] in his study using
18 primers, of which 16 were primers that produced differentiated bundles and
two initiators that produced general bundles for ten genotypes of bean, and
this is in agreement with most researchers who used indicators The RAPD in the
study of genetic variance [16-18).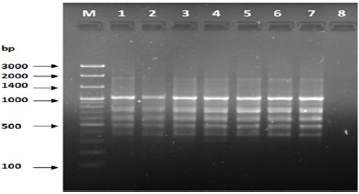
Figure 1: PCR for primer OPA-01.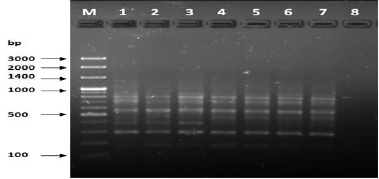
Figure 2: PCR for primer OPA-03.
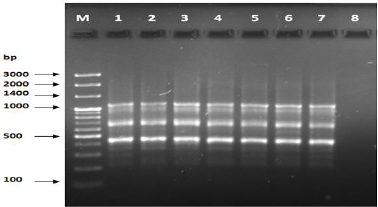
Figure 3: PCR for primer OPA-04.
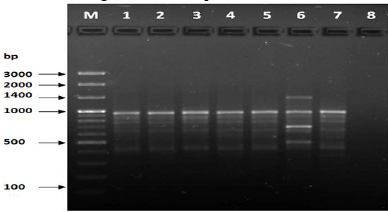
Figure 4: PCR for primer OPA-05.
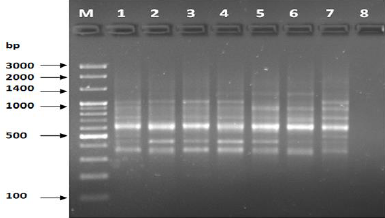
Figure 5: PCR of primer OPA-07.
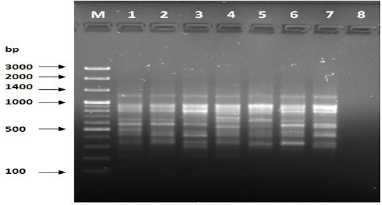
Figure 6: PCR of primer OPA-09.
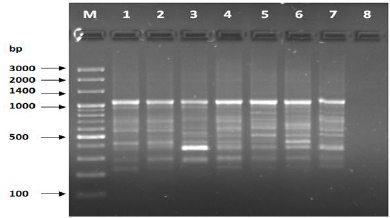
Figure 7: PCR of primer OPC-10.
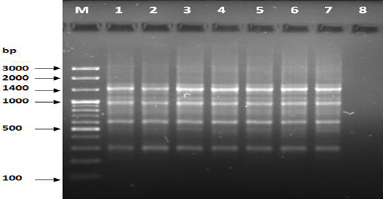
Figure 8: PCR of primer OPC-11.
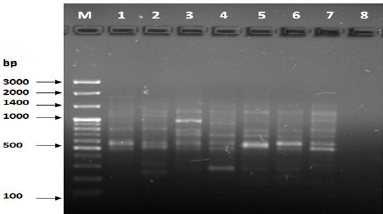
Figure 9: PCR for primer OPB-17.
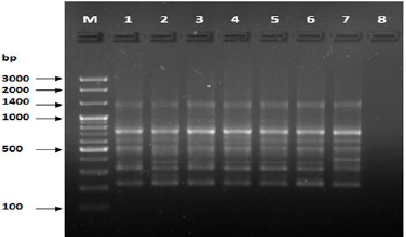
Figure 10: PCR for primer OPB-10.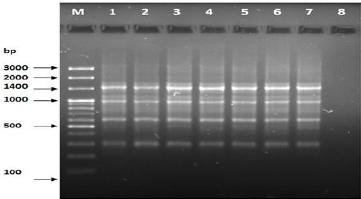
Figure 11: PCR for primer OPG-08.
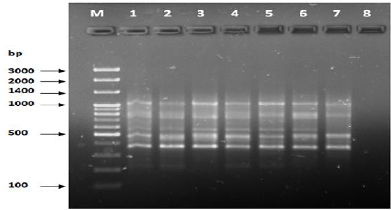
Figure 12: PCR for primer OPG-14.
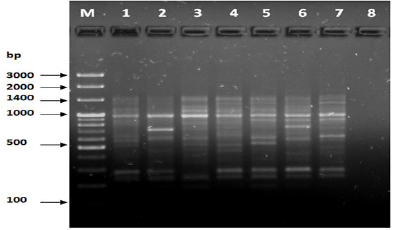
Figure 13: PCR forprimer OPE-06.
Prefix results
The results of the used primers shown in Table (4) showed different types of packages, so the overall total of the sites that were exposed to the primers on the samples was (170) sites at a rate of (13.1) packages for each initiator, (48) of which are general sites and at a rate of (3.6) for each initiator and (122) Mutbaniya sites with a rate of (9.4) packets for each initiator. The initiator OPE-6 was distinguished by the highest number of sites that produced it, which amounted to (16) sites, while the initiators OPA-1, OPA-7 and OPG-14 recorded the least production of sites and amounted to (7) Location as shown in pictures (1, 3, 6, 12). The greater the number of divergent bundles, the greater the efficiency of the primers in determining the genetic dimension and the possibility of obtaining the genetic fingerprint of the genotypes, and this is consistent with the study of Bashher (2012) [19] which studied the imprint on 26 varieties of bean using 11 primers on the RAPD indicators, as the average of the bundles was (8.5) For each initiator, the average of the differentiated bundles is (5.5) packets. Variation occurs as a result of the occurrence of self-mutations or induced mutations that affected the distance between sites. Genetics that occur naturally during the evolutionary process of living organisms and variation may have occurred as a result of deletion or addition at the site that binds Tingey, (1993) [20]. In addition, the total number of total bands that were produced from those sites shown in Table 4 is 1002 bands, of which 417 are general bands and 585 are polymorphic bands, as the initiator OPE-6 produced the highest number of packages produced amounted to 102 bands and the lowest number of packages for the initiator OPA -5 It reached 62 bundles, and the general variation rate of the produced primers was 56%.
One of
the foundations on which the RAPD indicators depend is the number of bundles
that a genome appears, which in turn represents the number of sites that the
initiator finds and is associated with. The initiator Accordingly, the
estimated statistics in this field indicated short random primers (9-15) bases
that can be assigned (2-10) sites on the DNA of the genome of higher organisms
such as plants, Borovkova et al.,( 1997) [21]. Some genotypes were also
distinguished by distinct bands (Unique bands) and Absalt bands, which are
shown in Table 5. The total of
distinct bands resulting from the initiators in the study was 28 distinct
bands, 13 of which were unique bands and 15 absent bands, where the P4 genotype
obtained the highest percentage. Of the unique bundles that reached 4 bundles,
while the genotype P5 did not have unique bundles, and the absent bundles were
characterized by the genotypes P2, P4 and P7 with the highest number of those
bundles, which reached 3 bundles, in contrast, the genotype P1 did not have an
absent bundle. Those bundles were distinguished Distinguishing and diagnostic
characteristic of these genotypes because only those bundles appear in one
structure, and this indicates a mutation in a particular site that led to the
recognition of the initiator and the emergence of the unique bundle. As for the
absent bundles, as well as the occurrence of a mutation in the locus of only
recognizing the initiator in one genotype. Some previous researchers (Hormaza et
al., 1998 [22], Al-Assi, 2002 [16] and Al-Qaisi, 2013) [17].
The produced primers also varied in the resulting bundle sizes shown in Table (5), they ranged between bp (1925-130), the lowest molecular size bp (130) in the OPB-6 initiator, while the highest molecular size was bp (1925) for the opa-17 primer, and the efficiency of the primers also varied. Proficiency in showing the variance between the studied genotypes was less efficient for the primers (OPG-14, OPA-4, OPA-1), which amounted to 5.73, while the highest efficiency was for the initiator OPE-6, which amounted to 3.11, which is shown in the pictures (2, 3, 4). Ability discriminatory for starters The OPG-6 initiator distinguished the highest discriminatory ability which was 17.57, while it was (0) zero in the OPA-4 initiator because the initiator did not show different sites. From the results of the above RAPD, it was found that these primers have varying efficiency, but most of these primers had an appropriate efficiency, and as a result, the efficiency of the initiator may increase with the increase in the number of sites and the resulting bundles. Study through the resulting divergent beams Khierallah et al., (2014) [23].
Estimation of the genetic dimension
based on RAPD indicators
The genetic distance was estimated from the results of the interactions
of RAPD indicators among the studied cultivars of the bean using the NTSYS-PC
genetic program. Version 210, which depends on the presence of bundles common
to each genotype under study, and depends in its analyzes on the equation
mentioned by (Nei et al, 1979) [24]. Table 6 shows the values of genetic dimensions for the studied
genotypes using 13 random RAPD primers. Between two structures, this indicates
that the genetic distance between them should be equal to zero, and Table 7
shows the values of genetic similarity, as it represents the measure of the
degree of genetic similarity or similarity between any two structures [23]. It
was found through the values of the genetic dimension referred to in Table 6
that the values of the genetic dimension ranged between (0.110-0.269), where
the lowest genetic dimension was between the structures P1 and P2, where it
reached 0.110 and this is the highest similarity between the two structures,
while the highest genetic dimension reached 0.269 between the structures
genotypes (P6, P2) (P7, P2) This is the least genetic similarity between the
genotypes among those values.
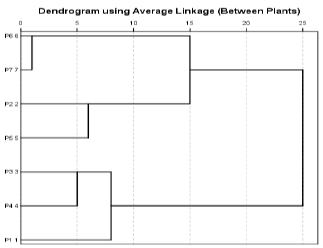
Cluster analysis
The studied genotypes were arranged based on the values of the genetic dimension, the genetic kinship tree, or the dendogram, and it depends on the genetic range in which the main groups are related, and therefore the presence of a section of the genotypes in a particular group indicates the extent of the similar genetic quantity to those genotypes in that group [25,26] Chart 1 shows a group analysis group for the synthesis of the genotypes of Bean Vicia faba L using cluster analysis, as it showed the genetic relationship between the studied structures using RAPD indicators, and it was found that they are divided into two main groups A and B, where group A was divided into two groups Major subgroup A1, A2, A1 included genotypes P7, P6, and major subgroup A2 included genotypes P5, P2 The second major group B was divided into two main subgroups B1, B2, where group B1 included genotypes P4, P3 and subgroup B2 included genotype P1 only. Through these results, it was found that there is a degree of genetic similarity and clarity between the genotypes under study. The reason is due to two things. The first may be the differences between some structures in the phenotype, which is the result of the influence of the environment, while the second matter may show a genetically high similarity between the structures that does not correspond to the phenotype. The reason for this is due to the non-coding regions of Abboud 2014, which is in agreement with many researchers, such as the study of (Tahir, 2015) [15], where he studied the genetic variation of ten varieties of broad beans cultured in Sulaymaniyah using 18 random primers in RAPD indicators, as well as the study of Basheer et al. 2012, [19] in which RAPD indicators were used to find the genetic variance of 26 cultivars of bean cultivars from different locations in Palestine using 26 random primers. It follows from this that the higher the number of primers used, the greater the efficiency of the indicator in determining genetic fingerprint and determining the genetic dimension, as the Increase in the number of Primers increase the number of linking regions according to the sequence of the primer used.
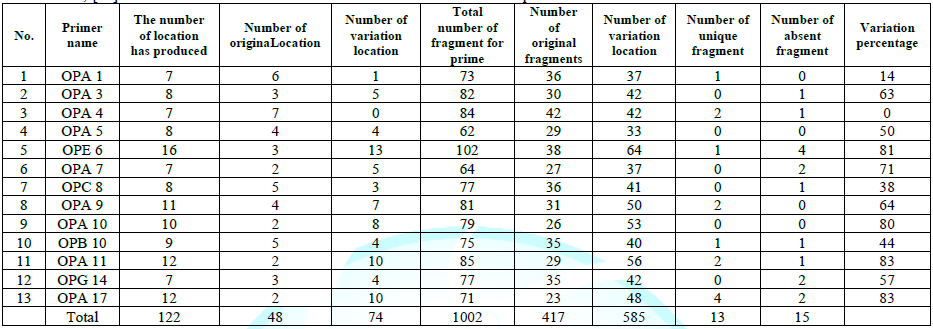
Table 4: Results of the primers usedin RAPD reactions.
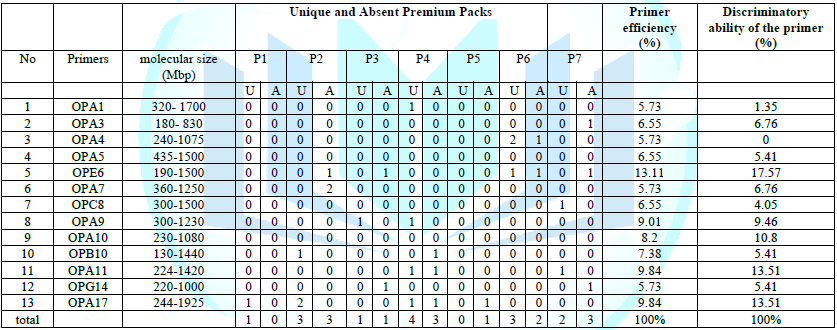
Table 5: Distinguishing
packets, primer efficiency, and discriminating ability of the primer used.
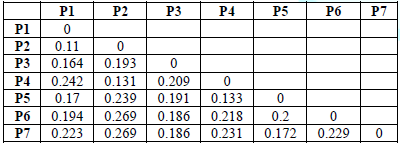
Table 6:Values of the
genetic dimension of the genotypes of the bean plant.
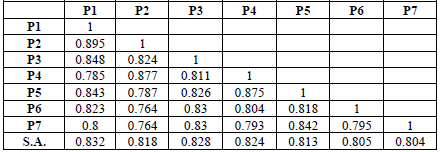
Table 7: Genetic similarity values for the genotypes of Beans.
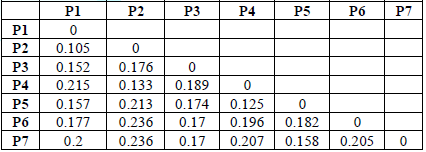
Table 8: values of genetic variation for the genotypes of the bean.
What determines the genetic proximity or distance between genotypes is the number of shared bundles, the greater the number of those the bundles say the genetic dimension. Those shared bundles indicate a similarity in the genetic material in that region of the genome for the studied genotypes, which may represent the similarity in phenotypic traits or in other traits related to productivity, reproduction, resistance to diseases, or similarity in genetic structure to the requirements of an environment suitable for growth or other characteristics other traits.
Conclusion
This study indicates that the primers used produced (1002) packages of them (417 normal bundles and (585) mixed bundles, The ILB1266 genotype showed the highest number of unique bundles, which It reached 4 bundles, The Dendrogram shows the separation of the studied genotypes into two main groups, and each of them into two subgroups.
Acknowledgments
The authors would like to express their utmost thanks to the Univ. of
Mosul/College of Agriculture and Forestry for the facilities they have provided
that have been helpful in improving this research paper's quality, and for DNA
laboratory for analysis of DNA.
References
1. Hassan A Abd Moneim (2002). Production of leguminous vegetables, series of vegetable crops, production technology and advanced agricultural practices, Arab House for Publishing and Distribution, Nasr City, Arab Egypt, number of pages: 422.(In Arabic).
2. FAO. Data base, Rome.Italy Future Opportunities Field
Crops (2003) 26: 141-169.
3. Jaree AN, Khayoun A, Ab-Alsaeed and Hataf HJ. Effect
of planting date and spraying of Argenin of growth and yield in bean (Vicia
faba L. ) (2014) Journal of Basra University of agricultural Sciences.
4. Rispail N, Kato P, Kiss GB, Ellis TH, Gallardo K, et
al. ModeLegumes contribute to faba bean breeding (2010) Field Crops Res 115:
253-269. https://doi.org/10.1016/j.fcr.2009.03.014
5. Al-Ghamdi S and bin SH. The application of
biotechnology in improving field crops (beans) (2009) Ph. D. thesis, College of
Science, King Saud University, Kingdom of Saudi Arabia.
6. Ameer HA. Using rapd markers to analysis genetic
variation of some species of the genus alternaria (2009) Ms.Sc. Thesis.College
of Education.University of Tikrit.Iraq.
7. AL-Zaidy MR, Yosif SA and Najum NA. The use of random
amplified polymorphic DNA technigue in identification some of the phoenix
dactylifera L. cultivars in Iraq (2016) Journal of Diyala Sciences 1: 67-77.
8. Al-Sakmany RZ, Al-Assie AH and AL-Juburi GM.
Determinal genetic finger and genetic distance of some genotype of Vicia
faba L. by using RAPD-PCR markers
(2018) International Conference,College of Sciences, University of Tikrit.IRAQ
9. Sarhan SF, Hamed W, Al-Youssef, Mater E and AboTafesh N. Molecular characterization of some almond cultivars and rootstocks Syria.using SSR markers (2015) Journal of Damascus University Agricultural Sciences 31: 142-158. http://dx.doi.org/10.1007/s00606-011-0536-x
10. AL-Jumaily BHA. Acompartive systemalic study of the Prunus persica
L. Batch (Rosaceae) cultivars cultivated in Mosul (2015) Ph. D. Thesis College
of Education,University of Mosul Iraq.
11. Shahab MA. Acompartive systematic study cultivars species of the genus
pyrus L. (Rosaceae) cultivated in north of Iraq (2020) Ph. D. Thesis College of
Education Pure Science University of Mosul, Iraq.
12. Teng YK, Tanabe F, Tamura and Hali A. Genetic relationships of pyrus
species and cultivars native to east asia revealed by randomly amplified
polymorphic dna marker (2002) Jou Amer Soc Hort Sci 127 :262-270.
13. Grudman HC, Schneider D, Hartung FD, Daschner and Pith TL.
Discriminatory power of three DNA typing techniques for plant aeruginosn (1995)
Jou Clin Microbiol 3: 528-532.
14. Rohlf FJ. Numerical taxonomy and multivariate analysis system (1993)
Version 1-8 Exeter software Setanket.
15. Tahir AN. Identification of genetic variation in some faba bean (Vicia faba L )genotypes grow in Iraq estimated with RAPD and SDS-PAGE of seed proteins (2015) Indian journal of biotechnology 14: 351-356. https://doi.org/10.14720/aas.2015.105.1.08
16. AL-Assie AH. Use of DNA markers to amysis denetic diversity of Hordeum
vugare L. Cultivated in Iraq (2002) Ph.D.Thesis, college of Education,
University of Baghdad Iraq
17. Al-Qaisi I Kh. Estimating the genetic action of some field
characteristics in maize zea mays L (2013) Ph. D. Thesis, College of
Agriculture and Forestry, University of Mosul, Iraq (In Arabic).
18. AL-Jubori HMH. Effect of distance between rows on the yield and its
components for some varieties of bean (Vicia faba L. ) (2014) Ms. Sci.
Thesis, University of Kirkuk Iraq.
19. Basheer SR and Awad MW. Genetic diversity of Palestine landraces of faba
bean Vicia faba L based on RAPD markers (2012) Am Journal Plant Sci
3:1241-1251. https://doi.org/10.4238/2013.september.3.8
20. Tingey SV and Tufode JP. Genetic analysis with RAPD markers (1993) Plant
Physiology 101: 349-352. https://doi.org/10.1007/978-3-642-78852-9_45
21. Brovkova IG, Jin Y, Steffenson BJ, Kilian A, Blake TK, et al.
Identification and mapping of leaf rust resistance gene in barley line Q21861
(1997) 40: 236-241. https://doi.org/10.1139/g97-033
22. Harmaza JI, Pinne K and Polito VS. Gentic diversity of pistachio
(Pistacia vera, Anacardiaceae ) germplasm based on randomly polymorphic DNA
(rapd) markers (1998) Economic Botany 51: 78-87. https://doi.org/10.1007/bf02861298
23. Khierallah HSM, Alsammarria SKI and Mohamed HI. Molecular
characterization of some Iraqi data palm cultivars using RAPD and (SSR Markers)
(2014) Journal of Asian Scientific Research 4: 490-503.
24. Nei M and Li WH. Mathmatical model for studying genetic variation in
terms of restriction endo nucleases (1979) Proceeding of the National Academy
of Science U.S.A 74,52,9-5273 c.f.by R. Henry R.J. (1997).
25. Elkichaoui A, Abu Zayed M and Ayesh B. Genotyping and identification od
six data palm (Phonenix dacty-lifera L.) cultivars of the Gaza strip by
random amplification of polymorphic DNA (2013) Emri Journal Food Agric 25:
916-925. https://doi.org/10.9755/ejfa.v25i11.15918
26. AL-Zaubidy MR, Younis SA and Najum NA. The use of
random amplified polymorphic DNA technigue in identification some of the phoenix
dactylifera L. cultivars in Iraq (2016) Journal of Dixala Sciences 1.
Corresponding author
Noor Al-Talab, Dept.of Biology, College of Education for pure Science, University of Mosul /Iraq, Email: noor.nabeel@uomosul.edu.iq
Citation
Al-Talab N, Al-mathidy A and Esho K. Molecular classification of Vicia faba L. genotypes by using rapd-pcr markers (2021) Edelweiss Appli Sci Tech 5: 77-82.Keywords
Molecular, Vicia faba L, Genotypes, RABD,
PCR.
