

Research Article :
Hiroshi Bando, Koji Ebe, Mayumi Hashimoto, Masahiro Bando and Tetsuo Muneta Authors et al. have continued diabetic practice
and research for long, and started Low Carbohydrate Diet (LCD) first in Japan.
We developed social LCD movement by Japanese LCD Promotion Association
(JLCDPA), and proposed petite-, standard-, super LCDs with carbohydrate 40%,
26%, 12%, respectively. Methods included 9 healthy medical staffs and two exams
of 75g Oral Glucose Tolerance Test (OGTT) and Meal Tolerance Test (MTT). MTT
means super-LCD breakfast with carbohydrate 6g. Results showed that blood glucose
/ immunoreactive insulin (IRI) at 0-30 min on average changed 88.0-130.6
mg/dL/5.1-46.5 μU/mL for GTT, and 90.1-86.3 mg/dL/4.8-12.5 μU/mL for MTT. IRI
responses in GTT and MTT were calculated by 3 methods, which are i) increment
(delta), ii) Area Under the Curves (AUC), iii) Multiple (times) of basal value.
Both data from GTT and MTT showed significant correlation in i) and ii)
(p<0.05), but not significant in iii) (p=0.07, n=9). These results suggested
that insulin secretion in MTT would be enough and relatively excessive for 6g
of carbohydrate, leading to relatively decreased glucose at 30 min. Current
analyses methods will become some reference for future development of diabetic
research. Across
the world, diabetes and its complications have brought significant medical and
economic impact [1]. The targets of the influence include individuals, their
families, associations, health systems and nations. Diabetes has been more
prevalent in developing and developed countries [2]. The important aspects of
diabetes would be the presence of chronic complications such as microvascular
and macrovascular disorders [3]. From pathophysiological point of view,
pre-prandial and post-prandial hyperglycemia have been the main cause of
various harmful signs and symptoms. As
to diabetic therapy, fundamental principle has been adequate nutrition.
Formerly, Calorie Restriction (CR) was rather popular. However, recent
recommended treatment would be Low Carbohydrate Diet (LCD), and it has been
more prevalent in health care and medical region [4]. Successively, the
evidence of LCD has been reported by several investigators, including
meta-analysis of randomized controlled trials [5,6]. In recent years, the
beneficial efficacy of LCD has been rather well-known [7]. In
contrast, authors and co-researchers have started LCD first in Japan [8]. We
continued diabetic practice and research, and reported clinical effects of LCD
[9]. Through social LCD movement by Japanese LCD Promotion Association
(JLCDPA), we have proposed practical tips for LCD. They are petite-LCD,
standard-LCD, super-LCD associated with 40%, 26%, 12% of carbohydrate content,
respectively [10]. In addition, our research team has reported various achievements,
such as daily profile of blood glucose, elevated ketone bodies, Continuous
Glucose Monitoring (CGM), Meal Tolerance test (MTT), and others [11,12]. Regarding
the research for MTT, we have already proposed carbo-70 meal test [13]. It uses
traditional Japanese breakfast with CR meal, including carbohydrate 70g [14].
It depends on standard macronutrient ratio of nutrition guideline of Japan
Diabetes Association (JDA) [15]. In recent clinical practice, LCD treatment has
been more highly evaluated from various reports [12,16]. Consequently, we have
tried a pilot study of MTT using LCD breakfast with carbohydrate 6g. In this
study, we have compared the response of insulin for MTT and 75g Oral Glucose
Tolerance Test (OGTT), and describe the results and some discussion. Enrolled
subjects were healthy medical staffs in the hospital, who were 5 males and 4
females with 22-30 years old. They did not have remarkable diseases so far.
Their BMI were all normal. Methods included two examination. One is 75gOGTT
with the measurement of glucose and insulin (immunoreactive insulin, IRI).
Another exam is MTT with the breakfast of LCD. It has 300 kcal with nutrition
element of protein 13g, fat 24g, carbohydrate 6g. Blood glucose and IRI were
also measured similarly. There
tests were performed for 9 same subjects with a week interval. The measurements
included blood glucose at 0, 30 and 120 min and IRI at 0 and 30 min. The
response of IRI for carbohydrate loading were calculated by three methods. They
are i) increment (delta, ⊿) of IRI, ii) Area
Under the Curves (AUC) of IRI, iii) multiple (times) number of IRI to the basal
value. In this study, data were obtained as glucose and IRI values. Correlation
between related factors were investigated. The significant correlation was
judged to be present at the border as p<0.05. This
investigation was basically performed with the ethical principles on the
Declaration of Helsinki. Moreover, some presentation has been conducted by the
Ethical Guidelines for Research for Humans, with the Good Clinical Practice
(GCP). The consideration for the protection of human rights was also present.
“Ethical Guidelines for Epidemiology Research” was also applied as the
guideline. This concept was proposed by the Ministry of Health, Labor and
Welfare and the Ministry of Education, Culture, Sports, Science and Technology
in Japan. The
author and collaborators established the ethical committee in the hospital. The
committee included several experts including physician, nurse, pharmacist,
dietician and legal-specialized person. For current study, the discussion for
the study was performed, and it has decided with all agreements. For enrolled
subjects, informed consents and written documents were obtained from all
subjects. This study has been registered by National University Hospital
Council of Japan (ID: #R000031211). Responses of
glucose and IRI for GTT and MTT were summarized in Table 1. It shows the
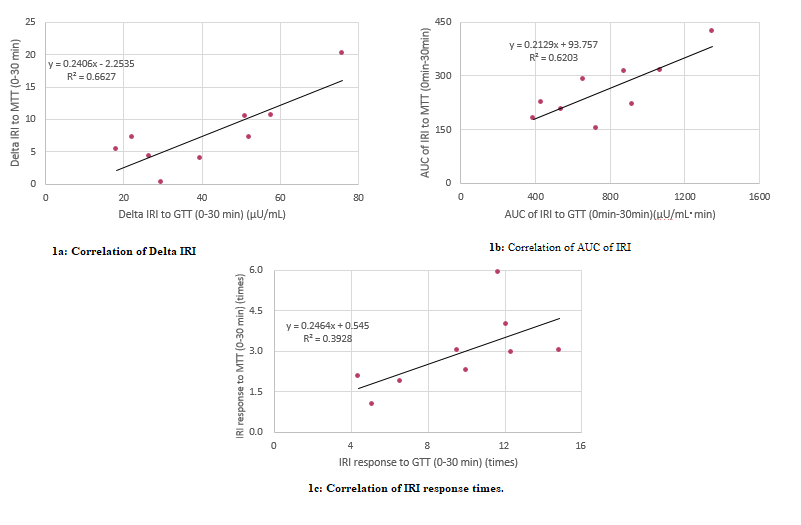
data by mean ± SD and median. Correlation of Delta IRI between GTT and MTT was
shown in Figure 1a. The value R2 equals 0.663, then r=0.814. It means
very strong correlation. Further, correlation of AUC of IRI between GTT and MTT
was shown in Figure 1b. The value R2 equals 0.620, then r=0.787. It also
means very strong correlation. In contrast, correlation of IRI response times
between GTT and MTT was shown in Figure 1c. The value R2 equals 0.393,
then r=0.626. In this case, P value was calculated as 0.071. It means that
there is not significant correlation between them. Table 1: Results of GTT and MTT. Comparison
of 3 statistic methods for investigating the correlation between IRI responses
for GTT and MTT was summarized (Table 2). They are increment (Delta, ⊿),
Area Under the Curve (AUC), and multiple (times) number. As the results, former
two, delta and AUC showed significant correlations with P value 0.007 and
0.012, respectively. Latter method (multiple) showed that correlation
coefficient was 0.626 and P value was 0.071. This value (p=0.071) is close to
the borderline of significant level (p<0.05). American
Diabetes Association (ADA) showed the official comment. Among the
macronutrients of carbohydrate, protein, fat, only carbohydrate influence the
blood glucose level [17]. The authors have been involved in LCD clinical and
research for years [13,18]. Among them, factors related to elevated blood
glucose include i) intake of the amount of carbohydrate, ii) glycemic index
(GI) [19], iii) insulin secretion [20]. From this point of view, current pilot
study seems to be meaningful. Table 2: Comparison of 3 statistic methods. Firstly,
the medical concept of Glycemic Index/Glycemic Load (GI/GL) was proposed by
Jenkins et al., in which there are different carbohydrates for influencing
potential metabolic responses with different Glycemic Responses (GR) [21].
Regulation for human satiety seems to have complex related mechanisms, such as
insulin, glucagon-like peptide 1 (GLP-1), leptin, ghrelin, Cholecystokinin
(CCK), and so on [22]. Concerning
the study of GI and GR, 73 reports out of 445 articles were selected by
systematic PubMed search. The result showed that GI of a food or diet is
unlikely to be linked to disease risk or health outcomes. For the predictors of
health benefits, food patterns would be more related to dietary guidance [23].
In the case of rice, GI may vary remarkably by the condition of rice, cooking
and processing method from the data of 7-132 [24]. In addition, postprandial
increases of glucose and IRI are reduced with the presence of protein [25]. In
current study, the subjects were young and healthy, and blood glucose and
insulin responses to 75g OGTT were found as expected. MTT was conducted using
an LCD breakfast containing carbohydrate 6g. As a result, significant insulin
secretion was observed and the blood glucose at 30 min tended to be lower than
0 min, which was impressive finding. This suggested that sufficient amount of
insulin would be secreted from the β cells of the pancreas. For
9 subjects of this study, insulin secretory pattern was checked in detail. In 6
subjects, additional secretory phase I seemed to be 2 to 3 times more than the
basal secretion. It is thought that this insulin secretion decreased the blood
glucose at 30 min, and that its efficacy for carbohydrate 6 g was fully covered
and exceeded. In 1 subject, the first-phase insulin was low (1.03 times) at 30
min, but abrupt and more than twice secretion of insulin was suggested to be
present at 15 to 25 minutes just after intaking LCD meal [26]. As
a reference, there is a breakfast formula for MTT, which has 56g of
carbohydrate [27]. It covers three main macronutrients with carbohydrate 50%,
fat 35%, protein 15% and 450 kcal. This is a trial of international standard
model for nutritional research and practice [27]. Another protocol meal for MTT
is high-protein Boost-HP. It contains protein 15g, fat 6g, carbohydrate 33g,
237 ml with the nutritional balance as 25:20:55 of PFC ratio [28]. In recent
study, subjects ingested 6 mL/kg of Boost meal solution for MTT with maximum
360 mL [29]. Among our diabetic research, there was a report of MMT with
carbohydrate 70g [13]. By standard CR formula of Japan Diabetes Association
(JDA), we prepared useful breakfast including rice, egg, vegetable in Japanese
style [15]. The study included 48 patients with T2DM, which were categorized by
HbA1c level into high, middle and low groups. Middle group showed the following
data: HbA1c 7.8%, blood glucose was from 166 mg/dL to 203 mg/dL, IRI was from
4.5 μU/mL to 13.5μU/mL during 0 to 30 min by loading of Carbo-70 formula meal
[13,21]. From
the results of this study, both of insulin responses for GTT and MTT showed
significant correlation for 75g and 6g of carbohydrate. When the increased
level of insulin secretion was examined by three methods, almost the same
results were obtained by delta and AUC methods. By the times ratio method to
the basal value, correlation coefficient was r=0.07, which did not satisfy
<0.05 level at present. However, this pilot study includes only 9 cases,
then, it is expected that a significant difference will be present as the number
of cases increases. We
previously investigated AUC for insulin secretion in diabetes [30]. Carbo70
loading was performed on 42 cases of T2DM, and the insulin response was
examined in 0 to 30 minutes. Patients was divided into 3 groups according to
their severity, and the median HbA1c was 6.3%, 7.9% and 9.8%, respectively.
Compared with the M value, the data of three groups were 0.17, 0.10 and 0.10 in
the Delta method, but the data distribution were separated in the AUC method as
5.2, 2.9 and 1.9. Correlation with the data of M value showed that y =
0.6147x-0.336, R² = 0.2838, r = 0.53 in Delta method, and y = 13.965x-0.306, R²
= 0.5375, r = 0.73 in AUC method. Thus, r value was higher in AUC method. From
the above, it was suggested that the AUC method is superior to the Delta method
[28]. The reason for this would be that the secretion of hormones seems to show
smaller error when calculated as a whole [30]. Secondly,
there are two phases of insulin secretion in response to the intake of
carbohydrate, which are the first phase (I) and the second phase (II) [31].
Normal people have additional insulin secretion as soon as their blood sugar
starts to rise. This is called the first phase reaction, and the originally
pooled insulin is secreted for 5 to 10 minutes to prevent sudden postprandial
hyperglycemia during carbohydrate intake [26]. Then, the beta cells of the
pancreas produce a rather small and persistent secretion of insulin called the
phase II response. This covers the rest of the glucose in the diet. In other
words, the second phase of insulin secretion continues while ingesting glucose. In
the light of our diabetic practice for long, authors et al. found that some
patients showed reduced or missing the first phase of additional insulin
secretion. There is probably a group of people who have inferior function of
the beta cells, and are prone to diabetic states. As mentioned above, this
study analyzed the response of insulin to GTT and MTT. The limitations of this
study are insufficient number of cases and undetected associated factors.
Future research under various conditions would be necessary. In
summary, this pilot study examined the secretory response of insulin to
carbohydrates in three ways. As the number of subjects increase, significant
correlations are supposed to be present. A variety of research design will be
expected to bring further development in the future. *Corresponding author: Hiroshi
Bando, Tokushima University/Medical Research, Tokushima, Japan, Tel:
+81-90-3187-2485, E-mail: pianomed@bronze.ocn.ne.jp Area under the curves, Glycemic index, Meal
tolerance test, Low carbohydrate diet, Japanese LCD promotion associationA Trial of Analysis Method for Insulin Secretion Response to Carbohydrate Loading
Abstract
Full-Text
Introduction
Subjects
and Methods
Ethical
Considerations
Results

Discussion

References
Citation: Bando H, Ebe K, Hashimoto M, Bando M and Muneta T. A trial of analysis
method for insulin secretion response to carbohydrate loading (2020) Edel J Biomed
Res Rev 2: 20-23. Keywords
