Explore journal overview, editorial leadership, indexing, articles in press, latest published work, and highlights from previous issues.
Research Article :
Phthalate
esters, or simply known as phthalates, are chemically known as benzene dicarboxylic
di-esters. Nowadays,
phthalates are found in many consumer products because these chemicals,
especially those with longer side chains (e.g. C4 to C10), can impart
flexibility to many types of otherwise rigid plastics products. One of the most
common examples is products made with polymers of Poly Vinyl Chloride (PVC).
Phthalates compounds do so by embedding themselves between long plastic polymer
chains, thus increases the spacing between polymers and renders them with
increased physical flexibility. In contrast, phthalates with shorter side
chains (e.g. C1, C2, C4) are usually used as solvents and are detectable in
plastics, cosmetics and personal care products (Human Biomonitoring Commission)
[1]. For these reasons, phthalates can be recovered from a wide variety of
consumer products, including but not limited to cling film, plastic sheets,
containers, adhesives, detergents, lubricating oils, vinyl floorings,
pharmaceuticals, personal care products, and hoses, inflatable and flexible
toys. With such extensive uses, human exposures to phthalates are common [2].
Indeed,
owing to the versatile nature of phthalates, their extensive use in plastics
products and their ubiquitous presence in the environment, human could be
exposed to phthalates through various means including ingestion, direct skin
contact (e.g. personal care products, vinyl flooring, toys) and inhalation
(e.g. indoor air, house dust). However, food remains as a main source of adult exposure
to phthalates. It is believed that most of these exposures are a result of
phthalates leached out from food contact materials used in packaging materials,
food processing machineries, contaminated food and drinking water [3-5]. So
far, Health-Based Guidance Values (HBGVs) are only available to the seven more
commonly used phthalates compounds. As HBGVs are the basis of quantitative risk
assessment, this study is meant to be a study of these seven specific
phthalates in food. Availability of HBGVs is a key element in quantitative
dietary exposure. It is concluded that HBGVs are clearly established on seven
phthalates compound. When multiple HBGVs are available for the same phthalates,
we would accord priority to international standards over regional standards
and/or the more updated standard for this risk assessment study.
Even
though Bradley, et al., [6] showed low levels of phthalic monoesters,
mono-n-butyl phthalate and mono-ethylhyexyl phthalate, were detected in several
of the Total Diet Study (TDS) animal-based food groups, they didnt contribute
significantly to dietary exposure. Therefore, metabolites of phthalates with
short mono-alkyl chain were excluded from this study. Despite overseas studies
demonstrated phthalates as contaminants generally pose low health risk to the
public, there has been confusion and ongoing concern from public in
relationship to its possible developmental effect on male reproductive system
in animal studies [2]. Therefore, this study aimed to:
·
Determine the levels of seven phthalates
(i.e. Di-Ethyl Phthalate (DEP), Di-N-Butyl Phthalate (DnBP), Butyl Benzyl
Phthalate (BBzP), Di-(2-Ethylhexyl) Phthalate (DEHP), Di-N-Octyl Phthalate (DnOP),
Di-isononyl Phthalate (DiNP) and Di-isodecyl Phthalate (DiDP)) in selected
foods that are commonly consumed in Hong Kong as well as foods that are
reported to be adulterated with phthalates before, either through overseas
studies or local data so as to provide baseline situation.
·
To estimate the dietary exposure to
phthalates of the Hong Kong adult populations at territory-wide scale.
· To assess the health risk associated with the exposure, if any.
Food Consumption
Data
The
food consumption data were taken from the Hong Kong population-based Food
Consumption Survey (FCS) conducted by the CFS in 2005-2007 [7]. Through a quota
sampling by gender and age groups, 5008 Hong Kong adults aged 20-84 years were
invited to complete two non-consecutive 24-h dietary intake (24-h recall)
questionnaires. Two separate recalls were obtained from each respondent, the
first in person and the second by telephone [7]. This method has been shown in
the United States Department of Agriculture (USDA) National Health and
Nutrition Examination Survey (NHANES) to be feasible and valid [8]. During each
of these interviews, the interviewer asked the respondent to recall in detail
all the food and beverages consumed during the 24-h period of the interview
day. The body weight of each respondent was weighted by the interviewer with a
calibrated balance. To elicit the required detail and limit underreporting, a
multiple pass interview method was used involving asking the respondent to
review his/her food intake several times with clarifying probes about
ingredients, preparation and amounts.
Standard
bowl, plate, cup and spoon, as well as photographs of utensils in other sizes,
were shown to the respondent to help him/her estimate the amount of food taken.
The respondent was also required to have the Food Photo Booklet at hand for the
second 24-h recall interview by telephone. The two interviews were arranged on
non-consecutive days of the week and from 3 to 11 days apart, but not on the
same day of the week, so that the foods consumed on those days would be more
likely to be independent than if consumed on consecutive days or on the same
day of the week. The survey results revealed that over 1,400 food items were
being consumed by the Hong Kong people. The results were age-gender-weighted
and they represent a population of about 5.394 million Hong Kong residents aged
20-84 years [7,9]. In FCS, 5,008 Hong Kong adults aged 20-84 years were
successfully invited through a quota sampling by gender and age groups and
completed two non-consecutive 24-h dietary intake questionnaires. Food records
were subsequently coded into 1,400 food items.
Food Sampling and
Preparation
The
150 TDS food items from 15 food groups were mapped with 1400 food items
captured by FCS in order to cover the whole diet of the Hong Kong people. The
mean levels of the TDS food items were assigned to the mapped FCS food items
with an application of conversion factors taking reference to the differences
in water content [9]. To cite an example, cooked white rice in TDS food was
mapped to cooked white rice and congee in FCS. As a result, over 99% of the
food intake of the Hong Kong people was covered in the dietary exposure
estimation after food mapping. Taking into account the resource limitation and
the likelihood of occurrence of detectable phthalates in different foods, 98
food items from 13 food groups (excluded 2 food groups via legumes, nuts, and
seeds and sugars and confectionery in which there was no report on their
occurrences) were selected for analysis.
Table S1 (supplementary
file) shows the number of samples in
each food group. In order to provide risk assessment in worst case scenario,
food that are more likely to have higher phthalate content (e.g. food with
higher fat contents or history of phthalates abuse) or commonly consumed would
be selected for testing. A total of three hundred and eight samples were
collected from retailers and wholesalers between November 2016 and April 2017
in Hong Kong. A more detailed list of the types of food samples collected could
be found in Table S1with number of individual samples. Most of the collected
samples, like prepackaged drinks, biscuits, hamburger and pizza, were analyzed
as consumed. Those raw food items, such as fish, meat, etc., were prepared by
steaming, boiling or peeling, before the analysis.
Chemical Analysis of Phthalates
In
this study, edible portion of 308 samples were all subjected to testing of DEP,
DnBP, BBzP, DEHP, DnOP, DiNP and DiDP. The collected samples were analyzed as
consumed. In brief, the phthalate levels in food samples were analyzed by Gas
Chromatography-Tandem Mass Spectroscopy (GC-MS/MS) except for DiNP and DiDP by Ultra-Performance
Liquid Chromatography-Tandem Mass Spectroscopy (UPLC-MS/MS) [6,10]. Deuterated
analogs of 7 phthalates were fortified quantitatively into a measured amount of
sample. For solid samples or oil and fat samples, extraction was done with
acetonitrile by ultra-sonication (10 minutes) and then followed by orbital
shaking (30 minutes). After centrifugation, the sample extract was freezed
under -20°C overnight. For liquid samples or vegetable and fruit
samples, n-hexane: acetone (1:1) was used as the extraction solvent. After
centrifugation, the n-hexane layer was freezed under -20°C
overnight.
If
necessary, the extract was further purified with dispersive solid phase
extraction of various packing materials. For acetonitrile extract, evaporate 4
mL to 2 ml. For n-hexane extract, evaporate 2 mL to dryness and then
reconstitute 2 mL of acetonitrile. Then proceed to instrumental analysis.
Identification was confirmed by comparing the relative retention time and the
ion ratios with those of the standards. The Limits of Detection (LODs) and the Limits
of Quantification (LOQs) of the seven phthalates were 5 and 15 µg kg-1
respectively. The LOQs were established as the lowest quantifiable
concentration tested. Method blanks were performed for each sample batch to
assess any background contamination. The background levels of the 7 phthalates
(especially for DBP and DEHP) should be less than their LODs.
To
minimize background contamination of phthalates from the environments, the
precaution measures undertaken included:
·
Plastic wares were not used throughout
the experimental process.
·
Extraction solvent like n-hexane was
purified by passing through activated aluminum oxide.
·
Glasswares were baked at 400°C
for at least 2 hours, stored in a desiccator containing aluminum oxide and
rinsed with purified n-hexane before use.
·
PTFE liner septum was used for injector
of gas chromatograph.
·
An isolator column was added after
solvent delivery system for separating background contaminants from mobile
phase of liquid chromatography.
Analytical Quality
Assurance: The
validation study was performed on the basis of the Eurachem guideline [11]. The
LOQ was established as the lowest quantifiable concentration tested. Replicates
(10) of spiked recovery experiments at level of LOQ were performed in each of
sample matrices, rice, beer and pork. Recoveries and precisions were within
80-118% and <10% RSD respectively. The on-going performance were monitored
by spiked recovery experiments at concentrations of 15-50 ng g-1 of
real samples in duplicate, including beverages, dairy products, fish, meat,
vegetables, fruits, cereals, edible oils and butter. The average spiking
recovery percentages of the 7 phthalates ranged from 92-101% with RSD <10%.
Treatment of
Non-Detected Results
In
this study, data were treated with the Lower Bound (LB) and upper bound (Human
Biomonitoring Commission-UBA) approach. That is, at the LB, results below the
LOD were replaced by zero whilst at the UB; results below the LOD were replaced
by the value reported as the LOD. This approach compares the two extreme
scenarios, based on the consideration that the true value for results less than
LOD may actually be any value between zero and the achieved LOD. The LB
scenario assumes that the chemical is absent; therefore, to results reported as
Dietary Exposure Estimates
In order to cover the whole diet of the Hong Kong population, a food mapping process was carried out by mapping the TDS food items with food items captured by FCS. The mean levels of the TDS food items were assigned to the mapped FCS food items with an application of conversion factors taking reference to the differences of water content [9]. For examples, cooked white rice was mapped to rice congee with a conversion factor of 0.5 as rice congee contains only half the amount of rice compared with cooked white rice of the same weight. The dietary exposures were then estimated individually by combining the assigned levels of mapped FCS food items with their corresponding food consumption amounts. A weighting based on the population distribution by age and gender in the 2006 Population By-census was applied to adjust for bias arising from the age-gender quotas [7,8]. The mean and 95th percentile exposure levels among the FCS respondents after weighting by age-gender were used to represent the dietary exposures of the average and the high consumer of the Hong Kong population, respectively. Dietary exposure estimation was performed with the aid of an in-house developed web-based computer system, Exposure Assessment System (EASY) that takes food mapping and weighting of data into consideration. All results greater than LOD were taken directly to dietary exposure estimation.
Occurrence
Vast
majority of the 308 samples analyzed (99%) had at least one phthalate detected
at quantified levels and only four samples (1.3%) were free from seven
phthalates analyzed. These four prepackaged samples included one konjac snack
sample, lemon tea sample, juice drink sample and soda drink sample. The results
tally with similar overseas studies that phthalates are widespread in food (Figure 1).
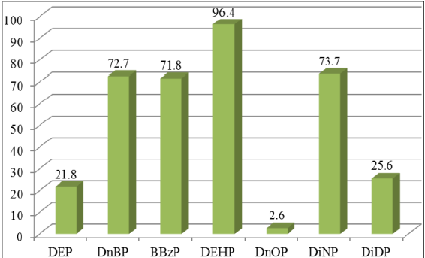
Figure 1: Detection frequencies of phthalates in food samples.
DEHP
was the most commonly found phthalate in this study and was recovered from
about 96% of the samples. This finding was in line with different studies [12-17].
In contrast, DnOP was only detected in about 2.6% of samples tested. The
detection rate of the other five phthalates varied between around 20% and 75%.
The maximum levels for the seven phthalates studied also varied widely. The
maximum detected levels were 23, 43, 93, 560, 3,500, 3,800 and 7,900 µg kg-1
for DnOP, DEP, BBzP, DnBP, DEHP, DiDP and DiNP respectively. Table 1a, and table 1b shows the
average phthalate levels in each food group while Table S2 (supplementary file) shows the phthalate levels of each
food item. Out of the 308 samples tested, only four samples (1.3% of the
samples) were found to have phthalates at levels exceeding the Hong Kongs
action levels.
Two
edible oils got DEHP level higher than 1,500 µg kg-1, included one peanut
oil sample with 3,500 µg kg-1 and one olive pomace oil sample with
3,300 µg kg-1. Besides, the olive pomace oil sample also got the
highest DnOP level amongst all tested samples. Two Chinese white wine samples
with DnBP at levels of 560 and 470 µg kg-1 exceeded the action level
of 300 µg kg-1. Migration of phthalates into these prepackaged
products from plastic wares during the production process is the most possible
source of contamination as they contain high level of fat or ethanol that can
dissolve phthalates. Generally, the average levels of DiNP and DEHP in food
were found to be much higher than the other phthalates (Table 1). The
differences were even more pronounced for certain food groups like pork, oil
and fats, and mixed dishes (Figure 2).
To certain extent, these elevated mean levels were explainable by individual
samples or sub-groups of samples with high phthalates levels (e.g. 7,900 µg kg-1
DiNP in one minced pork sample, 3,800 µg kg-1 DiDP in one roasted
duck sample, 3,500 µg kg-1 DEHP and 1,500 µg kg-1 DiNP in
one peanut oil sample, and 3,500 and 900 µg kg-1 DEHP and 1,100 and
1,500 µg kg-1 DiNP in two olive pomace oil samples respectively).
A
minced pork sample was also found to have the highest DiNP level of 7,900 µg kg-1
amongst the same group. Subsequently, a small scale study was conducted on 20
minced meat samples (14 minced pork, 5 minced beef and 1 minced chicken) that
were packed with wrapping film. Figure
S1 (supplementary file) showed the levels of phthalates in these minced
meat samples. Two (10%) minced pork samples collected from same supermarket
(but at different branches) were detected with higher than average levels of
DiNP (8,600 µg kg-1 and 7,300 µg kg-1 against the average
of 848 µg kg-1 for 20 follow-up samples). Besides, DEHP of these two
samples are also much higher than the rest minced meats (680 µg kg-1
and 360 µg kg-1 against their average of 103 µg kg-1). Both
the DiDP and DEHP levels of these 2 minced pork samples have not exceeded the
Hong Kongs action levels of 9,000 and 1,500 µg kg-1 respectively.
For a 60 kg adult has to take at least one kilogram of these minced meat every
day for prolonged period before risk of adverse health effect could not be
confidently excluded. Risk of ill health from usual consumption is therefore
unlikely. Amongst these samples, only one of these wrapping films was not
composed of PVC, but polyethylene. It is well know that plasticizers are added
to PVC so as to soften the texture. However, it is not logical to correlate the
issue with PVC wrapping film as similar PVC wrapping film was used in another 17
samples. Therefore, the source of contamination is still an unsolved mystery.
Similarly, the high level of DiDP found in a roasted duck is another mystery as
the package used was composed of polypropylene that contain high percentage of
phthalate is unlikely. Further investigation in these areas should be conducted
in future.
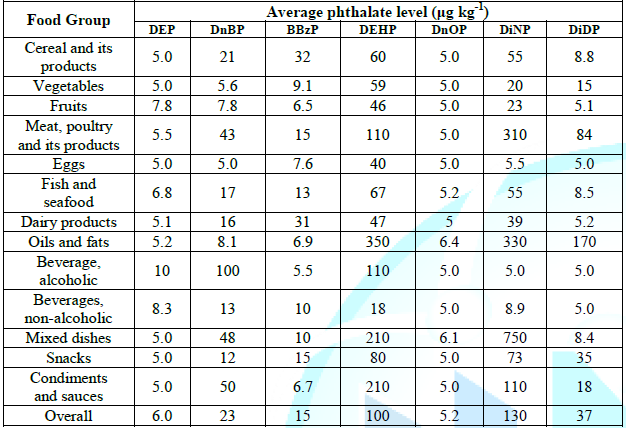
Table 1a: Upper bound-Average phthalate levels by food groups.
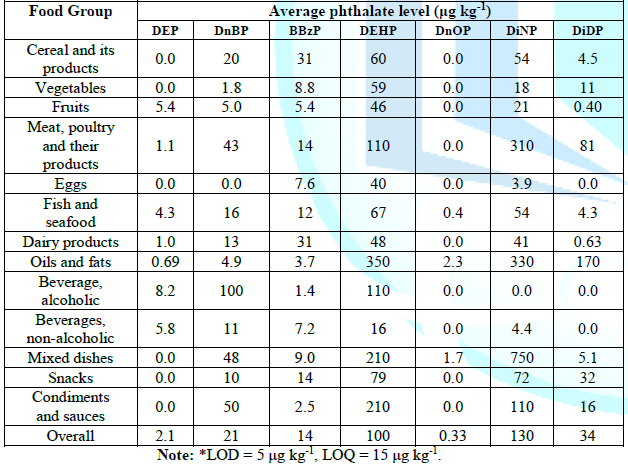
Table 1b: Lower bound-Average phthalate levels by food groups.
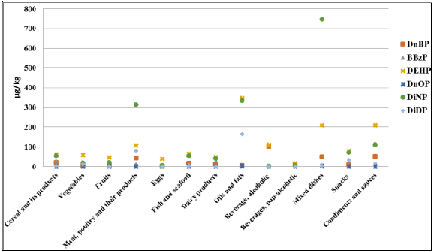
Figure 2: Average levels of phthalates by food groups (LB).
Dietary Exposure
Overall, the dietary exposures to the seven phthalates tested in average local adult consumer population were estimated from a low of 0.011-0.098 μg kg-bw-1 day-1 for DnOP (LB-UB) to a high of 4.8 μg kg-bw-1 day-1 for DiNP (Table 2). As the maximum dietary exposure contributed only 13% of HBGV even for high consumers (P95), the result indicates health risk from phthalates to local adult population is quite remote from public health point of view. Actually, similar findings were seen for the dietary exposure to individual age-sex population sub-groups for both average and high consumers, meaning that there is no evidence of particular higher health risk to any age/sex subgroup of adult population from dietary exposure to phthalate (Table S3) (supplementary file). For the seven phthalates analyzed, the overall dietary exposures for both average and high consumers were low for adult populations in Hong Kong. This conclusion also applied to all sub-populations of different ages and sexes of local adult population. At current levels of phthalate detection, the local adult populations would not experience adverse health outcome due to exposure to the seven phthalates analyzed.
Major Food Group
Contributors
The
relative contribution of each food group to overall LB phthalates exposure
would be employed. LB figures would be used as they are considered a better
reflection of the actual contribution to overall exposures, especially for
those with a large percentage of samples below detectable levels. Table 3 summarized the top three food
group contributors of each phthalate. For DEP, the largest contributor in terms
of food groups to average consumers is non-alcoholic drinks (0.0160 μg kg-bw-1
day-1 (LB), 48% of the DEP exposure), followed by fruits (0.0088 μg
kg-bw-1 day-1 (LB), 26% of the DEP exposure), alcoholic
drinks (0.0040 μg kg-bw-1 day-1 (LB), 12% of the DEP
exposure) and fish (0.0025 μg kg-bw-1 day-1 (LB), 7.3% of
the DEP exposure).
For
DnBP, BBzP, DEHP, DnOP and DiNP, the largest contributor in terms of food
groups for average consumers is cereal and its products, which accounts for
about 73 to 97% of the dietary exposure to the five phthalates. After cereal
and its products, food groups like fruits, vegetables, meat, poultry and their
products were among the more prevalence contributors in terms of food groups to
average consumers was meat, poultry and their products (60%). The contribution
from cereal and its products was shrunk to 19%, followed by vegetables (15%). Although
the food groups cereal and its products was a major contributor to many of the
phthalates in the adult population, this can be explained by their relatively
high consumption amount by local adults. Since the overall dietary exposure was
way below corresponding HBGVs, the finding does not carry the inference that
consumption of cereal and its products is hazardous. To be more exact, our
assessment confirmed that there is no need to modify the dietary habit as the
overall exposure to the seven phthalates is well below the relevant HBGVs.
We
also noticed that relatively high phthalates levels were detected in a number
of samples, citing the situation of mixed dishes, pork products and edible oil
below. For mixed dishes comprising primarily of hamburgers, pizza and
prepackaged lunchbox, higher levels of DiNP (2,100 and 3,800 µg kg-1
in two different samples) and DEHP (990 µg kg-1) were more commonly
found among prepackaged lunch boxes in microwavable packing. In contrast, these
phthalates were much lower in pizza and hamburgers in alternative forms of
product packing. In the case of pork samples, the higher mean DiNP level for
was mainly contributed by a minced pork sample with a particularly high DiNP
level of 7,900 µg kg-1, where the other pork samples have much lower
levels of DiNP which range from 7.4 to 870 µg kg-1 DiNP. Among all
speculations, the use of PVC-based packaging films is suspected as the most possible
contributing factor. Regarding different types of edible oil sampled, higher
levels of phthalates were found in samples of some peanut oil (DiNP in three
peanut oil ranged from 630 to 1,500 µg kg-1 and one of them has a
DEHP level of 3,500 µg kg-1) and samples of olive oil (DiNP ranges
from 350 to 1,300 µg kg-1, and one olive oil sample has 1,200 µg kg-1
of DiDP.)
While the levels in these samples will not cause
health issues, it was believed that exposure to those phthalates chemicals can
be further reduced by modification in the process of products manufacture and packaging
for some products. Actually, there is no cause for undue alarm even for samples
with elevated levels of phthalates as highlighted above. The existing action
levels were established to screen out food that had been intentionally
adulterated with phthalates. As both edible oil and ethanol (spirits) are
lipophilic in nature and extract phthalates readily from the plastic polymers
upon direct physical contact, these results were not of surprise and do not
point to intentional adulteration as in the 2011 Taiwan plasticizer incident. Risk
assessment also confirmed that all these samples would not cause adverse health
problem from phthalates upon usual consumption. Besides, as food contact
materials used in food manufacturing and packaging process may also explain the
situation, it is therefore believed that exposure to those phthalates chemicals
can be further reduced by modification in the process of products manufacture
and packaging.
Co-occurrence of
phthalates
Amongst
308 samples tested for phthalates, co-occurrence of phthalates was observed in
most of the samples. An olive oil samples was found to contain 7 targeted
phthalates in detectable amount. As DEHP was the most commonly found
phthalates, the co-occurrence rates of DEHP with DnBP, BBzP or DiNP were
roughly the same of 71, 71 and 72% respectively. The top three food groups
detected with higher sum of average levels (LB) of seven phthalates were mixed
dishes (1,000 µg kg-1, which were mainly contributed by DiNP and
DEHP), oils and fats (860 µg kg-1, which were mainly contributed by
DEHP, DiNP and DiDP) and meat, poultry and their products (680 µg kg-1,
which were mainly contributed by DiNP and DEHP). Co-occurrence of phthalates
can arise from phthalates are ubiquitous presence in the environment.
International
Comparison
Overseas data on
phthalate exposure were retrieved for comparison (Table 4). Despite that sample coverage, methodology and analytical
methods differ, the average adult exposure data in this study are considered at
comparable levels. It was noted that the exposure of DiNP in Hong Kong is the
highest amongst recent studies. It is likely due to the exceptionally high DiNP
level found in 3 individual samples, via minced pork, peanut oil and olive oil,
and 3 olive pomace oils. Furthermore, DiDP and DiNP are the least studied
phthalates as they get lowest sensitivity amongst other phthalates.
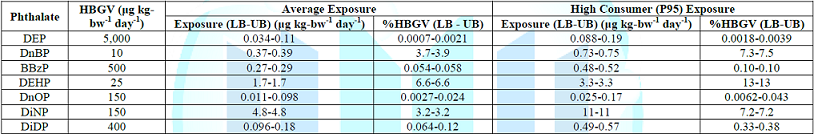
Table 2: The exposure of seven phthalates for average and high consumers.
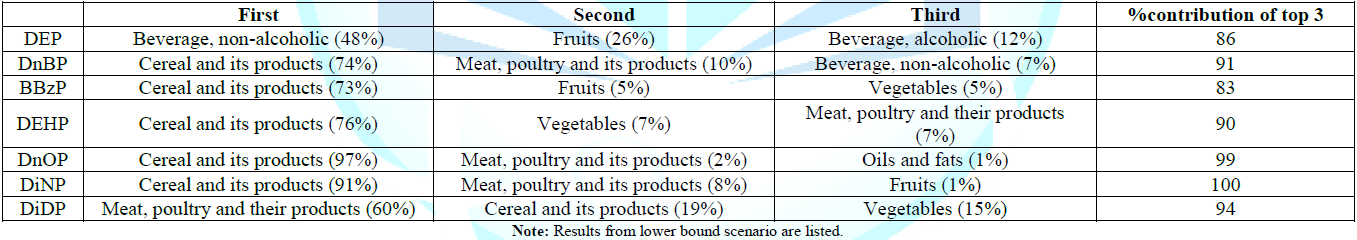
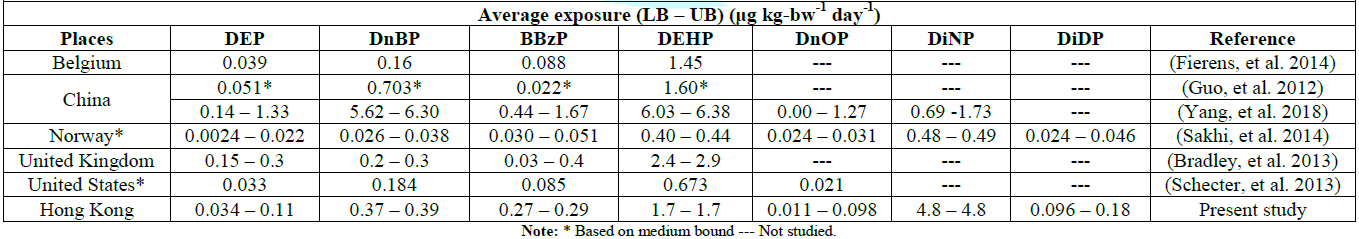
Table 4: Comparison of adult dietary exposure to seven phthalates in various countries.
This
is the first study to provide the estimate of the average dietary exposure of
the adult population in Hong Kong to phthalates. The results confirmed that the
studied phthalates are ubiquitous in food.
Regarding
the dietary exposure assessment, the exposure to both average and high consumers
(95th percentile, or P95) of the adult populations were well within
the corresponding HBGVs (maximum 13% HBGV) for individual phthalate. Furthermore,
no age-sex population sub-group had exceeded the HBGVs. The food group cereal
and its products was the major contributor for DnBP, BBzP, DEHP, DnOP and DiNP
dietary exposure, while non-alcoholic drinks and poultry were the major
contributors for DEP and DiDP dietary exposure, respectively.
It is believed that elevated levels of phthalates detected in isolated samples were more related to chemical nature of the food substrates. Food contact materials used in food manufacturing and packaging may also explain the situation. There was no evidence of intention adulteration of phthalates in food as occurred in 2011. All parties along the food supply chain, including the food manufacturers, distributors and retailers, should use appropriate food contact materials and minimize the occurrence of phthalates in food.
Stephen WC Chung, Food Research Laboratory, Centre
for Food Safety, Food and Environmental Hygiene Department, Hong Kong, China, Tel:
(852) 2319 8439, Email: swcchung@fehd.gov.hk
Chung SWC and Lau JSY. Occurrence and dietary
exposure of adult population to phthalates in Hong Kong (2020) Edelweiss Food
Sci Tech 1: 21-26.
Phthalates, Di-ethyl phthalate, Di-n-butyl
phthalate, Butyl benzyl phthalate, Di-(2-ethylhexyl) phthalate, Di-n-octyl
phthalate, Diisononyl phthalate, Diisodecyl phthalate, Dietary exposure.