Background
The World
Health Organization recommends parasitological confirmation of malaria either by microscopy or RDT before
initiating treatment with ACT, and this is documented in the Uganda National Malaria
treatment guidelines [1,2]. The level of malaria endemicity, the urgency of diagnosis,
the experience of the physician and cost of the technique are some of the factors that
influence the choice of the malaria-diagnostic technique to use [3]. In turn, the technique
and quality of diagnosis determine the treatment
options, treatment (health) outcomes, and level of resource use. Ideally, an acceptable diagnostic technique should be both
cost-effective and provide results that are
consistently accurate and timely in order to have a direct impact on treatment
[4].
There are
three methods of detecting malaria parasites in peripheral blood; microscopy, antigen detection using Rapid
Diagnostic Tests and Polymerase Chain Reaction.
Microscopy is a recommended method for routine malaria diagnosis because it allows the identification of
different malaria-causing parasites ( Plasmodium falciparum , Plasmodium vivax , Plasmodium malariae and Plasmodium ovale ) and quantification of parasite density to monitor
response to treatment [5]. The Ministry of
Health in Uganda recommends the use of RDT at Health Centre II & community levels, while
microscopy is used at Health Centre
level III and IV, and hospitals [6]. Microscopy itself is not a magic bullet; cases of misdiagnosis leading
to inappropriate treatment still exist
in Uganda. As a result, the practice of treating all febrile infections with anti-malaria drugs
remains an outstanding challenge [7].
This creates need for appropriate malaria diagnostic strategies that will promote efficient use of
resources, reduce costs on the
management of malaria and address challenges of presumptive treatment of malaria [8,9].
Microscopy is the major malaria
diagnostic technique used in hospital settings in Uganda. Microscopy uses either Fields or Giemsa
staining techniques. Fields staining
technique is most commonly used in health centres and hospitals although the Uganda
Ministry of Health recommends use of
Giemsa stain [6].
Mulago
National referral hospital like other health facilities mainly uses Fields staining technique for
laboratory diagnosis of malaria. Acute
Care Unit, a major pediatric ward at Mulago National referral hospital has a malaria
prevalence ranging from 30-35%, malaria
being the leading cause of complications and death among children less than five years
admitted at this ward. Due to the high
malaria prevalence, over 75% of children admitted to acute care unit are tested for malaria
using Fields staining technique prior to
admission therefore the type of management and treatment offered to these children is
influenced by the first malaria test
results. However, both the accuracy of results and cost of microscopy are determined by the type of
stain used. Fields stain takes a short
time to results. Giemsa stain has better staining properties and recommended for Quality
assurance purposes. Given the limited
resources and the need to ensure proper treatment
of children admitted to Mulago National Referral Hospital, it is important to determine the
cost effectiveness of the staining
techniques so as to decide which one is appropriate to take on. This study set out to determine
and compare the cost effectiveness of
Giemsa and Fields staining techniques in parasitological confirmation of malaria among
children under five years received at
the Acute Care Unit of Mulago National Referral Hospital in order to inform policy and
implementation.
Methods
Study
design and setting
This was a
cross sectional cost effectiveness analysis study carried out at the Acute Care Unit of Mulago
National Referral Hospital. Acute Care
Unit is a 24 hour emergency ward and reception
center for all pediatric nonsurgical patients. It receives children aged up to 12 years but majority
(about 75%) are below five years. . Upon
stabilizing their medical condition, they are transferred to general pediatric wards for
continuation of care. Acute Care Unit
admits 40-50 children daily, has a laboratory which operates 24 hours daily. Malaria is the
leading cause of morbidity and mortality
among children admitted at Acute Care Unit,
Mulago National Referral Hospital and over 90% of these children undergo a parasitological
confirmation test for malaria before
and/or during care. Routine malaria diagnosis at the Acute Care Unit is by microscopy using Fields
staining technique. On average, 20–30
children less than five years are tested for malaria daily. There are seasonal variations in the
prevalence of malaria in the ward. The
prevalence of malaria among these children ranges between 20% and 35%.
Study
population
The study
population was made up of 243 children below five years of age presenting at Acute Care Unit
laboratory for malaria test before
admission.
Sample
size determination and sampling
The study
sample size was obtained using Buderers method [10] for calculation of power in diagnostic
tests based on a standard 2 by 2 table
for comparing diagnostic tests. This method was used because determination of effectiveness was
based on sensitivity and specificity of
Fields and Giemsa staining techniques. Two sample sizes were obtained based on the need
for adequate sensitivity and for
adequate specificity [10]. Using this method, the number of patients needed for adequate sensitivity
was 243 while that for adequate
specificity was 351. Given the time and resources available the study used 243 children to determine
effectiveness of the staining techniques.
Study participants were selected using consecutive sampling, a good sampling method when determining
effectiveness or accuracy of diagnostic
tests [11]. The study only included children
with caregivers consent. Enrollment and determination of effectiveness was done from April 25 to
June 15, 2014.
Sampling
procedure
Study
participants were selected using consecutive sampling. This method has been recommended for use in
determining effectiveness or accuracy of
diagnostic tests (Knottnerus and Muris,
2003). Eligible children were enrolled into the study as they presented at the acute care unit laboratory
for the initial malaria test prior to
admission.
Inclusion
criteria
All
children below five years who were received at acute care unit Mulago National Referral Hospital and
presented for the initial malaria test
prior to admission were included in the study.
Exclusion
criteria
Children
below five years who reported to acute care unit Mulago National Referral Hospital for the
initial malaria test without caregivers
consent were not included in the study.
Cost data
collection
The costs
of the staining techniques included; direct medical and direct non-medical costs incurred during
malaria diagnosis using either Fields or
Giemsa staining techniques. Direct medical costs were precisely related to the staining
method. They included; laboratory
technologists time, cost of reagents, equipment and supplies. Direct non-medical costs incurred in
the process of testing were not directly
related to the staining method. They included: costs for utilities like water, electricity
and laboratory space. The ingredient approach was used for costing each
staining technique. This approach
involved identification, quantification and
valuation of all inputs for the staining techniques in order to obtain unit costs. This was done for the
different steps in the staining process
which included; smear preparation, smear drying and examination. Costs were obtained in
aggregate form and broken down to obtain
unit costs in terms of cost per blood smear.
These unit costs were summed up to obtain a unit cost for each staining technique. This study
included costs incurred while staining
of blood smears in either staining techniques only. Costs for steps that were similar in
both techniques were excluded from the
analysis because they equally incurred in both staining techniques and cannot cause
differences in the outcome. These
included costs for; blood sample collection, blood smear preparation, smear drying and examination.
Overhead costs were assumed to be
equally incurred in both staining techniques and were therefore excluded from the analysis.
These included cost of; reagent storage,
building maintenance, cost of hospital/ laboratory administration, cost of
reagent preparation and storage, transportation,
cleaning and taxes. Costs of the Polymerase Chain Reaction test were not included in the
analysis since this test was only used
as a gold standard.
The costs
incurred during staining in either technique included; capital costs, reagent costs, labor costs and
utility costs. Capital costs included
cost of laboratory space and equipment. Reagent costs included costs of all reagents that were
used during staining. Labor costs
included; Labor laboratory technicians time and cost of utilities (water and electricity) used
during staining.
Data on
costs was obtained in aggregate form and then disaggregated to come up with unit costs. Cost
data was obtained from the market
wholesale price, the administration of Mulago National Referral Hospital, and National
Medical Stores and General Medical
Stores. The United States dollar was used in this study because it is a widely used
currency in most Cost Effectiveness
Analyses and for aiding comparison. The costs were collected in Uganda shillings and converted to
the United States dollars at the
existing exchange rate during study period of 1United States dollar to 2550 Uganda shillings (www.oanda.com).
Measurement
of effectiveness
Blood
samples for determination of effectiveness of Fields and Giemsa staining techniques were collected
from 243 children below five years of
age who presented at Acute Care Unit laboratory for malaria diagnosis during the study period.
Effectiveness of the staining techniques
was determined by the number and proportion of correctly diagnosed cases as applied in
other studies [12-15]. As applied in a
similar study [12], Polymerase Chain Reaction method was used as the gold standard for this
study using nested Polymerase Chain
Reaction technique for Plasmodium falciparum
because Plasmodium falciparum accounts
for over 95% of malaria infections in
Uganda. Probabilities for stain effectiveness were the calculated positive and negative
predictive values of the two staining
techniques as compared to Polymerase Chain Reaction method.
Cost
effectiveness Analysis model
The
decision tree analytic model using Tree Age software was used for the cost effectiveness analysis.
Effectiveness probabilities and values
together with the providers costs incurred by either technique were used to populate the model in
order to determine cost effectiveness of
the two staining techniques. The payoffs for the correctly diagnosed cases were the
number of correctly diagnosed cases,
true positive and true negative cases for both staining techniques while cases that were not
correctly diagnosed (false positive and
false negatives cases) had a payoff of zero. In both staining techniques, the cost payoffs
were the unit costs for the staining
technique.
Sensitivity
analysis
Use of
different sources of costs created uncertainty. In order to address this uncertainty, sensitivity
analysis was carried out on unit costs
of each staining technique. The costs were halved and doubled in order to get the lower and upper
limits of sensitivity ranges
respectively. One-way sensitivity analysis was used since only one variable was varied.
Ethical
Approval
Ethical
approval was obtained from the Makerere University School of Public Health Institutional Review
Board. Permission to conduct the study
in Mulago National Referral Hospital was also obtained from the Mulago National Referral
Hospital Research and Ethics Committee
(Protocol MREC539).
Quality
Assurance and Control
All study
activities were coordinated and supervised by the principle investigator (PI) who is a
laboratory technologist with experience
in research. The research team comprised of one nurse and three laboratory technologists, all with
more than ten years of experience in
their fields. These were briefed about their activities prior to data collection by the PI. The PI
actively participated in ensuring
quality data collection and documentation. Results for Giemsa and Fields stains were filed and
kept separately. PCR tests were
conducted in a separate and highly specialized research laboratory by highly qualified
laboratory technologists. Information on
blood samples was checked for consistency with that on the study forms. We ensured
uniformity in labeling on the forms and
blood samples. Rounding off of costs during disaggregation was avoided.
Results
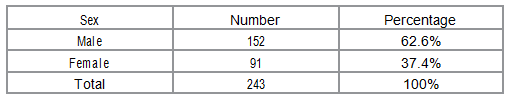
Table: Demographic
characteristics of study participants
Demographic
characteristics of study participants
Costs
Various
costs incurred when using either Fields or Giemsa staining technique were identified and sorted
into three broad categories; reagent
costs, labor costs and equipment costs as indicated in Table 1. Unit costs were US $
0.030 and US $ 0.769 for Fields and
Giemsa staining techniques respectively. The percentage of reagent costs as a proportion of
total unit costs of the staining
techniques were 5.19% and 0.446% for Fields and Giemsa staining techniques respectively. Labor
costs comprised of 89.63% and 99.469% of
the unit costs of Fields and Giemsa staining
techniques respectively. The corresponding percentage of equipment costs as a proportion of total unit
costs for the staining techniques were
5.18% and 0.085% respectively.
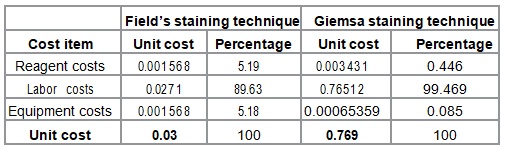
Table 1: Unit costs for the staining techniques.
Effectiveness
Effectiveness
of each staining technique was determined by the number and proportion of cases correctly
diagnosed using Giemsa and Fields
staining techniques with PCR method as the gold standard (Table 2). Effectiveness probabilities for populating the
decision tree analytic model were
calculated and are presented in Table 3. The numbers of correctly diagnosed cases were 227
and 230 for Fields and Giemsa staining
techniques respectively. The corresponding proportion of correctly diagnosed cases was
93.4% and 94.7% respectively.
Effectiveness probabilities were calculated using epidemiological principles for determination
of diagnostic accuracy based on 2X2
table [16]. The probabilities included; the positive and negative predictive values, and their
complementary probabilities. The
calculated probabilities together with the number of correctly diagnosed cases were populated in the analysis
model to obtain expected values for
either staining techniques. The expected values were the basis for comparison of effectiveness
and cost effectiveness.
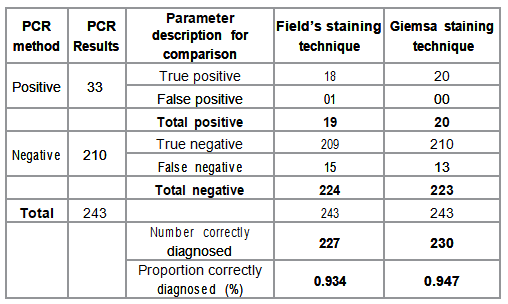
Table 2: Stain effectiveness as compared with PCR method.
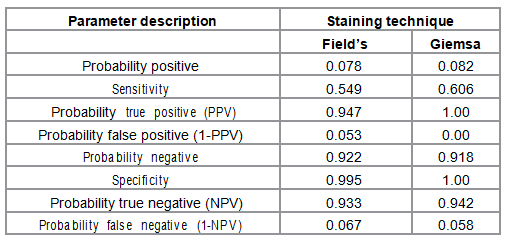
Table 3: Effectiveness Probabilities for the staining techniques.
Cost
effectiveness analysis
Cost
effectiveness analysis using both costs and number of correctly diagnosed cases The cost
effectiveness analysis indicated that Fields staining technique was more costs effective than Giemsa
staining technique (Figure 1). Figure 2
provides a graphical presentation of the cost effectiveness analysis. Since Giemsa
had higher effectiveness and higher costs than Fields staining technique, the graph further
emphasizes the importance of the
decision tree analysis as a way of determining the more cost effective staining technique.
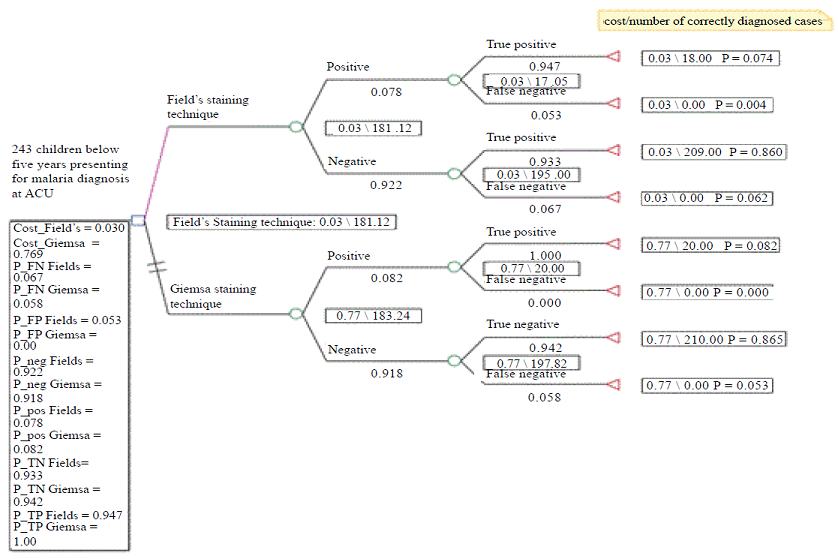
Figure
1: Decision Tree
for Cost Effectiveness Analysis.
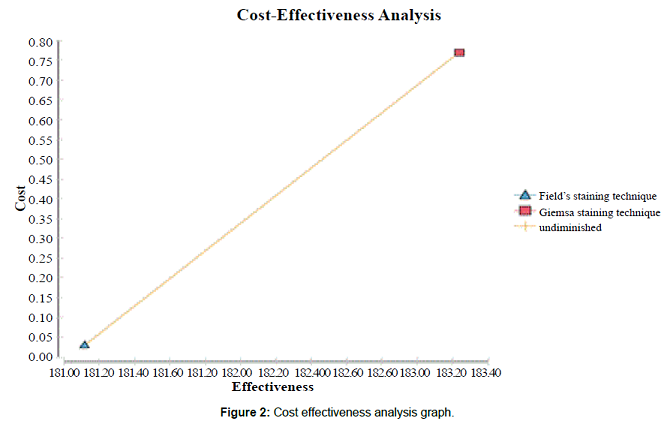
Figure
2: Cost
effectiveness analysis graph.
Incremental
cost effectiveness analysis ratio ( ICER )
Table 4
indicates the cost effectiveness rankings obtained from the cost effectiveness analysis. These
include; costs, effectiveness and
provided the incremental cost effectiveness ratio for staining techniques based on the expected values
generated in the decision tree analysis.
The incremental costs and incremental effectiveness were 0.74 US $ and 2.12 correctly diagnosed
cases respectively while the ICER was
0.35 US $ per additional correctly diagnosed case.
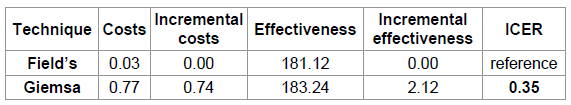
Table 4: Cost effectiveness rankings.
Sensitivity
analysis
We
conducted one-way sensitivity analysis using TreeAge. This was done by varying the costs (Table 5)
of Fields and Giemsa staining techniques
on assumption that other parameters remained constant. In both instances, Giemsa staining
technique remained more cost effective
than Fields staining technique and the ICER remained was not affected. The ICER remained
constant at 0.35 even with varying these
costs.
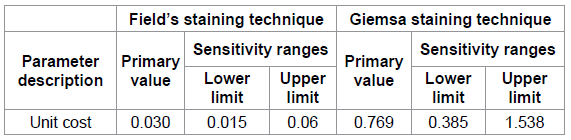
Table 5: Sensitivity Analysis Ranges.
Discussion
The World
Health Organization and Uganda Ministry of Health recommends microscopy using Giemsa
staining technique for the
parasitological confirmation in the diagnosis of malaria [6]. Microscopy using Giemsa staining technique
provides quality test results and is
considered to be more effective than Fields staining technique. However, its cost effectiveness is
still debated. Most health facilities in
Uganda that still use Fields staining technique argue that Giemsa has a high time to results
compared to Fields stain which increases
its cost.
Costs of
staining techniques
Unit costs
for Fields and Giemsa staining techniques were 0.030US $ and 0.769 US $ respectively. This
implied the cost of Giemsa staining
technique was 25.6 times higher than that for Fields staining technique. Staining with
Giemsa takes 32 minutes compared to
Fields that takes 1 minute and 8 seconds. Labor costs were the highest cost drivers in both
staining techniques constituting of
89.63% and 99.469% of unit costs for Fields and Giemsa staining techniques respectively. This
finding is similar to what was found in
previous studies on costs of malaria diagnosis using microscopy which also reported labor
costs as the highest cost driver [12,
14, 15].
There was
a slight difference (0.001863 US $ ) in reagent costs incurred in the staining techniques although
the proportion of reagent costs was
higher for Fields staining technique compared to that for Giemsa staining technique. Reagent
and equipment costs for the Fields
staining technique were almost equal at 5.19% and 5.18% of the unit cost respectively.
Proportions of reagent and equipment
costs were higher for Fields staining technique (5.19% and 5.18%) than for Giemsa staining
technique (0.085% and 0.446%). This is
because unlike Giemsa, Fields staining technique
requires more reagents and equipment but reagents needed in Fields staining technique are
cheaper than those for Giemsa staining
technique. Fields staining technique was found to be more cost saving and this partly
accounts for its preference in high
malaria diagnosis workload in resource limited settings Effectiveness of the staining
techniques Giemsa
staining technique was more effective than Fields staining technique. The number of correctly
diagnosed cases was 227 and 230 for
Fields and Giemsa staining techniques respectively.
The corresponding proportion of correctly diagnosed cases was 93.4% and 94.7% respectively. There
was a slight difference in number and
proportion of correctly diagnosed cases of
malaria by the two staining techniques.
The sensitivity
of Fields and Giemsa staining techniques were 54.9% and 99.5% respectively while sensitivity
was 60.6% and 100% for Fields and Giemsa
staining techniques respectively. This results do not very different from those of a similar
study that reported 47.2% and 46.1%
sensitivity and 93.4% and 97.2% specificity for Fields and Giemsa respectively [17].
The
positive predictive values were 0.947 and 1.00 while corresponding negative predictive values were
0.933 and 0.942 for Fields and Giemsa staining
techniques respectively. The expected effectiveness
value for Giemsa staining technique was 183.24 while that for Fields staining
technique was 181.12. This indicates that Giemsa was slightly more effective than Fields
staining technique.
Cost
effectiveness of Giemsa compared to Fields staining technique
Fields
staining technique was more cost effective than Giemsa staining technique. This is because the cost
of Giemsa staining technique is higher
than Fields staining technique; yet, Giemsa staining technique has a slightly higher
effectiveness than fields staining
technique. The incremental cost effectiveness ratio was 0.35 $ per additional correctly diagnosed case
of malaria. This implies that based on
the findings of this study, every additional correctly diagnosed case of malaria obtained
by moving from Fields to Giemsa staining
technique cost the provider 0.35 US $
which is 8.2 times higher than the unit cost of Fields staining technique.
Sensitivity
analysis
Results of
the sensitivity analysis indicated that the Incremental Cost Effectiveness Ratio was not affected by
varying the costs of the staining
technique. Based on the expected values from the cost effectiveness analysis it remained constant at
0.35. The results of the sensitivity
analysis indicated that the cost effectiveness analysis model was robust.
Study
Limitations
The use of
number and proportion of correctly diagnosed cases of malaria as the outcome posed a limitation
for this study. This is an intermediate
outcome that is assumed to be linked to improved final outcome, recovery from disease. The link
between correctly diagnosing a case,
optimal clinical management of the patient, and a satisfactory health outcome may be difficult
to prove without a close patient follow
up. Within the scope of this study, it was not possible to estimate the link between
incorrectly diagnosed cases of malaria
and the final clinical outcome. This is because no patient follow up was made hence further research will
be required in this area. Another
limitation of this study was use of the providers perspective. However, in this study the
provider perspective was used because we
only considered the costs of providing these
staining techniques, although there are some indirect costs incurred by the consumer which were not
included.
Confounding
Factors
This study
had minimal confounding. The possible source of confounding for this study could have been
the difference in malaria slide
preparation and microscopy slide reading. This was addressed by using qualified and highly
experienced (over 10 years experience)
laboratory technologists in laboratory diagnosis of malaria in a busy hospital setting.
Conclusion
Drawing from findings of this study, Field’s
staining technique was more cost effective than Giemsa staining technique. It
provided a higher number of correctly diagnosed cases of malaria at a lower
cost than Giemsa staining technique. With Uganda statistics of 2013
indicating a Gross Domestic Product (GDP) per capita of 1365.13 US dollars, an
of ICER of 0.35 US dollars indicates that Field’s staining technique is
affordable. This study therefore recommends the use of Field’s staining technique
for routine microscopy for the parasitological confirmation of malaria
diagnosis limited resource settings like the Acute Care Unit at Mulago National
Referral Hospital and Uganda at large, and in other low income countries.
Implementation of the Ministry of Health’s recommendation to use Giemsa
staining technique should be promoted when adequate resources have been made
available to support it. This study highlights the need to incorporate cost
effectiveness analyses in decision making process to inform policy and
implementation.
Competing Interests
The authors declare that they have no competing interests
Authors’ Contributions
NJ participated in the inception, design, implementation of the research, analysis and interpretation of findings as well as writing the manuscript. NSL participated in the inception and design of the research and also conducted PCR assays. YA was involved in drafting the manuscript through providing critical review and gave final approval of the version to be published. CM participated in the analysis, interpretation of data and was involved in drafting the manuscript. SOB participated in analysis, interpretation of data, drafting the manuscript and gave final approval of the version to be published.
Authors’ Information
NJ, currently Research Associate at Makerere University School of Public Health was a student of Master of Health Services Research at Makerere University at the time of conducting the research. NSL is the Laboratory Director of the Makerere University-University of San Francisco California Molecular Laboratory under the Infectious Diseases Research Collaboration. YA is a senior Epidemiologist at the Uganda Malaria Surveillance Project. CM is an assistant Lecturer under the Department of Health Policy, Planning and Management at the School of Public Health, Makerere University. SOB is a Senior Lecturer under the Department of Health Policy, Planning and Management at the School of Public Health, Makerere University
Acknowledgement
This research was made possible by Uganda
Malaria Clinical Operational and Health Services (COHRE) Training Program at
Makerere University, Grant #D43-TW00807701A1, from the Fogarty International
Center (FIC) at the National Institutes of Health (NIH). Its contents are
solely the responsibility of the authors and do not necessarily represent the
official views of FIC or NIH.
References
1. Ministry of Health M.O.H, (2008) Guidelines for treatment of malaria.
2. WHO (2012) World Malaria report.
3. Tangpukdee N, Duangdee C, Wilairatana P, Krudsood S. Malaria diagnosis: a brief review. (2009) Korean J Parasitol 47: 93-102.
4. WHO (2013) WHO Bulletin.
5. Bronzan RN, McMorrow ML, Kachur SP. Diagnosis of malaria: challenges for clinicians in endemic and non-endemic regions. (2008) Mol Diagn Ther 12: 299-306.
6. Ministry of Health M.O.H (2013) Uganda National Guidelines for implementation of Parasite Based Diagnosis of Malaria, Uganda.
7. Ndyomugyenyi R, Magnussen P, Clarke S. Diagnosis and treatment of malaria in peripheral health facilities in Uganda: findings from an area of low transmission in south-western Uganda. (2007) Malar J 6: 39.
8. Nankabirwa J, Zurovac D, Njogu JN, Rwakimari JB, Counihan H, et al., Malaria misdiagnosis in Uganda--implications for policy change. (2009) Malar J 8: 66.
9. Namagembe A, Ssekabira U, Weavr MR, Blum N, Burnett S, et al., Improved clinical and laboratory skills after team-based, malaria case management training of health care professionals in Uganda. (2012) Malar J 11: 44.
10. Buderer NM. Statistical methodology: I. Incorporating the prevalence of disease into the sample size calculation for sensitivity and specificity. (1996) Acad Emerg Med 3: 895-900.
11. Knottnerus J, Muris J. Assessment of the accuracy of diagnostic tests: the cross-sectional study. (2003) Journal of clinical epidemiology 56:1118-1128.
12. Batwala V, Magnussen P, et al., Cost-effectiveness of malaria microscopy and rapid diagnostic tests versus presumptive diagnosis: implications for malaria control in Uganda. (2011) Malar J. 10: 372.
13. Shillcutt S, Morel C, et al., Cost-effectiveness of malaria diagnostic methods in sub-Saharan Africa in an era of combination therapy. (2008) Bulletin of the World Health Organization, 86: 101-110.
14. Uzochukwu BS, Obikeze EN, Onwujekwe OE, Onoka CA, Griffiths UK. Cost-effectiveness analysis of rapid diagnostic test, microscopy and syndromic approach in the diagnosis of malaria in Nigeria: implications for scaling-up deployment of ACT. (2009) Malar J 8: 265.
15. Chanda P, Castillo-Riquelme M, Masiye F. Cost-effectiveness analysis of the available strategies for diagnosing malaria in outpatient clinics in Zambia. (2009) Cost Effectiveness and Resource Allocation. 7: 5.
16. Szklo M, Nieto FJ, Miller D. Epidemiology: beyond the basics. (2001) American Journal of Epidemiology. 153: 821-822.
17. Batwala V, Magnussen P, Nuwaha F. Are rapid diagnostic tests more accurate in diagnosis of Plasmodium falciparum malaria compared to microscopy at rural health centres. (2010) Malar J 9: 349.
*Corresponding author
Juliana Namutundu, Makerere University, School of Public Health,
P.O.BOX 7072, Kampala, Uganda, Tel: +256 41 4533332 E-mail: namutundu@yahoo.com
Citation
Namutundu J, Lubwama NS, Adoke Y, Mayora C, Baine SO (2016)
Cost Effectiveness of Giemsa versus Field’s Staining Technique: Implications
for Malaria Diagnosis among Children in a Busy Hospital Setting in Uganda. NHC 106: 26-32