Introduction
Dental researchers and clinicians
have long recognized the viability of reducing dental caries with fluoride [1].
But the multifactorial nature of tooth decay
contributes to the still problematic issue of tooth decay and therefore
continues to command attention, which includes improved understanding of not
only the effect of caries on the tooth but also the effect of preventive agents
on the carious tooth, including topical fluorides [2,3].
Carious lesions manifest a
subsurface environment devoid of mineral [4], the nature of which are now
routinely studied using a variety of methodologies, including micro hardness
techniques, optical or electronic microscopies, and transverse X-ray
microradiography [5,6]. Investigations of enamel micro- and ultrastructure,
such as identification of particular mineral phases or characteristics of
crystalline framework, wide-angle X-ray diffraction (WAXD), small-angle X-ray
scattering (SAXS), conventional or synchrotron radiation-based micro-computed
tomography, and electron microscopies are typically used [7-15]. Among these
techniques, scanning or transmission electron microscopies have been used with
much success for over 30 years to reveal intricacies of enamel ultrastructure,
including the identification of defects manifest in dental apatite (e.g.
point defects, edge defects, screw dislocations, and small angle boundary
defects) [14-18].
With recent technical
advancements in X-ray apparatus (e.g. narrowing of X-ray beam width), SAXS
experiments have revealed new information [7,8,10]. Recently, a SAXS
investigation revealed the underlying nanoscale enamel crystalline
framework retains anisotropy in both incipient and advanced carious lesions
[10]. Separately, quantitative detection of inter-crystalline voids in demineralized
enamel has been achieved using SAXS [7,8]; in doing so, these SAXS studies
demonstrated the crystallite-void relationship within carious enamel
microstructure is sensitive to remineralization [8].
In our previous work, we have
probed the microstructure of incipient enamel lesions cycled
in a 10-day in vitro remineralization model using a conventional and
synchrotron radiation microcomputed tomography [12,13]. In vitro cycling models
manifest evens corresponding to treatment, acid challenge or salivary events,
and are useful in assessing the quality of newly formed mineral [5]. The
remineralization model employed in this study is sensitive to fluoride and has
been used successfully to correlate with clinical outcomes [5,6,19-23]. The
outcome of those pilot studies revealed synchrotron radiation micro-computed tomography
could resolve significant microstructural differences in incipient lesions
subjected to three different dentifrices, including a fluoride-free dentifrice
(Tom’s of Maine) along with 0.21% NaF and 1.1% NaF dentifrices (3M Clinpro
Tooth Crème and Clinpro 5000, respectively). Those encouraging results prompted
us to continue our microstructural investigations into the remineralized
carious lesions.
In the present investigation we
have used a plurality of techniques to probe the enamel microstructure of the
same incipient carious lesions previously evaluated with microcomputed
tomography. In particular, we utilized the BL40XU beamline of the SPring-8
third-generation synchrotron radiation facility in Hyogo, Japan to collect WAXD
and SAXS measurements within the incipient lesions. This advanced facility
provided us an opportunity to evaluate the microstructural environment of
incipient lesions subject to topical fluoride treatments in an in vitro
remineralization model. Additionally, digital light microscopy, high-resolution
field-emission scanning
electron microscopy (FESEM) and microhardness measurements were also
employed to investigate the effect of the three different dentifrice treatments
on subsurface morphology and strength.
Experimental Section
Treatment groups and pH-cycling
study
As this study is a follow-on to
the previous laboratory study and utilized the same enamel specimens as used
previously, in-depth experimental details on specimens preparation,
demineralization and remineralization solutions, and white-spot lesion
formation can be found in greater detail in our prior publications [12,13]. The
same bovine enamel specimens (N=20 per group) as examined previously were maintained
in their respective groups as follows:
(A) 0.21%
NaF plus TCP (Clinpro
Tooth Crème, 3M, USA) and
(B) 1.1% NaF plus TCP (Clinpro 5000, 3M, USA) and
(C) 0% NaF (Toms of Maine, Colgate, USA). Each group of enamel specimens were
cycled in a remineralization/demineralization pH cycling model lasting 10 days
[6,12,19,21]. This daily cycling model comprised immersion of inverted
specimens in two two-minute treatment events performed an hour apart in the
morning, followed by one fourhour polyacrylic acid-lactic acid challenge (15
mL, pH=5.0), and finally two more two-minute treatment events in the afternoon.
Treatments were diluted with distilled water (5g paste: 10 ml distilled water).
Specimens were inverted and immersed in artificial saliva in between the daily
treatments and acid challenge, as well as overnight. An example of 10 enamel
specimens mounted in acrylic and cycled in this pH model is shown in Figure 1.
Cross-sectional
microhardness (CSMH)
Ten of the 20
cycled specimens from each dentifrice group,
along with 10 sound and 10 WSL enamel specimens, were then prepared for CMSH
assessments. First, a Lapcraft Lil’Trimmer circular saw (Powell, OH, USA) was
used to section the enamel specimens. The sections were then mounted with
ClaroCit methylmethacrylate-based cold mounting resin (Struers, Cleveland, OH,
USA) with the freshly cut surfaces exposed. The mounted specimens were serially
ground with 100, 600 and 1000 grit sandpaper (3M, St. Paul, MN, USA), and then
serially polished using a Leco Spectrum System 1000 grinder/polisher with 3 µm
microid diamond compound and compound extender for lubricant. Due to the
delicacy of the enamel in the whitespot lesion zone, which can lead to
undesirable cracking upon indentation, along with the spatial limitations of
multiple indents, we selected the Knoop indenter over the Vickers indenter. A
series of three indentation lanes per specimen were made under a load of 10 gf
at 12.5 µm, 25 gf at 25 and 37.5 µm, and 50 gf at 50, 75 and 100, 125 and 150
µm below the specimen surface. Measurements closer to the enamel surface (i.e.
less than 12.5 µm was not feasible at the given load limits due to the delicacy
of the specimens. This resulted in a total of 24 indents per specimen. The
Knoop indentation lengths were then converted to Knoop Hardness Numbers (KHN).
Relative to the KHN of sound enamel, relative lesions sizes in units of square
root of KHN (√KHN) multiplied by enamel depth (i.e. from 12.5 to 150 µm) were
calculated using Simpson’s Composite Rule [24,25]. In doing so, this estimated
lesion size (which is an area, with units of √KHN*µm) can be correlated with
approximate mineral volume content determined by transverse microradiography.

Figure 1: Top-view photograph of bovine enamel specimens mounted in acrylic and subjected to the pH cycling model.
Sample preparation for digital
light microscopy, FESEM and WAXD/SAXS measurements
The remaining 10 (of the 20)
specimens cycled in the pH model discussed above were then prepared for light
microscopy, FE-SEM and X-ray experiments. Thin enamel slices were excised from
the specimens cycled in the pH model; additionally, a separate set of 10 sound
and 10 WSL specimen slices were also excised. Excision was performed using KaVo
Gentlesilence LUX 800B handpiece with diamond point HP25B (Shofu Co. Japan).
After grinding and polishing with waterproof abrasive paper (type DCC 400, 800
and 2000 grit, Sankyo Rikagaku Co. LTD., Japan) by hand, the excised enamel
slabs had approximate thickness of 100 µm. While there exists the possibility
that enamel structure could be altered during the polishing procedure, we note
the relatively high intercrystalline density of the enamel specimens helps
reduce the risk for alteration of crystal morphology [14,15,18]. Notably,
similar polishing procedures in preparation of enamel cross-sections for
microhardness and optical measurements are routinely used but have not
demonstrated evidence of morphological alteration [58,14,24,25]; thus, based on
our polishing technique, along with assessments made at different positions of
multiple specimens (notably for the WAXD and SAXS measurements), we believe the
risk for introducing morphological anomalies via polishing is relatively low.
Digital light microscopy
Thin enamel slices were randomly
selected and assessed for thickness and lesion depth with an Axio Imager 2
digital light microscope (Zeiss Corporation, Germany). Darkfield reflected
light was used to confirm slice thickness using a Neofluar lenz objective at
50x magnification. Brightfield reflected light was used to assess lesion depth of
the enamel slice cross-sections using an Apochromat lenz objective at 200x
magnification.
Field emission scanning electron microscopy
(FE-SEM)
The thin enamel slices were
randomly selected for evaluation with a Zeiss Ultra 55 ultra-low voltage field-emission scanning
electron microscope (Germany). Samples were treated with osmium tetroxide
(Neoc-STB, Meiwaforsis Co., Japan) to reduce electrical charging of samples.
SE2 (Out-Lens SE (secondaryelectron image) detector) and In-Lens SE detectors
were used to collect scattered electrons operating at 1 kV. The aperture was
fixed at 60 µm and high-resolution magnifications of 2,000x (for the SE2
detector) and 30,000x (for the In-Lens SE detectors were used to image enamel
slice cross-sections from each of the five groups.
Wide-angle X-ray diffraction
(WAXD) and small-angle X-ray scattering (SAXS) Measurements
X-ray diffraction experiments
were performed at BL40XU of SPring-8 synchrotron radiation facility (Hyogo,
Japan) with X-ray energy of 15.0 keV [26]. A schematic of the experimental
setup is shown in Figure 2, and both SAXS (equatorial scattering) and WAXD
((100) reflection) were measured with the same detector [7,8]. An X-ray
microbeam was obtained by placing a 5 μm collimating pinhole on the focused
beam [27]. The beam was expanded to about 6 μm at the sample due to Fresnel
diffraction.
A guard pinhole with a diameter
of 200 μm was placed in front of the sample, resulting in an 80 mm separation
between the two pinholes. The X-ray flux was about 3×10¹¹ photons/sec, and the
X-ray detector was X-ray image intensifier (V7739, Hamamatsu Photonics,
Hamamatsu, Japan) coupled with a tandem lens to a cooled CCD camera
(ORCA-II-ER, Hamamatsu Photonics). The reciprocal spacing was calibrated with a
powder diffraction pattern of behenic acid silver salt (silver behenate).
Enamel slabs were then mounted vertically [Figure 3]. The X-ray beam passed
perpendicularly through each enamel slab surface. For each enamel slab, the
sample was moved to the left from the monitor’s view [Figure 4] so that the
X-ray beam scanned across the enamel from the surface towards dentin in 6 μm
steps. Diffraction patterns were recorded beginning in the airspace above the
horizontal slab surface down to 260 μm (only for those treated with Clinpro 5000
due to sample limitations) or 300 μm (all other groups); however, the ROI
(region of interest) in our study spanned from the edge of the slab surface
down to 200 μm, and included the sound and demineralized enamel zones only, so
the difference between 260 μm and 300 μm is a non-factor in our assessment of
enamel structure. For each enamel slab, 10 scans along different regions (i.e.
height of slab was adjusted) of the sample were collected in order to generate
a mean profile for the given sample. The detector exposure time was 600 msec. A
representative photograph of the relative sample and detector positions is
shown in Figure 5. We note that this simultaneous WAXD/SAXS experimental
setup reduces the scatter arc impinging on the detector, and results in the
lack of the characteristic (002) reflection commonly found for enamel.
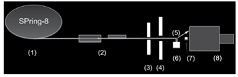
Figure 2: Schematic diagrams of the X-ray diffraction measurement set-up at BL40XU in the SPring-8 synchrotron radiation facility. The numbers indicate the following items: (1) synchrotron X-ray source (SPring-8), (2) two focusing mirrors, (3) collimating pinhole (about 5 μm diameter), (4) guard pinhole (200 μm diameter), (5) specimen (thin slice of bovine enamel), (6) remote-controlled vertical translation stage, (7) beam stop to avoid exposure of the direct beam on the detector, (8) X-ray detector (an image intensifier combined with a cooled CCD camera), Approximate distances are: from (1) to (2): 40 m; from (2) to (3): 10 m; from (3) to (4): 80 mm; from (4) to (5): 10 mm. The distance from (5) to (7) was about 200 mm.
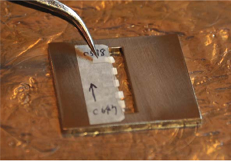
Figure 3: An example photograph of five thin enamel slabs mounted on a metal sample holder. All slabs were aligned within the window with the enamel edge made as horizontal as possible for the impinging perpendicular X-ray beam.
WAXD and SAXS Analyses
Fit2D software version 012 077
i686 WXP (ESRF98HA01T, France) was used to determine intensity collected from
each enamel specimen at each depth. VB program (Ozsystem, Japan) was made
accommodate the 24,500 CHI files of WAXD and SAXS data. WAXD/SAXS data ranging
from 0 μm to 150.0 μm, with 6.0 μm increments were analysed. Data points lying
outside of ±2 SD were considered outliers. Additional analytical detail can be
found in a prior publication [7].
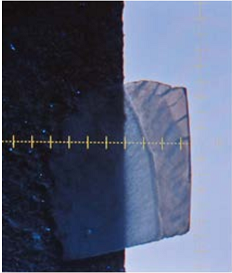
Figure 4: Example monitor view of the mounted enamel slab (thickness ~ 100 μm) from the Experimental Hutch. Each sample was scanned from the right (outer enamel surface) to the left (towards dentin) at 10 different slab positions using a remote-controlled vertical translation stage. The ROI (region of interest) spanned the edge of the slab down to 200 μm.
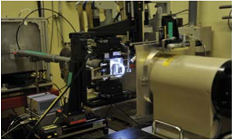
Figure 5: Photographic view of the stage (illuminated) and X-ray detector (far right). The enamel slabs were mounted on a windowed metal plate. The position of each slab was adjusted using a remote-controlled vertical translation stage to select the ROI and recorded using the X-ray detector and camera.
Statistical Analyses for CSMH and
WAXD/SAXS data
Based on our prior work, there
was a desire to probe whether significant differences between the two Clinpro
dentifrices could be identified in the CSMH and WAXD/SAXS
data sets; thus, statistical analyses were only performed comparing these two
groups (A and B) in order to draw parallels to our previous studies. In doing
so, a full statistical treatment of the data collected from all the methods
used in this study and for all the groups was intentionally not performed as
this was not the primary focus of the study. Statistics were determined using
the statistical package SAS-JMP (SAS Institute, USA). The mean values of KHN,
WAXD and SAXS at each depth (12.5 μm through 150 μm for KHN, 0 μm through 150
μm for WAXD and SAXS) for Clinpro Tooth Crème (A) and Clinpro 5000 (B) were
defined as independent variables. Each measurement was considered of equivalent
variance so parametric testing (Student’s t-test) of the mean value between
Clinpro Tooth Crème and Clinpro 5000 was performed. Data points lying outside
of 2 SD were considered outliers. Data were normally distributed.
Results
Cross-sectional microhardness
(CSMH)
Ten (of the 20) specimens cycled
in the pH model were assessed for CSMH. Ten sound and ten WSL control specimens
were also evaluated for CSMH. The mean Knoop Hardness Number (KHN) for WSL
treated with each of the dentifrices at enamel depths ranging from 12.5 μm to
150 μm is shown in Figure 6. For reference purposes, the depth-dependent KHN
values for control sound (S) and WSL (W) are also shown. CSMH measurements on
sound enamel yields a relatively constant profile. We note that microhardness
measurements are recorded by adjusting the applied load to best match the
strength of the material of interest. To avoid the risk of fracture near the
outer surface of the delicate specimens, lower loads (i.e. 10 gf and 25 gf,
respectively) were used in assessing the strength of the WSL specimens (from
the three dentifrices groups and the WSL control) at the depths of 12.5 μm and
25 μm. The load of 50 gf was used for all five groups at depths spanning 37.5
μm to 150 μm. The observation of slightly elevated KHN values at 12.5 and 25 μm
may be attributed to indentation size effects, which may arise from inherent
structural variations within substrates [28], including the differences in
strength between enamel near the outer surface and that closer to dentin [29].
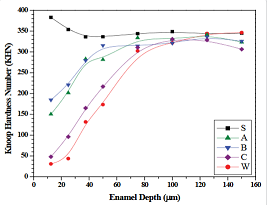
Figure 6: CSMH line profiles for the five groups (A, B, C, S and W) assessed for Knoop Hardness along the enamel cross-sections. Estimated lesion sizes for groups A, B, C and W were made using these CSMH line profiles. The letters correspond to the following groups: 0.21% NaF dentifrice (A); 1.1% NaF dentifrice (B); 0% NaF dentifrice (C); sound enamel control (S); and, WSL control (W).
The CSMH profile exhibiting the
lowest KHN values corresponds to the control WSL (W). CSMH recovery to hardness
similar to sound enamel (S) appears about 75 μm for the four WSL groups. All
three dentifrice groups produced stronger enamel relative to the baseline WSL
control, demonstrating the pH model is sensitive to remineralization. Among the
three dentifrice groups, the enamel lesions exposed to the fluoride-free
dentifrice (C: Tom’s of Maine) produced significantly lower KHN values within
the body of the lesion [Figure 6]. The 0.21% NaF (A: Clinpro Tooth Crème) and
1.1% NaF (B: Clinpro 5000) dentifrices were significantly different (p <
0.05) only at 50 μm (A < B) and 75 μm (A > B).
The estimated mean (standard
error of the mean) relative lesion sizes (in units of √KHN*μm) for the WSL
control and the lesions treated with A, B, or C dentifrices in the cycling
model were calculated to be 471.4 (35.0), 170.9 (24.5), 191.2 (25.6) and 367.9
(23.7), respectively. The percent remineralization (% Remin) relative to the
baseline WSL (W) is expressed as follows:
% Remin = Rx - Dw/Dw
x 100
where DW corresponds to the WSL
control relative lesion size and RX corresponds to the relative lesion size of
W treated with
three dentifrices groups (X = A,
B or C) in the pH cycling model. Relative to the W control, the % Remin was
approximately 64%, 59% and 22%, respectively for each of the dentifrice groups
A, B and C. Comparisons in relative lesion size and percent CSMH
remineralization between groups A and B were not statistically significant;
however, groups A and B were significantly greater than dentifrice group C.
Digital light microscopy
The remaining 10 specimens (from
the initial 20) cycled in the pH cycling model were assessed with digital light
microscopy to confirm 100 μm slice thicknesses and to view the size of the
subsurface lesions after remineralization. Representative darkfield reflected
light images of thin enamel slices for each of the five groups (A, B, C, S and
W) are shown in Figure 7, where the thickness of the specimen slices was
approximately 100 μm. Brightfield reflected light images of the enamel slice
cross-sections for each of the five groups (A, B, C, S and W) are shown in
Figure 8. The optical lesion size of the control WSL (W) specimen ranges
between 60 and 80 μm across the width of the slice. All three dentifrice groups
(A, B and C) appear to produce smaller enamel lesions relative to the control
WSL, with group B producing the smallest and group C producing the largest.
Field emission scanning electron
microscopy (FE-SEM)
Representative FE-SEM images of the
five enamel groups at low and high magnifications are compiled in Figures 9 and
10, respectively. Each of the morphologies of the enamel groups are unique and
exhibit the following distinctions. The crystallites in sound enamel appear
dense and well-ordered (e.g. canted to the right), with most of the widths than
100 nm (approximately). Relative to sound enamel crystallites, the crystallites
in WSL enamel appear randomly oriented, loosely-packed and many have estimated
widths near to or greater than 100 nm. The crystallites in group A appear to be
a combination between sound and WSL enamel crystallites, where the estimated
crystallites widths are at or greater than 100 nm but retain, and are
relatively dense and wellaligned. The relatively small, densely-packed
crystallites in group B differ markedly in morphology and size compared to the
other four enamel groups, including the existence of many crystallites smaller
than 100 nm. The crystallites in group C are generally larger than 100 nm, are
heterogeneously oriented, and are loosely packed, resulting in a relatively
porous matrix.

Figure 7: Darkfield reflected light images (Neofluar lenz, 50x magnification, Axio Imager 2, Zeiss Corporation, Germany) of randomly selected enamel slice thickness (about 100 μm) for each of the five groups. The letters correspond to the following groups: 0.21% NaF dentifrice (A); 1.1% NaF dentifrice (B); 0% NaF dentifrice (C); sound enamel control (S); and, WSL control (W).
X-ray Diffraction: WAXD and SAXS
Representative WAXD/SAXS patterns from the
five groups of enamel specimens (100 μm thick) within the white-spot lesion are
shown in Figure 11. Each scattering profile corresponds to the diffraction from
hydroxyapatite (HAp) crystallites and is consistent with the patterns obtained
previously [7,8]. The principal (100) reflection peak in the sound enamel (S)
pattern is indicated with a solid white arrow. Visible in each of the five
patterns, this diffraction peak appears prominent for sound enamel but appears
attenuated in the WSL control (W) and enamel specimens treated with dentifrices
A, B and C. The equatorial scattering (i.e. orthogonal to the c-axis) is also
present in each of the five patterns and is indicated with a dashed white arrow
in the sound enamel pattern.
 .
.
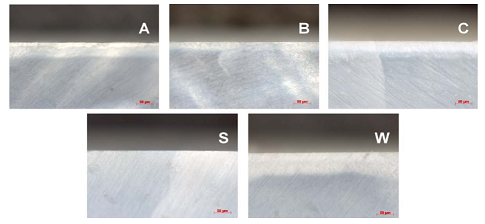
Figure 8: Brightfield reflected light images (Apochromat lenz, 200x magnification, Axio Imager 2, Zeiss Corporation, Germany) of randomly selected enamel slice cross-sections for each of the five groups (the 50 μm scale bar is shown in red on the bottom right). The letters correspond to the following groups: 0.21% NaF dentifrice (A); 1.1% NaF dentifrice (B); 0% NaF dentifrice (C); sound enamel control (S); and, WSL control (W).
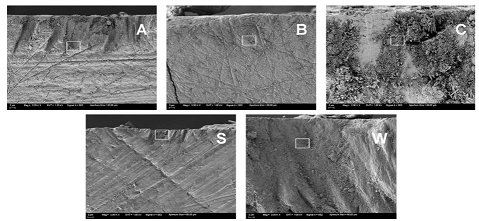
Figure 9: Low magnification (2,000x) FE-SEM images of randomly selected enamel slice cross-sections for each of the five groups under ultra-low voltage conditions (1kV, SE2 detector) at approximately 12 μm into the subsurface lesion. For all images the scale bar corresponds to 2 μm. The white boxes in each image mark the high magnification region for Figure 10. The letters correspond to the following groups: 0.21% NaF dentifrice (A); 1.1% NaF dentifrice (B); 0% NaF dentifrice (C); sound enamel control (S); and, WSL control (W).

Figure 10: High magnification (30,000x) FE-SEM images of randomly selected enamel slice cross-sections for each of the five groups under ultra-low voltage conditions (1kV, In-Lens SE detector) at approximately 12 μm into the subsurface lesion. For all images the scale bar corresponds to 100 nm. These images pertain to the white square zones shown in Figure 9. The letters correspond to the following groups: 0.21% NaF dentifrice (A); 1.1% NaF dentifrice (B); 0% NaF dentifrice (C); sound enamel control (S); and, WSL control (W).

Figure 11: WAXD/SAXS patterns of randomly selected enamel slice cross-sections for each of the five groups at approximately 30 μm into the subsurface lesion. The solid white arrow in S corresponds to the (100) HAp reflection, while the dashed white arrow corresponds to equatorial scattering. The letters correspond to the following groups: 0.21% NaF dentifrice (A); 1.1% NaF dentifrice (B); 0% NaF dentifrice (C); sound enamel control (S); and, WSL control (W).
The mean normalized integrated
intensity of the equatorial (100) HAp reflection from the surface of enamel
down to 150 μm in 6 μm increments is shown in Figure 12. For each group,
normalization was performed to account for potential variations in enamel slab
thickness using the average intensity within the region from 150 to 200 μm.
Relative to the sound enamel control, intensity recoveries varied among the
groups. The WSL control group produced a unique line profile that gradually
recovered beyond 100 μm. Group C specimens produced a different lineshape that
recovered around 48 μm. Groups A and B produced similar lineshapes, which were
also similar to the sound enamel control lineshape, but differences were
observed. First, group A and B
specimens produced scattering
that recovered around 36 μm and 48 μm, respectively. Second, group B specimens
produced greater scatter intensity relative to Group A specimens; in fact,
group B produced the largest scattering signal among the five groups.
Statistical considerations were made only with respect to the two fluoride
dentifrice groups in order to compare these present results with previous
micro-computed tomography results [12,13]. Between the two fluoride
dentifrice groups, significant differences were found (p < 0.05) with group
B significantly greater than group A at the 12, 18, 114 and 120 μm measurement
increments.
The mean normalized integrated
intensity of the equatorial small-angle X-ray scattering from the surface of
enamel down to 150 μm in 6 μm increments is shown in Figure 13. The total
equatorial intensity was obtained by summing the intensity in the region q >
1.1 nm-1. Normalization was similarly performed as discussed above [7,8].
Relative to the sound enamel control, intensity profiles were distinct among
groups. The intensity from WSL control specimens produced a unique lineshape that
peaked near 36 μm and trailed beyond 100 μm. Group C produced a similar
lineshape and maximum intensity at 36 μm compared to the WSL control but
recovered near 84 μm. Group A specimens produced a narrower lineshape relative
to group C and WSL specimens, peaking around 30 μm and recovering near 72 μm.
Group B specimens produced the strongest intensity, peaking at 24 μm and
recovering near 72 μm. Statistical considerations were again made only with
respect to the two fluoride dentifrice groups.

Figure 12: The mean normalized integrated intensity of the equatorial (100) HAp reflection from the surface of enamel down to 150 μm within the enamel cross-section. The letters correspond to the following groups: 0.21% NaF dentifrice (A); 1.1% NaF dentifrice (B); 0% NaF dentifrice (C); sound enamel control (S); and, WSL control (W).
in order to compare these present
results with previous microcomputed tomography results [12,13]. Between the two
fluoride dentifrice groups, significant differences were found (p < 0.05)
with group B significantly greater than group A at the 0, 12, 18, 24, 30, 36 and
42 μm measurement increments.
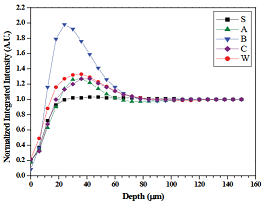
Figure 13: The mean normalized integrated intensity of the equatorial small-angle X-ray scattering from the surface of enamel down to 150 μm within the enamel cross-section. The letters correspond to the following groups: 0.21% NaF dentifrice (A); 1.1% NaF dentifrice (B); 0% NaF dentifrice (C); sound enamel control (S); and, WSL control (W).
Discussion
Nearly 55 years ago a
breakthrough was published on the ability to measure the strengthening effect
of calcium and phosphate on demineralized enamel [30]. Realizing
calcium-deficient mineral zones are manifest in dental apatite [14,15], topical
therapies (e.g. fluoride dentifrice) are a widely used frontline approach in
preventing, arresting or even reversing the caries process [31]. An especially
clinically effective option, 1.1% NaF dentifrices are designed for those most
at-risk for caries development, including those with a history of caries
[23,32]. Additionally, modalities manifesting a combination of fluoride (e.g.
between 900 and 1450 ppm F-) and other agents, including various forms of calcium
and phosphate,
are driving innovations in topical therapies and raising the bar on the level
of standard care [2]. Concomitant with such endeavors, advances in experimental
techniques continue to provide new tools in order to learn more about the
caries process [7,9], including the influence of topical fluorides on enamel
lesion microstructure.
The aim of the present study was
to assess the microstructure of incipient caries lesions treated with 0.21% and
1.1% NaF dentifrices in vitro. This is the first report on the application of
WAXD/ SAXS measurements on incipient enamel lesions subject to a pH cycling
model comprising dentifrice treatments acid challenge and remineralization
events. The in vitro pH cycling model and the incipient enamel lesions used in
this study were chosen based on their established sensitivity to fluoride and
clinical relevance [6,19-23]. The two fluoride dentifrices (Clinpro Tooth Crème
and Clinpro 5000) comprise a functionalized tricalcium phosphate component that
is designed to complement and improve fluoride’s mineralizing action on
weakened enamel [6,21,33,34]. Also, these dentifrices have demonstrated
clinical efficacy and are available in many countries throughout the world
[23,35-39]. As the inactive ingredient composition and dentifrice format are
nearly similar between the two dentifrices (with the primary exception of
fluoride content), these dentifrices provide a unique opportunity to test the
fluoride dose-response effect on lesion microstructure without the influence of
dentifrice formulation factors (e.g. abrasive system, fluoride salt, foaming
characteristics, viscosity, pH, etc.).
With respect to sound and WSL
enamel, it is known that surviving crystallites in carious enamel tend to be
wider and thicker compared to sound enamel [15], and this is consistent with
our FESEM results. CSMH measurements correlate with mineral content as shown in
transverse microradiography of enamel lesions [24,25]. Though larger crystals
may exist in the WSL, the frank reduction in the volume of crystals upon lesion
formation is clear based on our CSMH and WAXD results. Also, the mixed
orientation of crystallites generated upon lesion formation, as shown in our
FE-SEM results, may contribute to the relatively weak enamel microstructure.
The sharply resolved but diminutive scatter signal in the SAXS pattern for
sound enamel, suggests it arises from nonmineral material, such as carbonate
and water, residing in the intercrystallite spacings [7]. This signal appears
more pronounced in the SAXS pattern for WSL enamel, and can be attributed to
the surface scattering encompassing voids that evolved due to dissolution of
crystallites during lesion formation [7,15]. Overlapping this oriented feature,
the relatively intense smear-like scatter pattern from the WSL control specimen
suggests the lesion formation process produced substantial crystallite
dissolution along all three crystal axes, including the loss of entire
crystallites. Based on ultrastructural studies of carious lesion formation in
apatite, the dissolution of enamel during lesion formation likely initiates
along the (100) HAp plane where defects (e.g. edge dislocations, screw
dislocations, small angle boundaries, atomic vacancies or rotations) in the
imperfect enamel abound [14-18]. The nearly concomitant recoveries of the WAXD
and SAXS intensities around 100 μm in the WSL enamel indicate the incipient
lesions formed in this study do not effect marked structural changes within the
deeper sound enamel regions, and contrasts with a previous report that utilized
larger subsurface lesions [7].
Remineralization of the
subsurface lesions by the three dentifrice groups likely transpired by several
mechanisms, including restoration of partially dissolved crystals, the
formation of new crystals, and the growth of surviving crystals manifest in the
carious lesion [15]. All three dentifrice groups will almost certainly undergo
growth of surviving crystals by virtue of the pH cycling model, which was
designed to favor remineralization. The SAXS measurements may include information
related to restoration of partially dissolved crystals as well as new crystal
formation.
The fluoride-free dentifrice
group (Tom’s of Maine) effected remineralization that led to an increase in
CSMH and WAXD intensity. FE-SEM results indicate the mineralization effect
produces apatite-like crystallites; however, the crystallites seem to lack
regularity in size and orientation. This fluoride-free group relied primarily
on the artificial saliva to both nucleate and grow mineral within the incipient
lesions, and is similar to results demonstrating the remineralization effect of
artificial saliva [8]. Among the three dentifrice groups the fluoride-free
group produced the weakest CSMH over the 10-day cycling protocol, indicating
the artificial saliva constituents were not able to generate strong,
acid-resistant mineral in the course of repeated acidic exposures. The
observation that the fluoride-free dentifrice group produced a similar CSMH
slope compared to the control WSL within the subsurface region (i.e. up to 75
μm) indicates that the existing subsurface microstructure environments remained
similar during the cycling protocol. Furthermore, the (100) intensities across
enamel depth also displayed similar trending between the fluoride-free and WSL
control groups. Importantly, there is the possibility that nonenamel-like
calcium phosphate mineral may also have formed within the subsurface region. An
example of such mineral might be the metastable hydroxyapatite precursor,
octacalcium phosphate (OCP), which bears ultrastructure similarities to
hydroxyapatite and has been described as manifesting apatitic layers in its
unit cell structure [40]; in fact, the close lattice-matching of OCP with HAp
favors the growth of apatite from OCP crystals [40,41]. The slight
differences in the SAXS profiles
may also provide some distinctions and suggests a modest reduction in voids
(relating to void surface area rather than volume) by the fluoride-free group
by the evolution of new crystal formation. Such development appears reasonable
given the morphology of the mineral as shown by FE-SEM, and when CSMH results
are included, these results collectively suggest the formation of new
crystalline material strengthened the lesion microstructure relative to the WSL
control group.
The 0.21% NaF dentifrice group
(Clinpro Tooth Crème), which contains a conventional amount of fluoride
recommended for daily use by most populations [31], produced a distinct
remineralization profile relative to the other two dentifrice groups. Over the
course of the 10-day cycling protocol, this dentifrice increased the volume of
apatite crystals and increased the strength of the WSL microstructure.
Concomitant with the increase in apatite crystals as shown in the WAXD profile,
the SAXS
lineshape indicates the 0.21% NaF dentifrice affected void distribution,
resulting in a relatively narrower lineshape that recovers near the boundary of
the lesion (which is about 75 μm). This SAXS profile appears distinct compared
to both the fluoride-free group and the WSL control, and may suggest the
formation of new crystals within the body of the incipient lesion. As FE-SEM
demonstrated the presence of dense, well-oriented and apatite-like enamel had
formed within the subsurface lesion, this remineralization also improved the
strength of the lesion microstructure as measured by CSMH. The primary reason
for this improved action in the subsurface lesion is due to the presence of the
fluoride ion, which has long been shown to increase acid-resistance of enamel
[1]. Additionally, when combined with calcium and phosphate in solution,
fluoride has been shown to be an excellent nucleator of mineral [42], and may
function as a catalyst in the conversion of OCP to apatite [41]. In this
instance, the 0.21% NaF dentifrice provided strong, acid-resistance
remineralization relative to the fluoride-free group and the WSL control. This
dentifrice also contains the functionalized tricalcium phosphate agent (0.05
wt. %), which is designed to extend the action of fluoride and subsequently improve
mineralization, especially within subsurface lesions [6,21-23,34].
At content about five times higher than the
0.21% NaF dentifrice, the 1.1% NaF dentifrice group also conferred strong,
acid-resistant remineralization activity. A distinctive property of
high-fluoride gels and dentifrices is the relatively confined action of
fluoride at the enamel surface [23,32]. However, the 1.1% NaF dentifrice
evaluated in this study also contains functionalized tricalcium phosphate (0.08
wt. %), which has been shown to extend fluoride’s action deeper within the
subsurface lesion, without sacrificing fluoride’s action at the enamel surface
[2,6,23,34,36,37]. But the abundance of fluoride delivered from the dentifrice
influences the morphology and composition of newly formed mineral. As shown in
the FE-SEM images, the morphology of the mineral within the subsurface lesions
demonstrates a dense population of crystallites. The appearance of these
crystallites is not the same as those formed with the 0.21% NaF dentifrice, suggesting
the thermodynamics of mineral formation favor smaller crystals at higher
fluoride content. In addition to the (100) reflection of HAp observed in the
WAXD pattern and normalized intensity plot, there exists possibilities that
fluoride could incorporate within existing apatite framework (e.g.
isomorphically replacing OH-) or contribute to newly formed fluorapatite
crystals, which manifest a lattice interval (d = 8.12 Å) similar to that of
hydroxyapatite (d = 8.17 Å) [15]. Additionally, the possibility of small angle
boundary defects from newly formed apatite crystal imperfectly aligned with the
existing enamel framework may also contribute to WAXD measurements. It is
reasonable that newly formed crystals are a mixture of the above mentioned
possibilities, given the complexities of mineralization in subsurface lesions
[15]. Of particular interest is the SAXS profile produced by the 1.1% NaF
dentifrice, which produced strong scattering intensity within the subsurface
region. The SAXS setup used in this study is sensitive to material (or phases)
having nanometer-sized dimensions (e.g. between 1 and 100 nm). Because the
scattering reflects an environment having a large electron density, the strong
scatter intensity may be attributed to an abundance of newly formed
nanometer-sized crystallites. This view is supported with the existence of
nanometer sized crystallites within the subsurface region as shown in the
FE-SEM image. Further investigation into these mechanistic details, as well as
other variations of remineralization (or demineralization) experiments are
reserved for future studies.
Conclusions
In addition to digital light microscopy,
high-resolution field-emission scanning electron microscopy (FE-SEM) and
microhardness measurements, we utilized the BL40XU beamline of the SPring-8
third-generation synchrotron radiation facility in Hyogo, Japan to collect WAXD
and SAXS data within incipient enamel lesions. This is the first report that
utilized the simultaneous WAXD/SAXS technique to explore microstructure of
incipient lesions subjected to a remineralization/demineralization protocol
involving dentifrice treatments having different levels of fluoride. A main
conclusion from this work is that the WAXD and SAXS measurements were able to
resolve significant differences between the effects of two fluoride-containing
dentifrices on subsurface lesion microstructure. Altogether, our observations
demonstrate the pathological processes for remineralization are markedly
influenced by the presence and concentration of fluoride, the microstructural
characteristics of which can be distinguished using the simultaneous WAXD and
SAXS technique.
Acknowledgment
The synchrotron radiation experiments were
performed at the BL40XU of SPring-8 with the approval of the Japan Synchrotron
Radiation Research Institute (JASRI) (Proposal No. 2014B1048). We thank Mr.
Allen C. Mackey for assistance with cross-sectional micro hardness
measurements. Dr. Takatsugu Kobayashi advised preparing enamel slabs. Dr. Kenichi Shimizu who is honorary professor
at Keio University and visiting professor at Osaka city University advised
sample preparation, FE-SEM selection and SE2 and In-lens detector selection.
Author Contributions
Makoto Asaizumi conceived the project,
assisted in study design, data collection, data interpretation, and manuscript
preparation. Naoto Yagi designed WAXD/SAXS measurement and assisted in X-ray
data analyses. Koki Aoyama built the WAXD/SAXS system and assisted in X-ray
data analyses. Tomoaki Kato assisted in WAXD/SAXS data collection and analyses.
Shinichi Nagase contributed to X-ray analyses, including the development of the
VB software. Tetsuya Kuga participated in sample preparation and data
collection. Nahoko Oode, Takehide Oda, and Tsuguo Sakurada participated in
FE-SEM design and data collection. Tomohiro Tabara assisted in light microscopy
design and data collection. Robert Karlinsey assisted in study design, data
interpretation and manuscript preparation.
Conflicts of Interest
Dr. Karlinsey is the managing
member of Indiana Nanotech, which has a commercial relationship with 3M Oral
Care, whose products were used in this manuscript. Miss. Oode, Drs. Asaizumi,
Yagi, Kato, Kuga, and Messrs. Aoyama, Oda, Sakurada, Nagase and Tabara declare
no conflicts of interest.
References
1. Muhler JC, Radike AW,
Nebergall WH, Day HG. The effect of a stannous fluoride-containing dentifrice
on caries reduction in children (1954) J
Dent Res 33: 606-612.
2. Amaechi BT. Remineralization
therapies for initial caries lesions (2015) Current Oral Health Reports 2:
95-101.
3. Featherstone JD, Doméjean S.
The role of remineralizing and anticaries agents in caries management
(2012) Adv Dent Res 24: 28-31.
4. Sullivan HR. The formation of
early carious lesions in dental enamel. I (1954) J Dent Res 33: 218-230. 5. White DJ. The
comparative sensitivity of intra-oral, in vitro, and animal models in the
‘profile’ evaluation of topical fluorides (1992) J Dent Res 71 Spec No: 884-894.
6. Karlinsey RL, Mackey AC, Walker ER, Amaechi
BT, Karthikeyan R, et al., Remineralization potential of 5,000 ppm fluoride
dentifrices evaluated in a pH cycling model (2010) J Dent Oral Hygiene 2:1-6.
7. Yagi N, Ohta N, Matsuo T,
Tanaka T, Terada Y, et al.. Evaluation of enamel crystallites in subsurface
lesion by microbeam X-ray diffraction (2009)
J Synchrotron Radiat 16: 398-404.
8. Tanaka T, Yagi N, Ohta T, Matsuo Y, et al.,
Evaluation of the distribution and orientation of remineralized enamel
crystallites in subsurface lesions by X-ray diffraction (2010) Caries Res 44:
253-259.
9. Gaiser S, Deyhle H, Bunk O,
White SN, Müller B. Understanding nanoanatomy of healthy and carious human
teeth: a prerequisite for nanodentistry (2012) Biointerphases 7: 4.
10. Deyhle H, White SN, Bunk O,
Beckmann F, Müller B. Nanostructure of carious tooth enamel lesion (2014) Acta Biomater 10: 355-364.
11. Siddiqui S, Anderson P,
Al-Jawad M. Recovery of crystallographic texture in remineralized dental enamel
(2014) PLoS One 9: e108879.
12. Asaizumi M, Karlinsey RL,
Mackey AC, Kato T, Kuga T. In vitro assessments of white-spot lesions treated
with NaF plus tricalcium phosphate (TCP) toothpastes using microtomography
(micro-CT) (2013) J Dent Oral Hygiene 5: 68-76.
13. Asaizumi M, Uesugi K, Hoshino
M, Kato T, Mackey AC, et al., In vitro assessments of white-spot lesions
treated with NaF plus tricalcium phosphate (TCP) toothpastes using synchrotron
radiation micro-computed tomography (SR micro-CT) (2014) J Dent Oral Hygiene
6:10-21.
14. Featherstone JD, Goodman P,
McLean JD. Electron miscroscope study of defect zones in dental enamel
(1979) J Ultrastruct Res 67: 117-123.
15. Yanagisawa T, Miake Y.
High-resolution electron microscopy of enamelcrystal demineralization and
remineralization in carious lesions (2003)
J Electron Microsc (Tokyo) 52: 605-613.
16. Voegel JC, Frank RM. Stages in the
dissolution of human enamel crystals in dental caries (1977) Calcif Tissue Res 24: 19-27.
17. Arends J, Jongebloed WL.
Ultrastructural studies of synthetic apatite crystals (1979) J Dent Res 58: 837-843.
18. Kerebel B, Daculsi G, Kerebel
LM. Ultrastructural studies of enamel crystallites (1979) J Dent Res 58: 844-851.
19. White DJ. Reactivity of
fluoride dentifrices with artificial caries. I. Effects on early lesions: F
uptake, surface hardening and remineralization (1987) Caries Res 21: 126-140.
20. White DJ. Use of synthetic
polymer gels for artificial carious lesion preparation (1987) Caries Res 21: 228-242.
21. Karlinsey RL, Mackey AC, Walker ER,
Frederick KE. Surfactant-modified ß-TCP: structure, properties, and in vitro
remineralization of subsurface enamel lesions (2010) J Mater Sci Mater Med 21:
2009-2020. 22. Mensinkai PK, Ccahuana-Vasquez RA, Chedjieu I, Amaechi BT,
Mackey AC, et al.. In situ remineralization of white-spot enamel lesions by 500
and 1,100 ppm F dentifrices (2012) Clin
Oral Investig 16: 1007-1014.
23. Amaechi BT, Ramalingam K, Mensinkai PK,
Chedjieu I. In situ remineralization of early caries by a new high-fluoride
dentifrice (2012) Gen Dent 60: e186-192.
24. Featherstone JD, ten Cate JM, Shariati M,
Arends J. Comparison of artificial caries-like lesions by quantitative
microradiography and microhardness profiles (1983) Caries Res 17: 385-391.
25. Kielbassa AM, Wrbas KTh,
Schulte-Monting J, Hellwig E. Correlation of transversal microradiography and
microhardness on in situ-induced demineralization in irradiated and
nonirradiated human dental enamel (1999) Arch Oral Biol 44: 243-251.
26. Inoue K, Oka T, Suzuki T, Yagi N,
Takeshita K, et al., Present status of high flux beamline (BL40XU) at Spring-8
(2001) Nuclear Instruments and Methods A467-468: 674-677.
27. Ohta N, Oka T, Inoue K, Yagi
N, Kato S, et al., Structural analysis of cell membrane complex of a hair fibre
by micro-beam X-ray diffraction (2005) J Appl Cryst 38: 274-279.
28. Peng Z, Gong J, Miao H. On the description
of indentation size effect in hardness testing for ceramics: Analysis of the
nanoindentation data (2004) J Eur Ceram Soc 24: 2193-2201.
29. Xu C, Reed R, Gorski JP, Wang
Y, Walker MP. The Distribution of Carbonate in Enamel and its Correlation with
Structure and Mechanical Properties (2012)
J Mater Sci 47: 8035-8043.
30. Koulourides T, Cueto H,
Pigman W. Rehardening of softened enamel surfaces of human teeth by solutions
of calcium phosphates (1961) Nature 189:
226227.
31. Walsh T, Worthington HV,
Glenny AM, Appelbe P, Marinho VCC, et al. Fluoride toothpastes of different
concentrations for preventing dental caries in children and adolescents (2010)
Cochrane Database Syst Rev 1: CD0076868.
32. Tavss EA, Mellberg JR, Joziak
M, Gambogi RJ, Fisher SW. Relationship between dentifrice fluoride
concentration and clinical caries reduction (2003) Am J Dent 16: 369-374.
33. Karlinsey RL, Mackey AC,
Walker ER, Frederick KE. Preparation, characterization and in vitro efficacy of
an acid-modified beta-TCP material for dental hard-tissue remineralization (2010) Acta Biomater 6: 969-978.
34. Karlinsey RL, Pfarrer AM.
Fluoride plus functionalized β-TCP: a promising combination for robust
remineralization (2012) Adv Dent Res 24:
48-52.
35. Vanichvatana S, Auychai P. Efficacy of two
calcium phosphate pastes on the remineralization of artificial caries: a
randomized controlled double-blind in situ study (2013) Int J Oral Sci 5: 224-228.
36. Mannaa A, Carlén A, Zaura E,
Buijs MJ, Bukhary S, et al.. Effects of highfluoride dentifrice (5,000-ppm) on
caries-related plaque and salivary variables (2014) Clin Oral Investig 18: 1419-1426.
37. Mannaa A, Campus G, Carlén A,
Lingström P. Caries-risk profile variations after short-term use of 5000 ppm
fluoride toothpaste (2014) Acta Odontol
Scand 72: 228-234.
38. Naoum SJ, Lenard A, Martin
FE, Ellakwa A. Enhancing fluoride mediated dentine sensitivity relief through
functionalized tricalcium phosphate activity (2015) International Scholarly
Research Notices.
39. Thaper R, Karlinsey RL.
Clinical observations on the remineralization of Stage 1 enamel caries lesions
using a tray-based protocol: A case report (2015) Int Dent Oral Health 2.
40. Mathew M, Takagi S.
Structures of biological minerals in dental research (2001) Journal of Research
of the National Institute of Standards and Technology 106: 1035-1044.
41. Iijima M, Nelson DGA, Pan Y,
Kreinbrink AT, Adachi M, et al., Fluoride analysis of apatite crystals with a
central planar OCP inclusion: Concerning the role of F- ions on
apatite/OCP/apatite structure formation (1996) Calcif Tissue Int 59: 377-384.
42. Newesely H. Changes in
crystal types of low solubility calcium phosphates in the presence of
accompanying ions (1961) Arch Oral Biol 6: 174-180.