Introduction
For years, there has
been discussions concerning Low Carbohydrate Diet
(LCD) and Calorie Restriction (CR). Recent reports
have showed efficacy of LCD such as randomized controlled trials, systematic
review and meta-analyses [1-3].
Historically, Atkins and
Bernstein originally have started LCD in western countries [4,5].
Consecutively, clinical predominance of LCD have been shown by investigators
[6-9]. Furthermore, LCD has been applied widely to several diseases and
impaired states, such as metabolic syndrome (Met-S), obesity, nonalcoholic
fatty liver disease (NAFLD), cardiovascular
disease, and so on [10-12]
On contrast, in Japan,
the author have firstly introduced and reported LCD for T2DM in Japan and
developed LCD in lots of opportunities [13,14]. Subsequently, we reported
clinical studies concerning LCD with pathophysiological aspects [15-18].
In current study, we
investigated urinary C-Peptide immunoreactivity (u-CPR)
excretion in patients with Type 2 Diabetes mellitus (T2DM). Simultaneously, we
measured the average glucose and Morbus (M) value, and studied the detail
correlation among these biomarkers.
Subjects and Methods
In current study, the
subjects included 84 patients with T2DM, which were 33 males and 51 females.
They are 28-84 years old (yo) with 60.9 ± 10.9 (mean +/- SD) yo. in average, 63
yo in the median value.
Subjects were enrolled
from the in-patients of the educational admission for further evaluation and
treatment of T2DM. The protocol of diet therapy were as follows:
1) CR diet was provided
on day 1 and 2, which had 60% carbohydrates, 25% lipids and 15% protein with
1400 kcal/day.
2) LCD was provided from
3 to 14 days, which had 12% carbohydrates, 64% lipids and 24% protein with 1400
kcal/day.
3) This LCD has been
called super-LCD formula in our clinical research for LCD, which is one of the
Very low-carbohydrate ketogenic diet (VLCKD) by the definitions of LCD [13-16].
Examinations included
several kinds of glucose metabolism. The are 1) several basal biomarkers on
admission, 2) daily profile of blood glucose 7 times a day on day 2 (CR) and
day 4 (LCD), 3) u-CPR were measured on day 2 and day 4, 4) M value was
calculated from blood glucose level.
Morbus (M) value
Data obtained from daily
profile of blood glucose were calculated into Morbus (M) value. M value is the
index which represents both blood sugar level and mean amplitude of glycemic
excursions (MAGE) [19-22]. Regarding glucose variability, daily profiles of
blood glucose has been measured 7 times a day, which data were calculated into
average glucose and M value. M value has been proposed for researching average
glucose and MAGE. This index has been calculated as a logarithmic transformation
of the deviation of glycemia from an arbitrary assigned ideal glucose value.
Clinically, ideal glucose level would be around 120 mg/dL, then M value uses
120 mg/dL for the standard level. Consequently, M value expresses both the
average glucose value and the effect of glucose swings [19-22].
M value is calculated by
the following formula: M = MBS + MW, where MW = (maximum blood glucose−minimum
glucose)/20; MBS = the mean of MBSBS; MBSBS = individual M-value for each blood
glucose value calculated as (absolute value of [10×log(blood glucose
value/120)])3.
Concerning the
interpretation of M value, the standard range would be <180, borderline
180-320 and abnormal >320. Adequate sampling times a day have been argued
for detail and precise evaluation of glucose variability and MAGE. Similar
results were found on 7 times or 20 times of sampling per day [19,22,23]. It
also revealed similar results compared with the continuous glucose monitoring (CGM)
[22,24].
Statistical analyses
In this study, obtained
data was represented as the mean +/- standard deviation (SD) and also
represented median, quartile of 25% and 75% in biomarkers. For statistical
analyses, correlation coefficients were calculated using Pearson or Spearman
test of the Microsoft Excel analytical tool, which is Four steps Excel
Statistics 4th edition [25]. A significance level of less than 5% was
considered to be statistically significant.
Ethical Considerations
This study was conducted
in compliance with the ethical principles of the Declaration of Helsinki. It
was also along with Japans Act on the Protection of Personal Information along
with the Ministerial Ordinance on Good Clinical Practice (GCP) for Drug
(Ordinance of Ministry of Health and Welfare No. 28 of March 27, 1997). Ethical
committee meeting was held by physician, researchers, medical staff and legal
expert. Informed consent was obtained from the subjects. The study was
registered with UMIN #R000031211.
Results
Subjects were classified
into 4 groups according to M value. Data of M value in 4 groups were, 4–21,
23–66, 29–192, 200–728, respectively (Table 1). Each group has 21 subjects, and
other results of biomarkers were shown in Table 1.
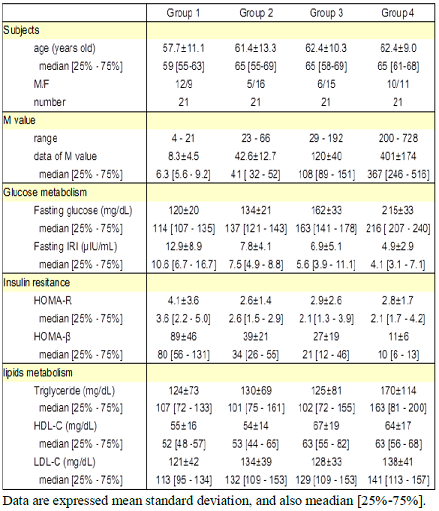
Table 1: Basal data of the subject classified into 4 groups
Fastingblood glucose and HbA1c value
increased from group 1 to group 4 in order (Figure 1). Each median value was
114, 137, 163, 216 mg/dL, and 6.2, 8.0, 7.8, 9.2%, respectively. The average
glucose on day 4 was decreased from that on day 2 in 4 groups (Figure 2).
Average glucose in median from day 2 to day 4 in each group was 123 to 107
mg/dL, 164 to 130 mg/dL, 193 to 156 mg/dL, 277 to 201 mg/dL, respectively.
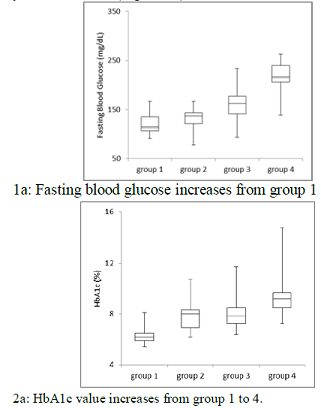
Figure 1: Blood glucose and HbA1c in 4
groups
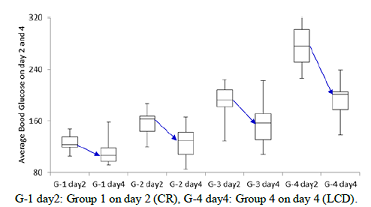
Figure 2: The changes of average blood glucose on day 2
and day4 in 4 groups
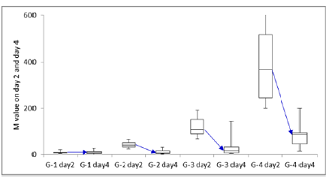
Figure 3: The changes of M value on day 2 and day 4 in 4
groups
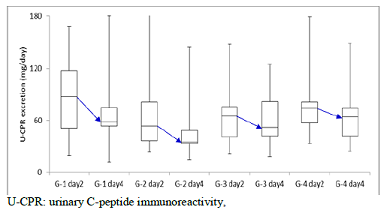
Figure 4: The changes of U-CPR excretion on day 2 and day 4 in4 groups
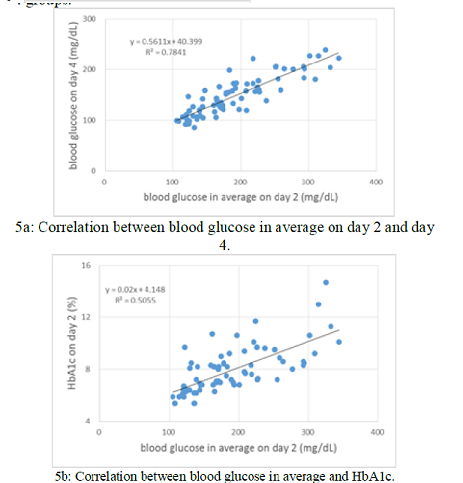
Figure 5: Correlation between blood glucose and HbA1c.Significant correlation was observed
between u-CPR on day 2 (CR) and day 4 (LCD) (p<0.01), in which the
regression curve showed y=0.75x + 4.5 (Figure 6a). There is no significant
correlation of ratio for day 4 to day 2 between average glucose and u-CPR
(Figure 6b)
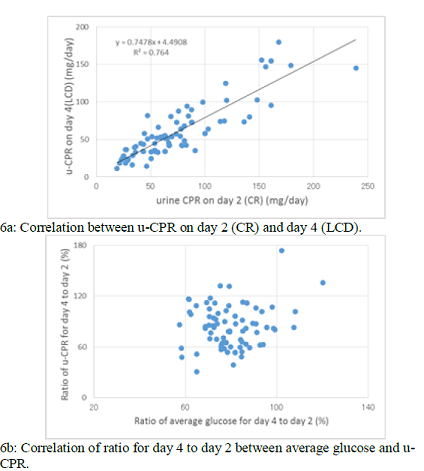
Figure 6: Correlation of u-CPR and
blood glucose
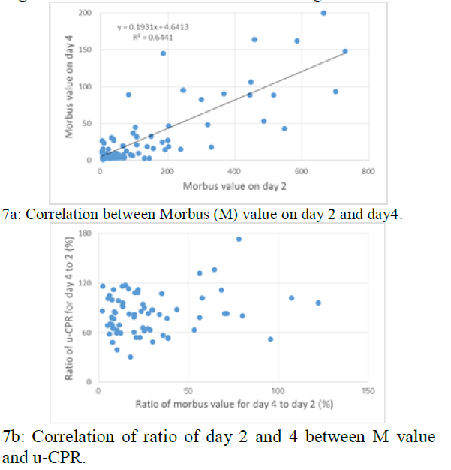
Figure 7: Correlation between Morbus (M) value and u-CPR
When calculated on daily
profile of blood glucose into M value, it decreased from day 2 to day 4 in
group 2,3 and 4 (Figure 3). M value in median from day 2 to day 4 in each group
was 6.3 to 9, 41 to 7, 108 to 16, 367 to 88, respectively.
U-CPR on day 2 and day 4
are shown in Figure 4. In each group, decreased value from day to day 4 was 88
to 58, 53 to 35, 65 to 52, 74 to 64, respectively.
There is significant
correlation between blood glucose in average on day 2 and day 4 (p<0.01)
(Figure 5a). There is significant correlation between blood glucose in average
and HbA1c (p<0.01) in which the regression curve showed y = 0.02 x + 4.2
(Figure 5b).
Significant correlation was observed between u-CPR on day 2 (CR) and day 4
(LCD) (p<0.01), in which the regression curve showed y=0.75x + 4.5 (Figure
6a). There is no significant correlation of ratio for day 4 to day 2 between
average glucose and u-CPR (Figure 6b).
There is significant
correlation between M value on day 2 and day4 (p<0.01) (Figure 7a). There is
no significant correlation of ratio of day 2 and 4 between M value and u-CPR
(Figure 7b).
Discussion
Recently, fundamental
and clinical research of LCD have been developed and prevalent [26,27], and we
have continued research for LCD with proposal for medical practice [28-30].
In this study, we
examined changes in average glucose, M value, urinary CPR in 2 days after diet
changed from CR to LCD. We also investigated the correlation among these
biomarkers, and clarified efficacy of LCD for the improvement of the profile of
blood glucose in short period.
M value has been useful
marker that would evaluated elevated blood glucose and increased MAGE. In this
diabetic research field, we have continued to study the detail of glucose
variability using M value [18,30,31].
As for current study, we
divided into 4 groups according to M value. Group 1 was mild, and group 4 was
severe in degree of diabetes. In Groups 2, 3 and 4, mean glucose and M values
clearly decreased from day 2 to 4. On contrast, group 1 includes mild diabetes
or pre-diabetic subjects. In other words, it seems that blood glucose and HbA1c
are close to normal people, and the insulin secretion ability is preserved
proportionally.
In group 1, blood sugar
in median decreased from 123 to 107 mg/dL, and u-CPR decreased remarkably from
88 to 55 mg/day. For meal protocols, CR for day 1, 2. and LCD for day 3,4 were
provided. In comparison of day 2 and day 4, the carbohydrate ratio is 60% vs.
12%, the carbohydrate amount per day is 210 g vs. 42 g. This difference in
carbohydrate intake possibly leads to lowering of blood glucose and lowering of
CPR in urine, with mutual correlation.
Average glucose
decreased in group 1 from day 2 to day 4, but the M value did not decrease. The
reason would be that the M value is calculated with the absolute value of blood
glucose away from 120 mg / dL, which is ideal blood glucose level.
Actually, several cases
in group 1 showed almost normal range of blood glucose at day 2. These cases
developed decreased blood glucose around 80-100 mg/L at day 4. That is why M
value in group 1 did not decrease from day 2 to day 4 [32,33].
In the protocol of
this study, diet therapy was changed from CR to LCD for T2DM. Among them, the
main investigation were u-CPR measurements in 2 days apart, and it was possible
to analyze the relationship with mean blood sugar and M value simultaneously.
As a result, the reduction in carbohydrate intake decreased blood glucose level
and glucose fluctuation, especially leading to a drastic decrease in M value.
In addition,
insulin secretion was suppressed due to a decrease in blood glucose spike,
leading to decreased u-CPR excretion which is an indicator of insulin
secretion. From the above, it can be said that the series of pathophysiological
pathway in diabetes has been improved in the short term. These results suggest
that LCD would have remarkable efficacy for nutritional treatment of diabetes.
Significant correlation
between blood glucose in average and HbA1c (p<0.01) was observed. Its
regression curve would indicate that HbA1c (%) = 0.02 x AG (mg/dL) + 4.2. When
x axis and y axis changes each other, the equation becomes AG = 25.3 x HbA1c –
12.2.
Well-known
equation has been reported by Nathan et al. which was AG = 28.7 x HbA1c – 46.7
analyzed from 2700 samples [34]. As a comparison, substitute HbA 1 c = 7, 8, 9%
into our formula and Nathans formula. Then, the result is 165.1 vs 154.2 mg /
dL, 190.2 vs 182.9 mg / dL, 215.5 vs 211.6 mg / dL, and both estimated values
are near and compatible.
We measured average
blood glucose 7 times a day. It is said that the difference from the
measurement of 20 times in the past is small and that the reliability is
actually high. The subjects in this research were 84 cases of type 2 diabetes,
including cases where HbA1c was low. Several cases in group 1 may showed lower
HbA1c and blood glucose may be a higher than that of normal subjects which has
the same HbA1c level.
On the other hand, study
by Nathan et al. included type 1 diabetes, type 2 diabetes and normal
individuals. Therefore, in regions where HbA1c is low, blood sugar levels are
expected to be lower because there are many samples of normal subjects.
Actually, if we enter 6% as HbA1c level into both formulas of ours and Nathan,
data would be 139.6 mg/dL vs 125.5 mg/dL.
U-CPR has
been a simple and useful test in the diagnosis of diabetes [35].
It has been said that u-CPR and serum CPR has been said to be highly correlated
[36]. Recently, measurement of u-CPR with creatinine would be recommended for more
accurate result [37,38].
C-peptide is clinically simple, noninvasive and useful
examination for diabetes. Its application would be spreading in various
situation, such as outpatient, in-patients and postprandial measurements
[39-41].
Conclusion
In this study, we
reported the changes in average glucose, M value and urine CPR value after meal
change from CR to LCD. Associated with several correlation among them, and our
results would become basic data for pathophysiological analysis of glucose metabolism
of future research.
Acknowledgement
The part of the content
of this article was presented at the 90th Scientific Meeting of Japan Endocrine
Society (JES) Annual Congress, Kyoto, 2017. The authors would like to thank the
patients and staffs for their cooperation and support.
Conflicts of Interest
The authors declare that
they have no conflicts of interest.
References
1)
van Wyk HJ, Davis RE, Davies JS. A critical review of low-carbohydrate
diets in people with Type 2 diabetes (2016) Diabet Med 33: 148-157. https://doi.org/10.1111/dme.12964
2)
Snorgaard O, Poulsen GM, Andersen HK, Astrup A. Systematic review and
meta-analysis of dietary carbohydrate restriction in patients with type 2
diabetes (2017) BMJ Open Diabetes Res Care 5: e000354. http://dx.doi.org/10.1136/bmjdrc-2016-000354
3) Namazi
N, Larijani B, Azadbakht L. Low-Carbohydrate-Diet Score and its Association with
the Risk of Diabetes: A Systematic Review and Meta-Analysis of Cohort Studies
(2017) Horm Metab Res 49: 565-571.
4) Atkins
R. Dr. Atkins new diet revolution, Rev edn (1998) Avon books, New York, USA.
5) Bernstein
RK. Dr. Bernsteins Diabetes solution: The Complete Guide to Achieving Normal
Blood Sugars (2007) Little, Brown US, New York, USA.
6) Accurso
A, Bernstein RK, Dahlqvist A, Draznin B, Feinman RD, Fine EJ et al. Dietary
carbohydrate restriction in type 2 diabetes mellitus and metabolic syndrome:
time for a critical appraisal (2008) Nutr Metab (Lond) 5: 9. https://doi.org/10.1186/1743-7075-5-9
7) Shai
I, Schwarzfuchs D, Henkin Y, Shahar DR, Witkow S, et al. Weight loss with a
low-carbohydrate, mediterranean, or low-fat diet (2008) N Engl J Med 359:
229-241.
8) Schwarzfuchs
D, Golan R, Shai I. Four-year follow-up after two-year dietary interventions
(2012) N Engl J Med 367: 1373-1374.
9) Atallah
R, Filion KB, Wakil SM, Genest J, Joseph L, et al. Long-Term Effects of 4
Popular Diets on Weight Loss and Cardiovascular Risk Factors: A Systematic
Review of Randomized Controlled Trials (2014) Circ Cardiovasc Qual Outcomes 7:
815-827. https://doi.org/10.1161/CIRCOUTCOMES.113.000723
10) Hashimoto
Y, Fukuda T, Oyabu C, Tanaka M, Asano M, et al. Impact of low-carbohydrate diet
on body composition: meta-analysis of randomized controlled studies (2016) Obes
Rev 17: 499-509. https://doi.org/10.1111/obr.12405
11) Haghighatdoost
F, Salehi-Abargouei A, Surkan PJ, Azadbakht L. The effects of low carbohydrate
diets on liver function tests in nonalcoholic fatty liver disease: A systematic
review and meta-analysis of clinical trials (2016) J Res Med Sci 21: 53. https://dx.doi.org/10.4103%2F1735-1995.187269
12) Tokuchi
Y, Nakamura Y, Munekata Y, Tokuchi F. Low carbohydrate diet-based intervention
for obstructive sleep apnea and primary hypothyroidism in an obese Japanese man
(2016) Asia Pac Fam Med 15: 4. https://doi.org/10.1186/s12930-016-0029-8
13) Ebe
K, Ebe Y, Yokota S, Matsumoto T, Hashimoto M, et al. Low Carbohydrate diet
(LCD) treated for three cases as diabetic diet therapy (2004) Kyoto Medical
Association Journal 51: 125-129.
14) Bando
H, Nakamura T. Carbo-count therapy and low carbohydrate diet (LCD) (2008) The
Journal of the Therapy 90: 3105-3111.
15) Bando
H, Ebe K, Nakamura T, Bando M, Yonei Y. Low Carbohydrate Diet (LCD): Long and
short-term effects and hyperketonemia (2016) Glycative Stress Research 3:
193-204.
16) Muneta
T, Kawaguchi E, Nagai Y, Matsumoto M, Ebe K, et al. Ketone body elevation in
placenta, umbilical cord, newborn and mother in normal delivery (2016)
Glycative Stress Research 3: 133-140.
17) Bando
H, Ebe K, Sakamoto K, Ogawa T, Bando M, et al. Remarkable Weight Reduction for
Low Carbohydrate Diet (LCD): Case Report (2017) Diabetes Case Rep 2: 130.
18) Bando
H, Ebe K, Muneta T, Bando M, Yonei Y. Effect of low carbohydrate diet on type 2
diabetic patients and usefulness of M-value (2017) diabetes Res Open J 3: 9-16.
19) Schlichtkrull
J, Munck O, Jersild M. The M-value, an index of blood sugar control in diabetics
(1965) Acta Med Scand 177: 95-102. https://doi.org/10.1111/j.0954-6820.1965.tb01810.x
20) Service
FJ, Molnar GD, Rosevear JW, Ackerman E, Gatewood LC, et al. Mean amplitude of
glycemic excursions, a measure of diabetic instability (1970) Diabetes 19:
644-655. https://doi.org/10.2337/diab.19.9.644
21) Moberg
E, Kollind M, Lins PE, Adamson U. Estimation of blood-glucose variability in
patients with insulin-dependent diabetes mellitus (1993) Scand J Clin Lab
Invest 53: 507-514
22) Siegelaar
SE, Holleman F, Hoekstra JBL Devries JH. Glucose Variability; Does It Matter?
(2010) Endocrine Reviews 31: 171-182. https://doi.org/10.1210/er.2009-0021
23) Monnier
L, Colette C. Glycemic Variability: Can We Bridge the Divide Between
Controversies? (2011) Diabetes Care 34: 1058-1059. https://dx.doi.org/10.2337%2Fdc11-0071
24) McDonnell
CM, Donath SM, Vidmar SI, Werther GA, Cameron FJ; A novel approach to
continuous glucose analysis utilizing glycemic variation (2005) Diabetes
Technol Ther 7: 253-263.
25) Yanai
H. Four step excel statistics, 4th Edition (2015) Seiun-sha Publishing Co.Ltd,
Tokyo, Japan.
26) Nakamura Y,
Okuda N, Okamura T, Kadota A, Miyagawa N, et al. Low-carbohydrate diets and
cardiovascular and total mortality in Japanese: a 29-year follow-up of NIPPON
DATA80 (2014) Br J Nutr 112: 916-924. https://doi.org/10.1017/S0007114514001627
27) Feinman
RD, Pogozelski WK, Astrup A, Bernstein RK, Fine EJ, et al. Dietary carbohydrate
restriction as the first approach in diabetes management: Critical review and
evidence base (2015) Nutrition 31: 1-13. https://doi.org/10.1016/j.nut.2014.06.011
28) Meng
Y, Bai H, Wang S, Li Z, Wang Q, Chen L. Efficacy of low carbohydrate diet for
type 2 diabetes mellitus management: A systematic review and meta-analysis of
randomized controlled trials (2017) Diabetes Res Clin Pract 131: 124-131. https://doi.org/10.1016/j.diabres.2017.07.006
29) Bando
H, Ebe K, Muneta T, Bando M, Yonei Y. Proposal for Insulinogenic Index
(IGI)-Carbo70 as Experimental Evaluation for Diabetes (2017) J Clin Exp
Endocrinol 1: 102.
30) Ebe
K, Bando H, Yamamoto K, Bando M, Yonei Y. Daily carbohydrate intake correlates
with HbA1c in low carbohydrate diet (LCD). (2018) J Diabetol 1: 4-9.
31) Bando
H, Ebe K, Muneta T, Bando M, Yonei Y. Investigation of uric acid and cystatin C
on low-carbohydrate diet (LCD) (2017) Diabetes Res Open J 3: 31-38.
32) Service
FH. Glucose variability (2013) Diabetes 62: 1398-1404.
33) Baghurst
P. Calculating the mean amplitude of glycemic excursion from continuous glucose
monitoring data: an automated algorithm (2011) Diabetes Technol Ther 13:
296-302. https://doi.org/10.1089/dia.2010.0090
34) Nathan
DM, Kuenen J, Borg R, Zheng H, Schoenfeld D, et al. A1c-Derived Average Glucose
Study Group. Translating the A1C assay into estimated average glucose values
(2008) Diabetes Care 31: 1473-1478. https://doi.org/10.2337/dc08-0545
35) Jones
AG, Hattersley AT. The clinical utility of C-peptide measurement in the care of
patients with diabetes. Diabet Med. 2013;30(7):803-17. https://doi.org/10.1111/dme.12159 .
36) Aoki
Y. Variation of endogenous insulin secretion in association with treatment
status: assessment by serum C-peptide and modified urinary C-peptide (1991)
Diabetes Res Clin Pract.14: 165-173. https://doi.org/10.1016/0168-8227(91)90017-8
37) Bowman
P, McDonald TJ, Shields BM, Knight BA, Hattersley AT. Validation of a
single-sample urinary C-peptide creatinine ratio as a reproducible alternative
to serum C-peptide in patients with Type 2 diabetes (2011) Diabet Med 29:
90-93. https://doi.org/10.1111/j.1464-5491.2011.03428.x
38) Besser
RE, Ludvigsson J, Jones AG, McDonald TJ, Shields BM, et al. Urine C-peptide
creatinine ratio is a noninvasive alternative to the mixed-meal tolerance test
in children and adults with type 1 diabetes (2011) Diabetes Care 34:
607-609. https://doi.org/10.2337/dc10-2114
39) McDonald
TJ, Perry MH. Detection of C-Peptide in Urine as a Measure of Ongoing Beta Cell
Function (2016) Methods Mol Bio 1433: 93-102. https://doi.org/10.1007/7651_2016_330
40) Sonoda R,
Tanaka K, Kikuchi T, Onishi Y, Takao T, Tahara T, et al. C-Peptide Level in
Fasting Plasma and Pooled Urine Predicts HbA1c after Hospitalization in
Patients with Type 2 Diabetes Mellitus (2016) PLoS One 11: e0147303. https://doi.org/10.1371/journal.pone.0147303
Saisho Y. Postprandial
C-Peptide to Glucose Ratio as a Marker of β Cell Function: Implication for the
Management of Type 2 Diabetes (2016) Int J Mol Sci 17: E744. https://doi.org/10.3390/ijms17050744
1) Corresponding
author: Hiroshi Bando, Tokushima University/Medical Research,
Nakashowa 1-61, Tokushima 770-0943 Japan Tel: +81-90-3187-2485, E-mail: pianomed@bronze.ocn.ne.jp
Citation: Bando H, Ebe K, Muneta T, Bando M, Yonei Y. Urinary
C-Peptide Excretion for Diabetic Treatment in Low Carbohydrate Diet (LCD)
(2018) Journal of Obesity and Diabetes 1: 13-18