
 PDF
PDF
Introduction
According to World Health Organization data, cardiovascular diseases represent the most frequent cause of death worldwide. Among these diseases, atherosclerosis which develops unevenly along the coronary tree, remains the leading cause of death. Influence of vessel geometry and hemodynamic characteristics on the development of vascular pathologies as atherosclerosis was demonstrated through several studies and Wall Shear Stress (WSS) has been shown to play a key role in the evolution of blood vessel diameter due to the accumulation of plaque. Among other locations, several studies have indicated that arteries that bifurcate are more prone to develop atherosclerotic lesions .The morphology of the coronary bifurcations varies depending on their location in the coronary artery tree. In addition, a specific bifurcation may change its morphology due to an intervention, for example, after the placement of a stent. On other hand, it is widely known that areas with low WSS are more prone to plaque formation. There are several ways to measure WSS and criteria to characterize those areas that could potentially be more affected by atherosclerosis. One of these methods is to find the minimum value of the wall shear stress. Another way to identify these areas of larger probability of developing atherosclerosis is by setting a WSS value below which we consider that the deposition of plaque is more likely to occur [1-12].
This value is quite variable.
While some studies consider that this value should be set to 0.4 Pa [4], others
consider that deposition takes place when the value of WSS does not exceed 1 Pa
[13] or 1.26 Pa [14]. Morbiducci, et al., (2016) [15] review the factors
affecting WSS and plaque formation, reaching the conclusion that geometry
together with other biological and hemodynamic factors decisively affect plaque
formation. Pinho, et al., (2019) [16] and Gallo, et al., (2012) [17] use in
their studies real artery geometries extracted from a medical image. Whereas
Pinho, et al., (2019) [16] observe that lower values of parameters such as
tortuosity or cross-sectional area of the right ventricular branch lead to
hemodynamic conditions susceptible to atheroma formation, Gallo, et al., (2012)
[17] demonstrate that there is a strong relationship between helical flow
patterns and exposure to disturbed shear on carotid bifurcation. Other factors
such as the presence of stenosis [18,19], angle of bifurcation [11,19,20] and
the elastic behavior of the walls [21] have an influence on the evolution of
the plaque formation and the distribution of pressure in the blood vessels.
A recent result by Otero-Cacho, et
al., (2018) [11] demonstrated the important role played by the bifurcations in
the coronary tree and their geometry in plaque deposition. Compared to the
existing literature, our work focuses on the topology of the vertex itself
whose anatomical differences are as numerous as vessels. Their effect on the
plaque formation risk will be analyzed for a wide range of different idealized
configurations. Furthermore, other parameters such as the opening angle and the
blood vessel diameter are studied together to better understand their influence
in the flow distribution. The morphological differences of the bifurcations
that are found in the human body are very diverse. Nevertheless, analyzing some
simplified geometries enlightens the type of problems and phenomena that can be
observed in real more-complex geometries. Of all bifurcations in the coronary
system, LM-LAD-LCx bifurcations are most often affected by disease [15].
Thus, along this manuscript we
will consider different idealized symmetric and non-symmetric geometries
describing an idealized vessel bifurcation based on LM-LAD-LCx bifurcations and
other common configurations in the coronary system. Also, the geometrical
specificities of the bifurcation itself will be considered in detail as they
play an important role in the local flow. The paper is organized as follows.
After the introduction, the details of the simulated model are presented as
well as the numerical methods to solve it. The results section is divided into
two subsections. The first part is devoted to understanding the role played in
the blood circulation by the actual geometry of the bifurcation vertex itself.
This case is analyzed, for simplicity, considering a symmetrical bifurcation.
The second part of the results deals with non-symmetric bifurcations and the
effect of the bifurcation angle and the vessels diameters in order to identify
those areas more prone to plaque formation. The final section presents the
conclusions of the study.
Material
and Methods
Geometries
Symmetric
bifurcations: The first part of the results is
dedicated to the influence of the topology of the bifurcation itself on the WSS
distribution and, consequently, on the possible plaque deposition. For this
study and for simplicity, we consider a symmetric bifurcation so that the
effect of the vertex geometry is not masked by other factors. Thus, all the
vessels considered are endowed with the same diameter. Thus, a mother vessel of
2mm of diameter splits in two daughter vessels each with the same diameter (D1
= D2 = D3 = 2 mm). To characterize the topology of the
bifurcation, two parameters are introduced in the model that describe, on the
one hand, the transition from the mother vessel wall into the outer walls of
the two daughter vessels. This is described by the radius of curvature of the outer
wall at the bifurcation (Ro). On the other hand, we also considered
the curvature of the wall that provides the transition between the two daughter
vessels. And this value is measured by the radius of curvature Rv. Figure 1 presents a scheme of the
symmetric configuration with the control parameters (Ro and Rv)
marked on it.

Non-symmetric
bifurcations: Two idealized different configurations
of non-symmetric bifurcations are studied. In the first configuration, the
proximal main vessel diameter (D1) is kept equal to the distal main
vessel diameter D3 (D1 = D3 = 2mm). The side
branch diameter (D2) varies from 0.5 to 2 mm. On the other hand, and
for the other configuration mentioned before, we consider an approximation to
the observed situation in coronary arteries that the vessels tend to decrease
their diameter after a bifurcation. This decrease in the diameters has been
modelled by the Finet’s Law [22] that is widely used in clinical applications
[23,24] and it is expressed by,
Thus, for the second
non-symmetric configuration used we strictly apply the Finet’s law. The inlet
diameter of the proximal main vessel is always kept equal to D1 =
2mm for all the simulations. Three different diameters (1.0, 1.5 and 2.0 mm)
are considered for the side branch and the distal main vessel diameters are
calculated using the formula above. In order to keep consistency with
experimental evidence, the distal main vessel diameter is always considered
smaller than the diameter of the proximal main vessel [25]. Four different
bifurcation angles are considered (20°, 40°, 60°, 90°) for both configurations.
A general scheme with the main control parameters for our simulations as well
as the notation used is presented in Figure
2.
Mesh:
A 3D mesh is built using Simcenter Star-CCM+ software [26]. In general, cells
of arbitrary polyhedral shape are used in most of the volume. The mesh is
refined in the vicinity of the walls using hexahedral layers in order to detect
more precisely the behavior of the fluid in these areas. To ensure that the
results do not depend on the mesh used, three grids of different grid density
and size are considered, and all the simulations were run using all the meshes
considered (Figure 3).
Maximum velocity and minimum WSS
values are the target observables studied for each mesh. The difference among
them is less than 5% in every configuration. Details of the grid analysis for
an angle α=20° and a non-symmetric bifurcation with the first configuration (D1
= D3) are presented in Table
1.
Mathematical
model and simulation settings
The mathematical model considered
for our results discretizes the incompressible Navier-Stokes equations using
the Finite-Volume Method (FVM). The flow field is governed by the continuity
and momentum Navier-Stokes equations [27]. 
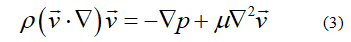
Where v
Simcenter Star-CCM+ software is used to design the geometries, build the mesh and carry out numerical simulations. Segregated flow solver (SIMPLE algorithm) [28] was used to solve the integral conservation equations of mass and momentum in a sequential manner. This solver employs a pressure-velocity coupling algorithm where the mass conservation constraint on the velocity field is fulfilled by solving a pressure-correction equation [26].


Note: Non-symmetric bifurcation (D1=D3=2mm; D2=1mm, a=20°)
Circulating blood flow is modeled
as an incompressible Newtonian fluid whose density is kept constant and equal
to 1060 kg/m3 and viscosity 0.004 Pa·s [11,29]. Vessel walls are assumed to be
rigid boundaries with no-slip condition, constant velocity of 0.2 m/s is set at
the inlet [30] and atmospheric pressure at the outlets [31,32]. A specific case
with different boundary conditions has been studied for the case of symmetric
bifurcations and its description is found in the Supplementary Information.
Reynolds numbers smaller than 400 are always considered for all the
configurations (thus laminar flow is always granted). The mesh considered is
formed by polyhedral and rectangular prisms arranged in the following way:
polyhedral prisms occupy the central part of the geometry whereas rectangular
prisms are used to create thin layers of elements that help us to accurately
capture the phenomena that occur near the wall (see Figure 3 for details). The
convergence criterion of reduction of residuals by five orders of magnitude is
used and computations are run until a steady state is reached.
Results
Effect of the
vertex topology
Previous reports analyzing the
effect of bifurcations on the circulating flow usually considered an idealized
bifurcation characterized by a sharp vertex. The actual geometry of the
bifurcation in real situations is far more complicated and, in this section, we
analyze the effect of its main topological features on blood circulation. Under
experimental conditions, the transition from the proximal main vessel to the distal
main vessel and branch vessel is smooth and may present a large variety of
configurations. In order to incorporate the most of them, two parameters are
introduced in the vertex geometry that try to emulate conditions closer to
experiments. The two parameters (introduced in Figure 1) describe the radius of
curvature of the outer wall at the bifurcation (Ro) and the radius
of curvature of the inner wall at the bifurcation (Rv). In all
simulations the inner diameters of all the vessels are kept constant and equal
(D1 = D2 = D3) and the bifurcation, for
simplicity, is considered symmetric (as in Figure 1). In the analysis of the
simulations bellow and as mentioned in the introduction, we focus on the Wall
Shear Stress (WSS) as it has been shown to be a good marker of regions with
high potentiality to present pathological plaque deposition [9,10].
In Figure 4, a summary of the
different configurations is presented. Figs. 4a to 4c show different
configurations varying the inner vertex curvature (Rv). The values
of the WSS are color coded in the same figures. It is clearly observed that
increasing Rv results in a larger area of low values of WSS and larger vascular
risk. The areas where WSS is lower than 1Pa are measured for each experiment
and the values are plotted versus Rv in Figure 4d. This curve
clearly shows the important role played by the inner radius of curvature on the
extension of the risky areas. The effect of the outer radius of curvature, Ro,
is shown in Figures. 4e to 4h. Figure 4e to 4g present different geometries of
the bifurcation for the different values of Ro considered. Here, also the areas
of low WSS (lower than 1 Pa) are color coded. All the values of the areas of
low WSS are plotted versus Ro in Figure 4h.
Note that the effect of the outer
radius of curvature is much less significant that Rv although it is
still possible to observe some slight increase in the areas with Ro
and, thus, some increase in the coronary risk. Equivalent simulations are done
considering a pulsatile flow and outlet pressure conditions and the results
agree with those presented above. The inlet velocity profile is extracted from
bibliography [30] and it is described in Figure
5.
Additionally, a constant pressure
of 10000 Pa is considered in the outlets in order to simulate real conditions
of artery pressure in coronary artery tree [33]. The size of the areas with WSS
less than 1Pa is studied. The analysis is performed in the systolic phase
because it is in this part of the pulse when largest recirculation zones occur
and five pulses are considered in order to stabilize the flow (Figure 6)
Figure 5: Cardiac pulse of 0.81 seconds length.

Note that the results obtained
are very similar to those presented in Figure 4. Thus, we can conclude that the
vertex Radius of Curvature (Rv) plays a significantly more important
role than Ro. The velocity of the flow in the human vessels also
varies depending on the proximity to the cardiac muscle or due to some other
circumstances. Reynolds Number (Re) is the ratio between inertial forces and
viscous forces within a fluid and it is determined by the following equation
[34]
where v is the characteristic
flow velocity, ρ the density, μ the dynamic viscosity and D is the blood vessel
diameter. This parameter is customarily used to describe the importance of the
flow in vessels. In the following simulations, we consider the effect of Re on
the possible deposition of plaque in the simulated vessels. The area of the
regions characterized by low WSS (lower than 1 Pa) is the parameter to analyze
(as in Figure 4) and we consider the variations introduced by the two radii of
curvature at the vertex as well as the Reynolds number. Six different Re are
considered (Re=106, 159, 212, 265, 318, 371). These Reynolds numbers correspond
with the following flow velocities (v=0.2, 0.3, 0.4, 0.5, 0.6 and 0.7 m/s) that
are reasonable values to be observed experimentally.
Figure
7 shows the effect of the two curvatures at the
bifurcation (Rv, Figure 5a, and Ro, Figure 5b) on the
deposition area or area with WSS smaller than 1 Pa for the different Reynolds
numbers considered. Note that as the Reynolds number is increased, the areas
where deposition could happen (Adepos characterized by WSS < 1
Pa) decrease independently of the value of Rv or Ro. The
additional kinetic energy of the fluid is used to improve the transport along
the vessels. It is also observed that the influence of the curvature in the
inner part of the bifurcation (Rv in Figure 7a) is stronger than Ro (Figure 7b) in good agreement with the results in figure 4. As the
Reynolds number is decreased, the effect of Rv becomes more
important and the areas with low WSS become more extended.
Figure
8 shows a comparison of the effect of the two
curvature radii considering three different Reynolds numbers. Adepos
(i.e. areas with low WSS) decreases as the Reynolds number increases in all
configurations. Furthermore, as we increase the curvature radii, it is more
evident that Rv has the predominant influence on the flow rather
than Ro. A larger radius of curvature at the inner part of the
bifurcation results in larger areas of low WSS. This effect is also modulated
by the Reynolds number. When the Reynolds number is equal to 106, areas with
WSS less than 1 Pa begin to become significantly larger starting from R=4mm. When
Re=265 this happens from R=6mm and when Re=371 it occurs from R=8mm. Thus, we
observe that the influence of the geometry on WSS distribution is affected by
the Reynolds number and therefore by the flow velocity. Note that the Reynolds
number can also be affected by changing the physical properties of the fluid
such as density or viscosity, via medication.


Figure8: Variation of the deposition area (Adepos)with the two curvature radii at the bifurcation (Rv and Ro)for thr Re=371.
Non-symmetric geometry with D1=D3

In most of the coronary
bifurcations the symmetric approximation considered in the previous section is
not maintained. A non-symmetrical configuration is often seen, and the effect
is the topic to analyze in the following. A vessel bifurcation as described in
Figure 2 is considered with the diameter of the proximal main vessel (D1)
equal to the distal main vessel diameter (D3). Thus, the two
parameters to analyze are the diameter of the side branch (D2) and
the angle of this vessel with the direction of the main vessel (a). Several
simulations are done changing the values of the side vessel diameter (D2=
0.5, 1.0, 1.5 and 2 mm) and the angle (α = 20°, 40°, 60° and 90°). Note that in
the main vessel, low WSS values occur right after the bifurcation at the outer
wall while in the side branch, low WSS occurs in the outer wall immediately
after the vertex bifurcation (see Figure 2 for locations).
The results are summarized in Figure 9. Figure 9a presents the
minimum WSS plotted for each pair of D2 and α for the main vessel
after the bifurcation as recorded at the outer wall. This segment distal to the
bifurcation point is one of the areas prone to plaque formation as can be
observed in Figure 2. Note that, in general, as the angle or D2
become larger, the minimum WSS decreases. This effect is more dramatic for the
case with D2=1.5 mm or larger, here increasing the angle produces
values of the minimum of WSS below the values considered safe for plaque
formation. The minimum WSS measured at the side branch are plotted in Figure 9b
for the same cases considered in Figure 9a. The minimum WSS reaches a maximum
for α = 20° independently on D2 and then drops, reaching a minimum
value between α = 60° and α=90°. Note that all the values are below the threshold
value (1 Pa) so the outer wall of the side branch in all cases simulated
fulfills the conditions to accumulate plaque.
Non-symmetric
geometry following Finet’s Law
This configuration becomes a step
closer to a realistic situation where the distal main vessel reduces its
diameter comparing with the proximal main vessel diameter as it happens in
realistic configurations. Here, the diameter of the vessels is not conserved
but it rather follows the Finet’s law (Equation 3). The control parameters
considered in these simulations are the inner diameter of the side branch (D2)
that also defines the diameter of the distal main vessel (D3), and
the angle at the bifurcation (α). The results are summarized in Figure 10. Figure 10a shows the variation of the minimum WSS on the outer wall
of the distal main vessel and Figure 10b
the corresponding values of the side branch. Note that the value of D2=0.5
mm is not plotted as corresponds with a non-realistic configuration with a
value of D3 larger than D1. The behavior of the WSS in
this second configuration is very similar to that observed in the first one
(where proximal vessel radius and distal vessel radius were equal to 2mm in
Figure 9). Geometries with a larger side branch radius present more risk to
plaque formation in the mother vessel (Figure 10a). This effect is more
significant when analyzing the side branch (Figure 10b). Note that now we also
observe a minimum in the minimum WSS that is reached at α = [60°, 90°] for all
configurations. Nevertheless, the absolute values are significantly larger than
in the previous case in Figure 9 mostly due to the reduction in the main distal
vessel diameter (D2).

Non-symmetric
geometry Effect of the vertex topology
As with symmetrical bifurcations, it is important to know the influence of vertex shape of the non-symmetric bifurcations on the flow distribution and the location of those areas with low WSS. Thus, a study similar to those shown in Figure 4 is performed considering a bifurcation with an opening angle of 60º and the same diameter for all segments of the vessel (Figure 11). In Figure 11d and Figure 11h can be observed how the influence of the radius on the vertex on the size of the areas prone to plaque formation is much larger that the influence of the outer radius. Results are in good agreement with those obtained in section 3.1.
Discussion
Bifurcations are ubiquitous in
the arterial circulatory system as they play a crucial role in hemodynamics.
Understanding their role on the fluid circulation is of crucial interest as
they also play a negative role in the circulation as they might help in the
deposition of spurious substances and conform the plaque and, eventually, help
in developing diseases such as atherosclerosis. The specific geometry of the
bifurcations has been demonstrated to strongly influence the formation of
plaque. Along this manuscript we present results of numerical

simulations analyzing in detail
different geometries of idealized vessels bifurcations. Two main aspects are
the focus of this manuscript. First part is devoted to the effect of the
topology of the vertex at the bifurcation on the flow circulation. Secondly, the
analysis of the more-realistic non-symmetric bifurcations and the different
parameters describing them.
The first part of the research
identifies the important role played by the topology of the vertex itself. Any
bifurcation is characterized by the curvature of the walls between the two
daughter vessels after the branching (vertex radius of curvature, Rv)
and the curvature between the mother vessel and any of the daughter vessels
(outer radius of curvature, Ro). Our simulations clearly identify Rv
as a critical parameter that can significantly increase the area of plaque
deposition and, thus, the risk of coronary diseases. These results are in good
agreement with those published by Perktold, et al., (1990) [35]. In this paper,
authors analyzed T-shaped bifurcations (that could be considered as one of our
limiting cases) and obtain that, in addition to the bifurcation angle, the
sharpness/smoothness of the artery vertex significantly influence the local
shear stress. In general, sharped vertex lead to lower WSS. The effect of the
flow characteristics, mainly determined by the Reynolds number, is also
analyzed observing that large values of Re reduce the plaque deposition areas
and, thus, coronary risks. This effect is found to be of major importance as it
is one of the experimental parameters that physicians have to control
hemodynamics.
The vessel flow is more unlikely
to be modified without altering the normal heart functioning, but several drugs
are commonly used to modify the effective viscosity (or even the density) of
the circulating blood. Thus, understanding their influence on the coronary risk
becomes crucial. In general, we observe that larger values of the Reynolds
number reduce coronary risks at the bifurcations, and this can be achieved by
significantly reducing the fluid viscosity without altering the heart rate.
Considering different geometries of the bifurcations and different diameters
for all the vessels involved, we are able to determine the critical parameters
that produce the larger areas prone to produce plaque deposition.
This analysis was done for
symmetric and non-symmetric bifurcations and our model allows to access to
conditions and details that no experiment may reach. It is important to note
that the use of mathematical models is becoming more popular as it allows to
investigate a complete set of conditions with a detail in the resolution and
the number of observables that it is not accessible via traditional in vivo
experiments. This makes this type of research of great value for the scientific
community as it provides with valuable information that it is not accessible
otherwise and it is susceptible to be used in designing in-vivo experiments.
Conclusion
The geometry of the coronary
artery bifurcations plays a key role in the behavior of blood flow and in the
location and size of areas prone to plaque formation. Thus, the vertex shape
appears as the factor with a great influence in the distribution of areas with
low WSS.
Acknowledgments
We gratefully acknowledge financial support by the Spanish Ministerio de Economía y Competitividad and European Regional Development Fund under contract RTI2018-097063-BI00 AEI/FEDER, UE, and by Xunta de Galicia under Research Grant No. 2021-PG036-1. Authors are part of the CITMAga Strategic Partnership (AGRUP2015/02). All these programs are cofunded by FEDER (UE).
References
1. Ku
DN, Giddens DP, Zarins CK and Glagov S. Pulsatile flow and atherosclerosis in
the human carotid bifurcation. Positive correlation between plaque location and
low oscillating shear stress (1985) Arteriosclerosis: An Official J American
Heart Association Inc 5: 293-302. https://doi.org/10.1161/01.ATV.5.3.293
2. Langille
Bl and O'Donnell F. Reductions in arterial diameter produced by chronic
decreases in blood flow are endothelium dependent (1986) Sci 231: 405-407. https://doi.org/10.1126/science.3941904
3.
LaBarbera,
M. Principles of design of fluid transport systems in zoology (1990) Sci 249:
992-1000.
https://doi.org/10.1126/science.2396104
4.
Malek
AM, Alper SL and Izumo S. Hemodynamic shear stress and its role in
atherosclerosis (1999) Jama 282: 2035-2042.
https://doi.org/10.1001/jama.282.21.2035
5. Asakura
T and Karino T. Flow patterns and spatial distribution of atherosclerotic lesions
in human coronary arteries (1990) Circulation research 66: 1045-1066. https://doi.org/10.1161/01.res.66.4.1045
6. Tropea
BI, Glagov S and Zarins CK. Hemodynamics and atherosclerosis (1997) The Basic
Science of Vascular Disease.
7. Ungvári
T, Sánta J, Béres Z, Tar B, Sánta P, et al., Evaluation of the spatial changes
of the coronary morphology due to stent implantation with three-dimensional
angiography (2009) In 2009 36th Annual Computers in Cardiology Conference
(CinC) 649-651 IEEE.
8. Eom
H.J, Yang DH, Kim YH, Roh JH, Kweon J, et al., Coronary bifurcation stent
morphology in dual-source CT: validation with micro-CT (2016) Int J cardiovas
imaging 32: 1659-1665. https://doi.org/10.1007/s10554-016-0953-6
9. Okano
M. and Yoshida Y. Junction complexes of endothelial cells in
atherosclerosis-prone and atherosclerosis-resistant regions on flow dividers of
brachiocephalic bifurcations in the rabbit aorta (1994) Biorheology 31: 155-161.
https://doi.org/10.3233/bir-1994-31203
10. Shaaban AM and
Duerinckx AJ. Wall shear stress and early atherosclerosis: a review (2000) Americ
J Roentgenology 174: 1657-1665. https://doi.org/10.2214/ajr.174.6.1741657
11. Otero-Cacho A,
Aymerich M, Flores-Arias MT, Abal M, Álvarez E, et al., Determination of
hemodynamic risk for vascular disease in planar artery bifurcations (2018)
Scientific reports 8: 1-7. https://doi.org/10.1038/s41598-018-21126-1
12. Bonert M, Leask RL,
Butany J, Ethier CR, Myers JG. The relationship between wall shear stress
distributions and intimal thickening in the human abdominal aorta (2003)
Biomedical engineering online 2: 18. https://doi.org/10.1186/1475-925x-2-18
13. Bajraktari A,
Bytyçi I and Henein MY. The Relationship between Coronary Artery Wall Shear
Strain and Plaque Morphology: A Systematic Review and Meta-Analysis (2020)
Diagnostics 10: 91. .https://doi.org/10.3390/diagnostics10020091
14. Mongrain R. and
Rodés-Cabau J. Role of shear stress in atherosclerosis and restenosis after
coronary stent implantation (2006) Revista espanola de cardiologia 59: 1-4. https://doi.org/10.1016/S1885-5857(06)60040-6
15. Morbiducci U, Kok
AM, Kwak BR, Stone PH, Steinman DA, et al., Atherosclerosis at arterial
bifurcations: evidence for the role of haemodynamics and geometry (2016) Thromb
Haemost 115: 484-492. https://doi.org/10.1160/th15-07-0597
16. Pinho N, Sousa LC,
Castro CF, António CC, Carvalho M, et al., The Impact of the Right Coronary
Artery Geometric Parameters on Hemodynamic Performance (2019) Cardiovas eng
tech 10: 257-270. https://doi.org/10.1007/s13239-019-00403-8
17. Gallo D, Steinman
DA, Bijari PB and Morbiducci U. Helical flow in carotid bifurcation as
surrogate marker of exposure to disturbed shear (2012) J biomech 45: 2398-2404. https://doi.org/10.1016/j.jbiomech.2012.07.007
18. Frattolin J,
Zarandi MM, Pagiatakis C, Bertrand OF and Mongrain R. Numerical study of
stenotic side branch hemodynamics in true bifurcation lesions (2015) Comp Bio
Med 57: 130-138. https://doi.org/10.1016/j.compbiomed.2014.11.014
19. Chiastra C, Gallo
D, Tasso P, Iannaccone F, Migliavacca F, et al., Healthy and diseased coronary
bifurcation geometries influence nearwall and intravascular flow: a
computational exploration of the hemodynamic risk (2017) J biomech 58: 79-88. https://doi.org/10.1016/j.jbiomech.2017.04.016
20. Beier S, Ormiston
J, Webster M., Cater J, Norris S, et al., Impact of bifurcation angle and other
anatomical characteristics on blood flow–A computational study of non-stented
and stented coronary arteries (2016) J biomech 49: 1570-1582.
https://doi.org/10.1016/j.jbiomech.2016.03.038
21. Malvè M, García
A, Ohayon J and Martínez MA. Unsteady blood flow and mass transfer of a human
left coronary artery bifurcation: FSI vs. CFD (2012) Int communications in heat
and mass transfer 39: 745-751. https://doi.org/10.1016/j.icheatmasstransfer.2012.04.009
22. Finet G, Gilard
M, Perrenot B, Rioufol G, Motreff P, et al., Fractal geometry of arterial
coronary bifurcations: a quantitative coronary angiography and intravascular
ultrasound analysis. EuroIntervention (2018) journal of EuroPCR in
collaboration with the Working Group on Interventional Cardiology of the
European Society of Cardiology 3: 490- 498. https://doi.org/10.4244/eijv3i4a87
23. Rigatelli G, Zuin
M, Ronco F, Caprioglio F, Cavazzini D, et al., Usefulness of the Finet law to
guide stent size selection in ostial left main stenting: Comparison with standard
angiographic estimation (2018) Cardio Revas Med 19: 751-754.
https://doi.org/10.1016/j.carrev.2018.04.005
24. Gwon HC.
Understanding the coronary bifurcation stenting (2018) Korean Circulation J 48:
481-491.
https://doi.org/10.4070/kcj.2018.0088
25. Hoye A. The
proximal optimisation technique for intervention of coronary bifurcations
(2017) Int Cardio Review 12: 110. https://doi.org/10.15420/icr.2017:11:2
26. https://thesteveportal.plm.automation.siemens.com
27. Ferziger JH,
Peric M and Robert L. Street (2018) Computational Methods for Fluid Dynamics,
Cham: Springer, 16: 37.
28. Patankar SV and
Spalding DB. A calculation procedure for heat, mass and momentum transfer in
three-dimensional parabolic flows (1983) Numerical prediction of flow, heat
transfer, turbulence and combustion, 54-73. https://doi.org/10.1016/b978-0-08-030937-8.50013-1
29. Kim HJ,
Vignon-Clementel IE, Figueroa CA, LaDisa JF, Jansen KE, et al., On coupling a
lumped parameter heart model and a threedimensional finite element aorta model
(2009) Annals biomed eng 37: 2153-2169. https://doi.org/10.1007/s10439-009-9760-8
30. Chodzyński KJ,
Boudjeltia KZ, Lalmand J, Aminian A, Vanhamme L, et al., An in vitro test bench
reproducing coronary blood flow signals (2015) Biomed engineer online 14: 77. https://doi.org/10.1186/s12938-015-0065-x
31. Decorato I,
Kharboutly Z, Vassallo T, Penrose J, Legallais C, et al., Numerical simulation
of the fluid structure interactions in a compliant patient‐specific
arteriovenous fistula (2014) Int j numerical methods biomed eng 30: 143-159. https://doi.org/10.1002/cnm.2595
32. Byun JS, Choi SY
and Seo T. The numerical study of the hemodynamic characteristics in the
patient-specific intracranial aneurysms before and after surgery (2016)
Computational and mathematical methods in medicine, 2016. https://doi.org/10.1155/2016/4384508
33. Sinnott M, Cleary
PW and Prakash M. An investigation of pulsatile blood flow in a bifurcation artery
using a grid-free method (2016) In Proc. Fifth International Conference on CFD
in the Process Industries 1-6.
34. Shashi E.
Transmission Pipeline Calculations and Simulations Manual (2015).
35. Perktold K and Peter R Numerical 3D-simulation of pulsatile wall shear stress in an arterial T-bifurcation model (1990) J biomed engin 12: 2-12. https://doi.org/10.1016/0141-5425(90)90107-x
*Corresponding
author
Department of Physics,
Universidade de Santiago de Compostela, Spain, Email: alberto.perez.munuzuri@usc.es
Citation
Otero-Cacho A and Muñuzuri AP. The geometry of coronary artery bifurcations and its role in plaque formation (2022) Clinical Cardiol Cardiovascular Med 4: 24-30.Keywords
Atherosclerosis, Blood flow, Bifurcation.
