Introduction
Industrial
emissions have become a global issue due to their irreversible environmental
damage. Production of polycarbonates or the so-called plastics is major source
of industrial emissions. A major concern with the use of polycarbonate is its
overwhelming increase in use. Furthermore, the accelerating environmental
consciousness of individual, companies and government entities serves as a
driver for polycarbonates or plastics makers to focus attention on the
environmental performance of their operations. Environmental consideration
should be integrated into process design, regarded as a first step on the path
to continuous environmental improvement.
The
industrial improvement can be made by performing evaluation method (PEM) based
on the environmental impact categories. The PEM is used to compare between
alternative processes performances with established standards depends on their
productivity.
The
productivity improvement by using life cycle assessment (LCA) or “Cradle to
Grave” analysis which has emerged as a powerful analytical tool for
environmental performance evaluation [Scaife and Nunn, 2002]. It is a method to
assess the environmental burdens based on energy and materials used as well as
emissions into the environment [Khan et al., 2006]. Analyzing operations
processes by performing LCA can increase the productivity anddetermine
the energy consumption and related wastes. The environmental degradation and
human health risk associated with release emissions due to for instance, energy
consumption results from operational processes and utilities was observed.
Richard el al. presented the link between environmental chemicals and adverse
effects on human health [Richard et al., 2004].In addition, Zhang has presented
a methodological comparison by using LCA and Risk Assessment to identify and
assess chemicals [Zhang et al., 2007]. The production of PC has several stages
such as Chlorination, Oxy-Chlorination, and Vinylation. Each stage/step
consumes different energy levels which result in different levels of emissions.
For instance, Chlorination stage that account for large energy consumption and
waste released. It emits chlorinated hydrocarbons which have negative effects
on the environment and human health. Using environmental evaluation tool In
order to evaluate the environmental impact is necessary. Life cycle analysis
LCA can be used as an analytical tool to convert chemical emissions into
quantitative risk and evaluate the environmental impact of a particular
technology.
LCA is a four-stage process including: (1)
Scoping, (2) Inventory Analysis, (3) Impact Assessment, and (4) Interpretation
and Improvement.
1.
Scoping: Defines the
extent of analysis and the system boundaries;
2.
Inventory
Analysis:Documents
material and energy flows which occur within the system boundaries (also called
the life cycle inventory or LCI);
3.
Impact
Assessment:
Characterizes and assesses the environmental impacts using the data obtained
from the inventory also called the life cycle impact assessment (LCIA); and
4.
Interpretation
and Improvement:
Modification and improvement to reduce the environmental burden throughout the
products life based on the results of inventory and impact stages (Figure 1).
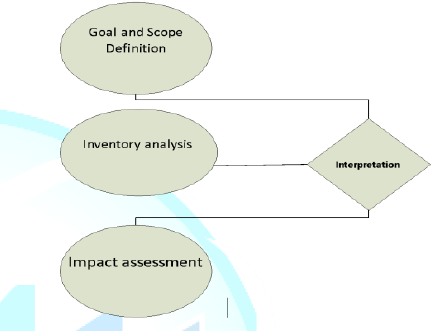
Figure 1: Methodological Framework for Life Cycle Assessment, Revised (UNEP).
This
study covers an environmental performance evaluation for the production of
polycarbonates (PC). Based on Association of the Dutch Chemical Industry
(VNCI), Netherlands, 2001, environmental performance evaluation (EPE) used to
assess environmental performance and identify areas for improvement that
enables industry to evaluate the environmental performance.
The
aim of this paper is to apply an environmental performance evaluation for PC
production methods and define the parameters that influencing or/and
stimulating the production throughout the life cycle of each stage. This helps
to find an effective way for improving the process operation and reduce the
adverse impact on both human health and environment.
The
lack of information result in the uncertainty of environmental index that limit
accuracy and credibility of the results, thus errors are expected.
Literature
Review
Emissions
results from PC production have become an issue due to the different ratio of
inputs consumed to outputs achieved. The less emissions output for a given
input, the better efficiency will be achieved [Lin X et al., 1998]. It has been
observed by Khan and sadiq that the optimization of industrial process, which
refers to find the best solution from all feasible solutions, increases the
overall environmental burden and impacts [Khan et al., 2006]. Thus, systematic
and reliable tools are necessary to assess environmentally the productivity
performance. Cave
and Edwards studied the industrial processes impact and design process
improvement [Cave et al., 1997]. They have noticed that methods are lacking for
assessing chemical process for environmentally friendly.
Khan
et al. (2004) presented a new life cycle indexing system which considered a
number of basic parameters for a complete life cycle assessment for a proposed
process. Niels et al (2007) investigated and compare environmental impacts of
production process. Xu et al. has adopted an LCA perspective to analyze and
reduce greenhouse gas (GHG) emissions in chemical industry [Xu H. and Zhan,
2007]. Tonopool et al. used LCA method to find out how to improve environmental
performance of industry. Established
guidelines for performing detailed LCAs are well documented by the
Environmental Protection Agency (EPA), Society for Environmental Toxicologists
and Chemists (SETAC), and the International Organization for Standardization
(ISO) (Fava et al. 1991; ISO 2006; Vigon et al. 1992). As defined by the ISO
14040 series.
LCAs
have typically focused on total energy usage, including energy required to
operate the production process as well as energy embodied in the production
materials [Fava et al., 1991, Environmental and Pollution Prevention Plan
Canada 1994, IPCC 2013 and Brentrup et al. 2005]. There are studies which have
examined waste generation and health-related air pollution [Khan et al., 2006],
or expanded the scope to include construction impacts [Pennington D., 1997,
Wenzel et al., 1997 and Steen et al., 1999]. Azapagic et al. have proposed a
methodology as shown in figure 1 for process design based on the life cycle
assessment.
LCAs
provide information on which stage of production (production, use, or disposal)
causes the most environmental impact and may offer suggestions to minimize
those burdens. Although various productions processes performance has been
evaluated by LCA applications, uncertainty associated with the assumptions
needs to be considered [Fredrik and Pernilla, 2013]. Shokravi et al. (2012)
Proposed environmental performance evaluation method and find the parameters
that have adverse impacts on its results. This describes the relationship
between the production process and environment in order to mitigate the
environmental impact.
In
addition, environmental performance evaluation of industrial process has
attracted researchers attentions. Lin and Polenske applied a process-level
input-output model based on reported process data to illustrate how changes in
manufacturing process can affect environmental aspects [Lin X et al., 1998].
Lainexay et al. (2007) presented environmental standards, specifically these
related to air pollution, emissions, and air quality. Xiu et al. (2008) has
studied and analyzed pollutants associated with industrial process. An
Environmental performance evaluation method for a purpose of comparison to
improve the outcomes of the productivity and modified design method for
polycarbonate production will be analyzed with the help of selected example.
Polycarbonate
Production Process
Polycarbonate
is produced by the reaction of phosgene with bisphenol A. Phosgene is produced
by reacting chlorine from the electrolysis of sodium chloride with carbon
monoxide produced by the pyrolysis of coal, oil or gas.
The
production route for bisphenol A is more complex. Natural gas is subject to
cracking to produce cumene. Finally, the phenol and acetone, as a result of
cumene production, are reacted to produce bisphenol A BPA. The BPA reacts with
DPC leading to polycarbonate. The overall process of PC described as follows,
Cumene
(Raw Material)àAcetoneàBisphenol AàPolycarbonates
(Product)
System
Boundary of Production
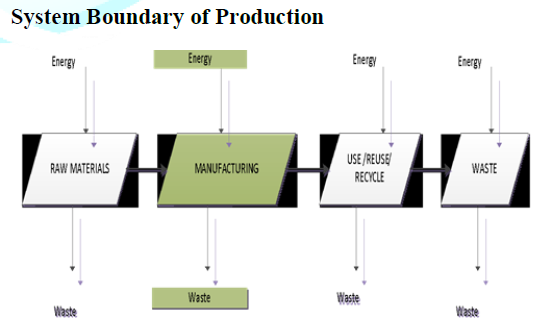
Figure 2: System Boundary.
The
system boundary shows the process of life cycle assessment for PC. There are
four stages: Raw material, Manufacturing, Use, Recycle, and Disposal (End life
of the Product). The manufacturing stage will be the focus of study. The
following figure describes it in more details.
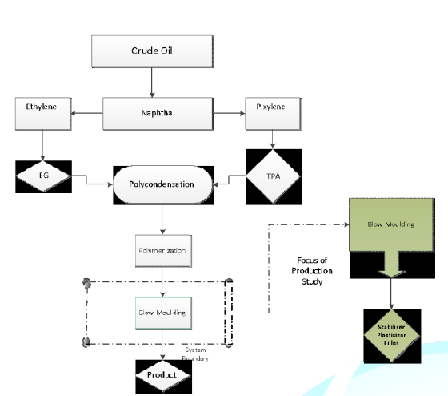
The
production process describes the production stages of PC. The focus of the PC
production is on the blow molding (bounded by dot lines) where toxic materials
are used such as stabilizers, fillers and plasticisers. The material balance
during the production stage explains the energy consumed and required material.
During manufacturing stage, crude oil is required to produce naphtha which is
leading to ethylene and p-xylene productions. These chemicals are necessary for
ethylene glycol and teraphthalic acid production during polymerization stage.
Polymerization, where is the mixture of the product as compound is made. Then a
blow molding is utilized to formulate the product and final product is packed (Figure 3).
To view Figure 3, click below
Figure 3: Production Phase of Polycarbonate.
Traditional
Process
There
is a traditional production method for polycarbonate PC
Phosgene Process:
Figure
4 shows the most common manufacturing polycarbonate processes by the reaction
of Bisphenol A BPA with Phosgene COCl2 in the interfacial polymerization.
COCl2 + BPA àPC
Process
Phases
C2H4+ Cl2 àC2H4Cl2
(EDC) (Chlorination Step) (1)
C2H4Cl2 (EDC) àC2H2HCl+HCl
(Pyrolysis Step) (2)
C2H4 (Cracking)à CH2=CHCl+HCl (Vinylation
Step) (3)
Environmental
Problems: Phosgene
was an essential for PC production. It consists of chlorine and carbon monoxide
as follows:
CO+Cl2 à
COCl2
Nowadays,
the production and use of phosgene in the factories have been very severely
restricted worldwide. The needs of bisphenol A and the complexity and danger of
the process have drawn the attention of scientists and researchers for a long
time due to the yield of undesirable by-products remained at high level of
150-200 kg/t of phenol [Xiuet al., 2008].
Electrolytic
Process Description: 1) Electrolytic Cells (Anode and Cathode), 2) Purification
Process, 3) Electrical Converter (AC to DC by silicon Rectifiers), 4)
Compressor, Boiler, and Cooler, 5) Liquefaction Process, 6) Evaporation Process.
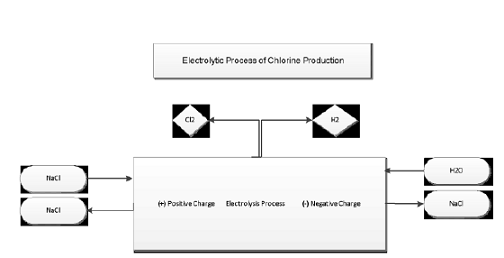
Figure 4: Phosgene Process.
Free-Phosgene
Process
The
traditional production method based on phosgene shows high risk due to highly
toxic materials associated with phosgene (COCl). However, Alternative method presented
by Fabiano described a better way for PC production by getting rid of phosgene
and producing diphenyl carbonate (DPC). Although the new method is slower than
traditional method, it presents emissions reduction. In addition Castro
mentioned that this process also economically more effective method [Castro ,
2013].
Diphenylecarbonate
(DPC)+Bisphenol A(BPA) à Polycarbonate
(PC)
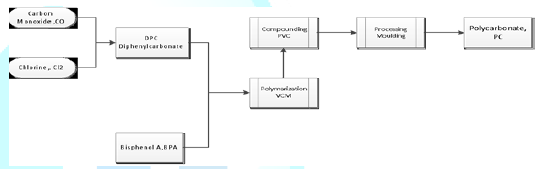
Figure 5: describes an alternative way of polycarbonate production by diphenyl carbonate DPC.
Production
Processes Drawbacks
The
phosgene process has a number of drawbacks including the toxicity of phosgene,
the use of low-boiling-point solvent, and the large quantity of waste
containing chlorinated hydrocarbons which must be treated. The use of
concentrated sodium hydroxide and hydrogen chloride creates several problems to
the processing production of polycarbonates which should be considered such as
corrosion, health problem, and environmental damage. Although non-Phosgene
process has lower cost than traditional process (phosgene route), there are
some disadvantages associated with it such as the high temperatures and high
vacuum generated by the operations. However, it is anticipated that this kind
of non-phosgene process will be widely adopted for PC production throughout the
world.
Comparison
of Production Methods
The
traditional production methods of polycarbonates PC are divided into two
routes: Phosgene and non-Phosgene routes. Comparison between the two methods
based on their impacts on the human health and environment atmosphere is
studied and presented as follows,
The
table shows the safety hazards associated with each PC production method
(phosgene route and the free phosgene routes).
In
addition, the probability of human health risk due to the Phosgene route for
polycarbonate production is higher than the phosgene-free route due to:
1. The process design describes the way of
producing the PC by two routes .Phosgene needs BPA in order to complete the
process reaction. The BPA is indirectly produces by the reaction of phenol with
acetone whereas free-phosgene route has directly producing the PC by phenol
with carbon monoxide [Castro et al.,2013].
2. The number of process stages in the
phosgene-free route is less than that in the phosgene route [Castro et al.
2013].
3. Toxicity level is significant in phosgene
route due to the harmful and corrosive materials used throughout the production
stages [Shinsuke et al.,2010] and [Castro et al. 2013].
4. Increasing the risk likelihood of illness or
death associated with phosgene route due to toxic by-products, however, with
the phosgene-free process, has less impact on human health and environment than
traditional phosgene route [Shinsuke et al. 2010].
5. Finally, the risk associated with the phosgene
method is higher than the phosgene-free method and also more costly due to the
higher energy consumption.
Although
the phosgene-free process is environmentally and economically is reliable, it
is slow.
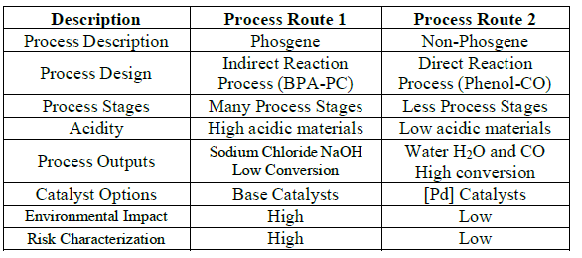
Table 1: Comparison of PC Production Methods.
Research
Methodology
The
strategy of the research based on theoretical analysis for comparison and
evaluation of environmental performance for different polycarbonate production
methods. To describe the environmental Impact developed by a particular method
or process, the Life cycle based environmental performance evaluation for
supercritical fluid application on polycarbonate production methodology will be
evaluated based on:
● Life cycle analysis
● Environmental Performance Assessment
● Environment category Indicators
To
obtain environmental information during the polycarbonate manufacturing
process, a quantitative analysis of environmental performance is highlighted.
The method presented in this paper seeks to look at the overall environmental
performance, and identify what action to be taken to make a decision. The most
common procedure, a deterministic and scenario based approach, is that specific
scenarios are chosen from the environmental risk assessment of the process
industry. It includes aspects such as type of agent, type of population, location,
etc. The resulting scenarios contain information on possible emission source,
geometry, etc. A major item in exposure scenarios is the choice of the
so-called design process operation production of polycarbonate, which will be
discussed below. These scenarios allow us to compare between designated
processes and how changes help to improve alternative method for future
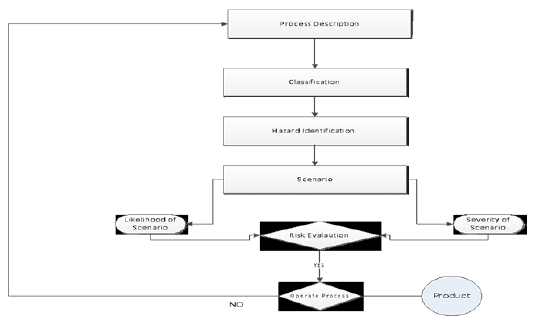
challenges. The method consists of the steps of classifying, characterizing,
and quantifying the environmental data as given in Figure 7.
To view Figure 7, click below
Figure 7: Framework for environmental performance evaluation.
The
study presents a new processing method for polycarbonate production which
environmentally friendly. It is a combination of the traditional process with
supercritical process. Consequently, a comparison based on the available data
and results will be illustrated and a decision will be made based on each
process results.
Life
Cycle Analysis
The methodology uses LCA throughout the
design process; thereby environmental consideration has been incorporated from
the Production design stage (Figure 1). The analysis of life cycle introduces
the process selection based on the optimization of environmental objective,
which includes performance and materials and apart from the economic. The
system boundary of this study has focused on the most toxic point source where
the likelihood of emissions is exceeded the tolerable level (Figure 3). The
limitation of the assessment is that the optimization of a large number of
criteria is practically very difficult and would result in a tremendous
computational load. As all criteria cannot be given higher importance,
therefore, Complexity associated with optimization may increases the complexity
without noticing improvement in the results. This study will be selecting
particular environmental indicators to evaluate each method productions of PC
on the environment. A similar approach of integrating LCA with the traditional
process design framework has been proposed by Bejan et al., 1996 and Sutherland
et al., 2007.
Environmental
Performance Assessment
Environmental
evaluation consists of process description, hazard or chemical identification,
scenario identification to measure the impact or severity and the probability
of occurrence.
The
first step of the assessment shown in figure 7 describes a process
theoretically based on environmental performance. Classifying data by properly
selected and organized into correct categories. Characterizing by model the
selected inventory data to provide better perspective than simple mass and
quantifying hazard based on the material balance to identify or measure the
hazard associated with each precursor or chemical explained in the following
sections. Finally, an integrated environmental impact is obtained by applying
life cycle analysis (LCA) in order to evaluate the performance of each
processing method. Furthermore, modified process based on the results and the
influence of method will be taken as a feedback for the changes and
improvement.
The
procedures systematically and identically help to better identifying each
pollutant. It is useful for all comparisons, including judgments of
environmental performance
Process
Description:
Any industrial process consists of chemical, physical, and mechanical steps.
The study selected and analyzed the process of PC by classification, Hazard
Identification, and Evaluation based on the impact categories as follows,
The
goal of this section is for characterizing the environmental parameters. The
general categories are: Global Warming (GW), Ozone Depletion (OD),
Acidification Potential (AP), Photochemical Oxidation (PO), and Eutrophication
(EU). At the next level the environmental parameters divided according to the
type of precursor. At the final level, the environmental performance evaluation
based on the environmental parameters stimulated by the type of precursor will
be determined by assessing the magnitude of impacts for each of the stressor in
order to convert LCA into impact categories as in table 1. Environmental
Impacts ofproduction of Polycarbonate.
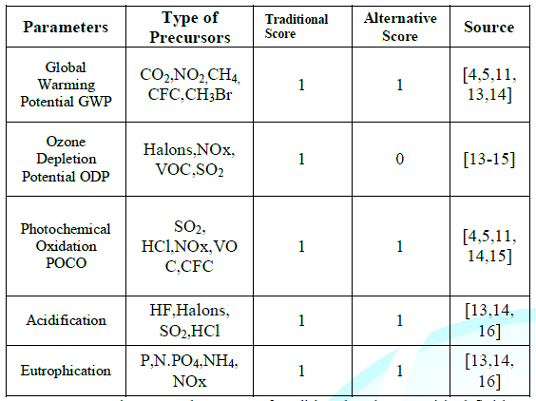
Table 2: Environmental Impacts of traditional and supercritical fluid SCF Technology for Polycarbonate.
Environmental
Indicators
Eco-indicator
99 was used in this research. It is developed under the Dutch NOH program. It
only takes account of the effects. However, the variation of some indicators
between 0 and 1 might be a source of uncertainty.
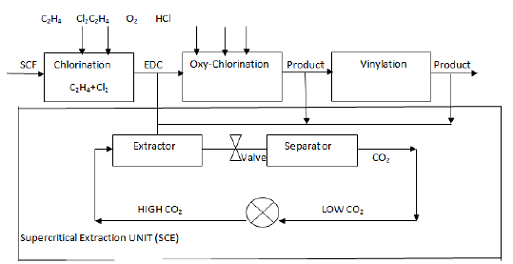
The
process of EDC and VCM production during three stages, Chlorination,
Oxy-Chlorination, and Vinylation steps is modified by supercritical fluid SCF.
C2H4 + Cl2 àC2H4Cl2
(EDC) (Chlorination Step) (1)
C2H4Cl2 (EDC) àC2H2HCl+HCl
(Pyrolysis Step) (2)
C2H4 (Cracking) àCH2=CHCl+HCl
(Vinylation Step) (3)
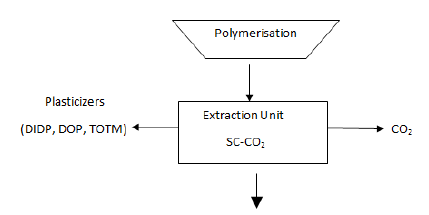
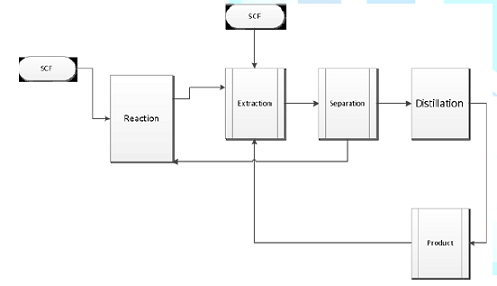
Figure 10: Extraction Stage by Supercritical Fluid.
Super critical
fluid carbon Dioxide (SC-CO2) effectively extracts residual monomer such as
DIDP, DOP, and TOTM plasticizers from polycarbonate. It is environmentally
friendly methods. Approximately 20 - 60 % of the production reduction will be
achieved by the SCF [Sapkale et al., 2010] & [Arvamudan et al.,2003].The
extent (wt %) of the plasticizer extractions per unit area of the sample
determine by dividing the extraction fraction as follows:
[((W0
– W1) (100 + X + 6.5)) /W0X] * 100%
W0
is the sample weight before extraction
W1
is the sample weight after extraction and CO2 removal
X
is the amount of plasticizer used such as (DOP, DR, DIDP, and TOTM)
The
energy consumption and emission releases were reduced by SCF compared to
phosgene and non-phosgene processes. Therefore, the probability of
environmental impact associated with the supercritical fluid is lower due to
reducing the reduction of environmental indicators impacts such as Ozone
depletion potential (ODP).
Advantages
of the Supercritical Fluid Carbon Dioxide SC-CO2 Technology
Supercritical
fluids have been used effectively for many industrial productions. It is highly
compressed gases, which combine properties of gases and liquids in an
intriguing manner.
It
can lead to reactions, which are difficult or even impossible to achieve in
conventional solvents. Supercritical fluids have solvent power similar to light
hydrocarbons for most of the solutes. However, fluorinated compounds are often
more soluble in supercritical CO2 than in hydrocarbons; this increased
solubility is important for polymerization. It increases with increasing
density (that is with increasing pressure). Rapid expansion of supercritical
solutions leads to precipitation of a finely divided solid. This is a key
feature of flow reactors.
The
fluids are commonly miscible with permanent gases (e.g. N2 or H2) and this
leads to much higher concentrations of dissolved gases than can be achieved in
conventional solvents. It can be easily recycled and chemically inert. Other
important safety features of using supercritical technology such as:
Non-flammable has good solvent characteristics for non-polar and slightly polar
solutes. It is a “natural” substance, present in mineral waters and part of the
life cycle. It is easily removed from the product. The dissolving power and
selectively can be controlled by selection of suitable pressure/temperature
combination. It has a convenient critical temperature (31.04ºC). This enables
extractions to be carried out at comparatively low temperature (often as low as
40 or 50ºC), decreasing the risk of damage of thermo-labile compounds. Most of
the volatile components, which tend to be lost in hydrodistillation, are
present in the supercritical extracts [Martinez de La Ossa et al. (1991) and
Vardag and Korner (1995)]. Partly because of this, extracts obtained in this
way tend to have flavor and taste, which are well liked by tasty panels.
Extraction of natural raw material with supercritical CO2, allows the obtaining
of extracts which flavor and taste are perfectly respected and reproducible.
The supercritical fluid ability to vaporize non-volatile components (at
moderate temperatures) reduces the r energy spent, when comparing to
distillation. Once the pressure excess in the equipment prevents oxygen entry
while extraction occurs, oxidation reactions dont happen. Also the number of
solvents possible to be used on supercritical extraction is superior of classic
organic solvents. The last but not least, supercritical fluids have a superior
selectivity although they have an inferior solvent power than classic organic
solvents.
Application
of Methodology to Supercritical Technology
The
process of EDC to VCM produced during three stages, Chlorination,
Oxy-Chlorination, and Vinylation steps. The material balance for each stage
produced various by-products or/and undesired materials through several
reactions (1), (2), and (3).
Result
and Discussion
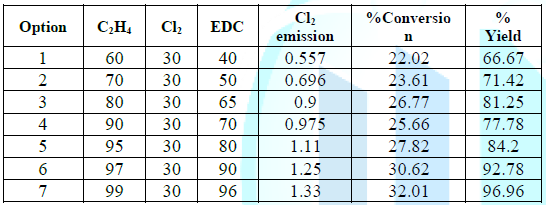
Table 3: Conversion Rate of the Chlorination Reaction.
The
Data shows that chlorine releases increased with the increase amount of
ethylene (C2H4) when Cl2 is remained unchanged, thus, the increase ratio of the
reactants (C2H4 to Cl2) is not necessarily the best optimization in terms of
high yield. Consequently, more chlorine will release. The data described
theoretically best production route options based on chlorine and ethylene
reactions. Although the yield is increased with increasing ethylene, chlorine
emission also has increased. However, option one gives the best option among
other options due to the least Cl2 emission. Environmentally, lower
the emissions, the better for human health and environment.
Figures
12 describe the fate of the reactants during the reaction conversion. It shows
the increasing rate of ethylene conversion into the production formation of
desired product. However, Figure 12 shows changes in conversion rate based on
the chlorine releases to form the desired product. The environmental evaluation
goal of emission reduction was achieved as shown in option 2.
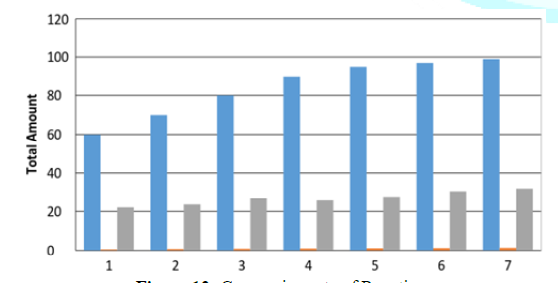
Figure 12: Conversion rate of Reaction.
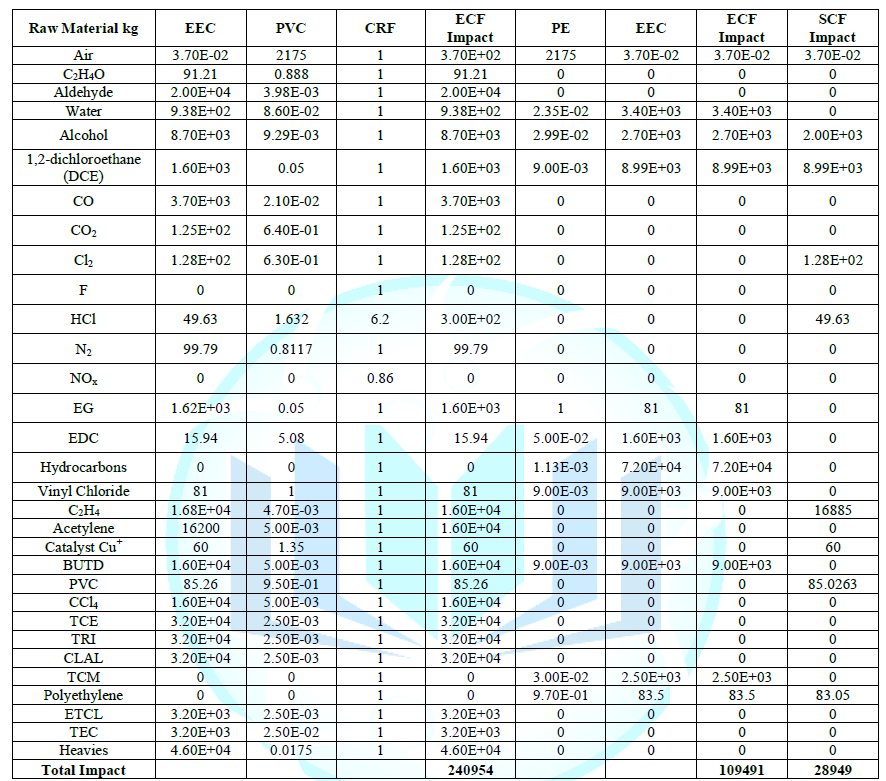
Comparison
of Processes Performance
Table
4 shows the comparison between three methods for polycarbonate production
(Chemicals Release due to polycarbonate production by PVC, PE, and SCF).The
effect of the production emissions reduction due to Polyethylene (PE) compared
with PVC has improved but modified process SCF has given higher emission
reduction by zero Ozone depletion potential without any traces. SCF due to its
cost and most importantly is environmentally benign; it is a promising
technology for future.
ECF
will be calculated based on cumulative exposure modeling (Dispersion Model) as
follows,
EEC = 0.81 * PD / tons NOxeq (1)
EEC
is in units of person * hrs * ppm O3 /tons NOx eq.
PD
is the average population density (person/km2)
CRF
represents the severity of additional risk from accumulative exposure to ozone
concentration. Then
ECF
= EEC * CRF (2)
It
means that the scale of 0 to 1 is the level of the toxic chemical where the ECF
for toxic chemical must be equal 1.
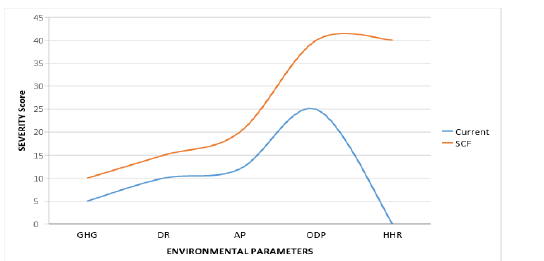
Scenarios
Uncertainty
is exists among different parameters where 1 scale means 100% which is not
applicable measurement and 0 means 0% effect. The ozone depletion potential has
been reduced to zero effect due to the higher efficiency of the SCF which is
proved that there is no any precursors been detected after using SCF. However,
Global warming shows that indicator has 1 scale but with less impact on the
environment due to the application of SCF where uncertainty of the scale of 1
is not necessarily means 100%. Although acidification and eutrophication have
been scaled by 1 but their effect measured aslow and medium
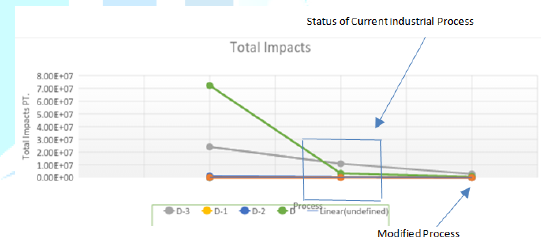
respectively. Furthermore, figures 14 described the fate of the production
processes of polycarbonate where the impact of the environmental parameters
resulted from SCF were minimal. In addition, it is shown that the reduction of
the environmental impact due to ozone depletion potential (OZP) has been
reduced by 100% therefore the impact of precursor such as CFC, Halons, NOx,
VOC, and CH3Br been shown 0 impacts. However, accumulation impacts for
chemicals resulted from traditional processes were seen at higher and medium
levels but it goes to lower potential level when supercritical technology
applied. Although indicators that measure environmental efficiency are being
developed by institutions and organizations, an indicator that can be commonly
used has not been developed yet which might be the source of errors; however,
it is necessary to develop indicators of environmental efficiency which can be
commonly use.
In this paper, traditional processing and
alternative modified methods for polycarbonate production were described and
compared in terms of environmental performance evaluation (PEP) to identifying
opportunities to improve environmental performance of polycarbonate production
processes. . The advantage of the comparison over the traditional processes
route selection is the ability to acknowledge uncertainty and the use of Environmental
Parameters (EPs) calculation. In addition, the influence of modeling analysis
and their variation were investigated In order to understand the extent of
uncertainty due to undesired products migration in polycarbonate products,
amount of toxic materials in polycarbonate (PVC) products have been investigated.
It was observed that mass balance method demonstrates the ability of
supercritical fluid to eliminate toxic chemical. Results show that higher
efficiency can be achieved by SCF. Although this approach is also inexpensive
and environmentally benign, more investigations and studies on the plasticizing
stage, where toxic chemicals released, are recommended. Furthermore, accurate
and precise environmental parameters (PEs) are important since the use of
indicators is extremely limited, and they need to be further developed
otherwise industrial development will continue creating costs in the form of
risks of the environment and public health, unless urgent action is taken.
3.
Lianexay
B and Smith G. Environmental impact assessment of Thia Iron and steel Factory
(2007) Hanoi, Vietnam.
4.
Xiu
CH, Li HQ and Zhang Y. Integrated Assessment on Pollution Contribution in Iron
and Steel Manufacturing Process (2008) 21: 207.
5.
Fiasal
K and Rehan Sadiq. An integrated approach for risk‐based life cycle assessment
and multi‐criteria decision‐making: Selection, design and evaluation of cleaner
and greener processes (2006) Business Process Management J 12: 770-792. https://doi.org/10.1108/14637150610710927
6.
Shokravi
S and Smith A. Industrial environmental performance evaluation: A Markov-based
model considering data uncertainty (2012) Environmental Modelling Software 60: 1-17. https://doi.org/10.1016/j.envsoft.2014.05.024
7.
Tonogpool
R. Analysis of Steel Production (2010)
8.
Scaife
P, Nunn J. LCA Perspective Institute of Japan 42: 5.
9.
Xu
H, Zhang. Research of LCA Application (2007) 10: 33.
10.
Sutherland
J and Haapala K. Optimization of steel production to improve life cycle
environmental performance (2007) CIRP Annals 56: 1-5. https://doi.org/10.1016/j.cirp.2007.05.003
11.
Richard
M, Sharp D and Stewart Irvine. How strong is the evidence of a link between
environmental chemicals and adverse effects on human reproductive health (2004)
328.
13.
Canadian
Oxy. Nanaimo Chlor-Alkali And Sodium Chlorate Plants (2009) Canada Industrial
Chemical Division.
14.
Brentrup
F, Kusters J, Lammela J, Barraclough P, Kuhlmann H. Environmental impact
assessment of agricultural production systems using the life cycle assessment
(LCA) methodology (2004) European Journal of Agronomy 20: 265-279. https://doi.org/10.1016/S1161-0301(03)00024-8
15.
Environmental
Canada (1994) Pollution Prevention Plan: DOE FRAP.
16.
Environmental
Performance Indicators for the chemical Industry (2001) Association of the
Dutch Chemical Industry (VNCI), Netherlands.
17.
Fava
J Denison R, Jones B, Curran M, Vigon B, Seike S, et al. A technical Framework
for Life Cycle Assessment (1991) SETAC and SETAC Foundation for Environmental
Education, Washinton, USA.
18.
Intergovernmental
Panel on Climate Change, IPCC, Climate Change 2001.
19.
Environmental
Management-ISO-14041 (1998) Life Cycle assessment- Goal and Scope definition
and Life Cycle Inventory Analysis.
20.
Khan
F, Sadiq R and Veitch B. Life Cycle Index (Linx): a new indexing procedure for
process and product design and decision-making (2004) J Cleaner Production 12: 57-77. https://doi.org/10.1016/S0959-6526(02)00194-4
21.
Pennington
D. “A pollution Prevention tool for Continuous Chemical Process, Hong Kong
University of Science and technology, Hong Kong 1997.
22.
Steen
B. A systematic approach to Environmental Strategies in Product development
(EPS), Version 2000-General System Characteristics (1999) Chalmers University
of Technology.
23.
Wenzel
H, Hauschild M, Alting L. Environmental assessment of Product” 1: 0412808005.
24.
Wolnik
C and Fischer P. Advancing Pollution Prevention and Cleaner Production” Canadas
contribution (1997) J Cleaner Production 14: 539-541.
25.
Harry
B. Eco Indicator-99 Manual of Design: A damage oriented Method for Life Cycle
Assessment (2000) Technical report.
26.
Sapkale
GN, Patil SM, Surwase US and Bhatbhage PK. Supercritical Fluid Extraction
(2010) Patil Collage of Pharmacy, India.
27.
Penning,
J. M. McHugh, M. A., Radosz, M. and Krukonis, V. “Supercritical Fluid
Technology”, United States, 1985.
28.
Aravamudan
S, Chien M and Hollie K. Supercritical Carbon Dioxide (2003) ACS, Division of
Industrial and Engineering Chemistry, American Chemical Society.
29.
Martinez
de La Ossa, et al. Advantages and Disadvantages of Extraction with Supercritical
CO2 (1991).
30.
Linda
M and Mikael L. Environmental performance of biogas produced from industrial
residues including competition with animal feed-life-cycle calculations
according to different methodologies and standards (2013) J Cleaning Production
53: 214-223. https://doi.org/10.1016/j.jclepro.2013.04.005
31.
De
Melo M, Silvestre A and Silva C. Supercritical fluid extraction of vegetable
matrices: Applications, trends and future perspectives of a convincing green
technology (2014) J Supercritical Fluid 92: 115-176. https://doi.org/10.1016/j.supflu.2014.04.007
33.
Castro,
Jablansky, Lee and MacMillan. New Phosgene-Free Route To Polycarbonate (2013)
University
of Pennsylvania Scholarly Commons, Senior Design Reports (CBE) 54.
34.
Fredrik
Guldbrandsson and Pernilla Bergmark. Opportunities and Limitations of Using
Life Cycle Assessment Methodology in the ICT Sector (2013) Sweden.
35.
Shinsuke
F, Isaburo F, Masahiro T, Kazuhiro O,Hiroshi H, et al. A Novel Non-Phosgene
Process for Polycarbonate Production from CO2: Green and Sustainable Chemistry
in Practice (2010) Catal
Surv Asia 14: 146. https://doi.org/10.1007/s10563-010-9093-5


