Introduction
Recently
Barnum and Bailey Circus closed their business after more than 145 years of
entertaining many thousands of people (Solis, 2017). While this is a loss, they
were very fortunate. The life-cycle of businesses today is usually much shorter
than this. The Boston Consulting Group warns about a tremendous increase in
failure among publicly listed companies in the U.S. which now stands at 32
percent (BCG Perspectives, 2015). Furthermore, UNCTAD (2015) reported a 16
percent reduction in Foreign Direct Investment (FDI) flows because of
geopolitical concerns, policy uncertainties and governance issues. Operating
across borders magnifies the complexity of risk management (Cuervo-Cazurra et
al, 2018).
How
can firms strategically mitigate risk vulnerabilities across global supply
chains? This article aims to show a method based on a case study that was
successful in risk mitigation. The strategy was structured and expedient
leading to brand dominance in a field where high value assets were handled.
While many firms flounder with achieving a high level of vulnerability
mitigation, the success of the program was a significant competitors advantage
in this case.
This
article is based on a facility-based global supply chain case study that can be
considered as informational to other locations. Some limitations on
generalizability exist as all locations are not the same, however, the general
structure can be applied in a multi-site organization. Even though many
facilities are unique, the tools presented are transferrable and with minor
modifications could be practically used. While some leaders in facilities are
taking significant measures to protect their employees, many others believe
that the risks they could incur are tolerable. Some of this risk comes from threat
sources, while other sources are risks associated with a lack of compliance
with policy. To understand this better, leaders must understand what the
threats are, how well they are being mitigated, and
have
an interest to mitigate the residual risk that exists. The residual risk is the
type and magnitude of the threat that has not yet been addressed by the
controls that have already been introduced. This risk continues to be carried
by the leadership of the facility and should be known to them. It may be
referred to as risk appetite.
This
article is broken into five main sections after the introduction. First, a
literature review explores single site vulnerability, the de-escalation of
threat vectors, and an introduction to the risk register. The discussion of
threat vectors relates to individual facilities. The de-escalation of these
vectors will require tools to be deployed and validated as effective prior to
scaling vulnerability mitigation capabilities across many facilities. The
impact and likelihood of harm must be understood to drive decision making. The
methods for the study are covered and then the findings are discussed. The
findings will show that an engaged leader must have mechanisms in place that
enable the discovery of threats before vulnerabilities are exploited. The
insight gleaned from the tools presented in this article can be used to create
transparency in the environment on an ongoing basis. A tool is discussed that
ultimately will enable the visualization of the threatscape in its current form
and then with the augmented controls enacted. Finally, the conclusion
summarizes the study and the implications and limitations of the study follow
to conclude the article. Now, some comments on risk to introduce the concept
and its applicability to this study.
A
few comments on risk management are needed to set the stage for the case. Risk
is both visible and invisible. The management of risk is different if it is
visible as opposed to being invisible. Risk is seen by the author as the
opportunity for harm. In some cases the opportunity is exploited resulting in
the harm of a firms reputation, physical harm, financial harm, brand reputation
harm, and any damage to the company that would dissuade any stakeholder from
supporting and engaging willfully in the success of the company.
Invisible
risk and emerging risks are unknown; however, they need to be discovered before
they can be mitigated. Uncertainty is invisible but inevitable; however,
discovery is always possible, even more so with a structured approach that is
capable. Uncertainty must be governed with effectiveness to mitigate
vulnerabilities that continually emerge. This governance is not always perfect
and there are false alarms because risk analysts are often proven to be wrong
just as there are exploited risks that occur that could not have been
mitigated. In fact, risk analysts often fail to predict or mitigate significant
disasters. Even so, those who are in harms way need protection and resilience
against any vulnerability that can cause damage. While many companies execute
financial audits and have quality assurance programs, many do not have mature
risk mitigation assurance efforts. Some firms are required to come under the
scrutiny of industry groups and must submit to audits that uncover
vulnerability and challenge business continuity.
Even
so, there is variability in auditing effectiveness. Auditees learn how to
answer questions and may even lie or mislead auditors to skirt possible
penalties or additional costs for controls.
Audits may be internal or external and may produce different assessment
results within the same audit scope.
Reputation
protection can be a proactive or reactive activity and may include not failing
an audit that would be made known to clients or the industry. In either case,
the mitigation strategy is different. In the latter, in a reactive context, the
harm has already happened and containment, then recovery, is the objective. In
the former, the proactive context, the harm is pending and efforts are expended
to keep vulnerabilities from existing or being exploited. Both require
resources. Failure to address both scenarios will impact competitiveness,
reputation, and the ability to enter markets (Müllner, 2016). A critical
question to leadership is, Are the known vulnerabilities in the corporations
portfolio of concerns? and At what level of priority are they? Ultimately, the
worst case scenario is possible where vulnerabilities are linked and a small
trigger births a catastrophe. Some refer to this as the alignment of the
planets event. An effective risk management strategy will mitigate
vulnerabilities so that they are not exploited.
As
illustrated below, the ability to mitigate vulnerabilities comes from internal
and external sources. Both should be executed with transparency and be welcomed
by auditees. The endogenous cycle of influence comes from external sources that
interact with the entity. These sources can be auditors, law enforcement,
industry groups, etc. Additionally, vulnerability mitigation influences should
come from internal sources. Many entities only rely on external sources and
avoid allocating effort to internal sources of influence. These internal
influences can include culture, work environment, discovery through
assessments, and leadership inquiry. A mature entity from a vulnerability
mitigation perspective would be one where leadership, internal and external
assessment are all capable of discovering and mitigating vulnerabilities (Figure 1).
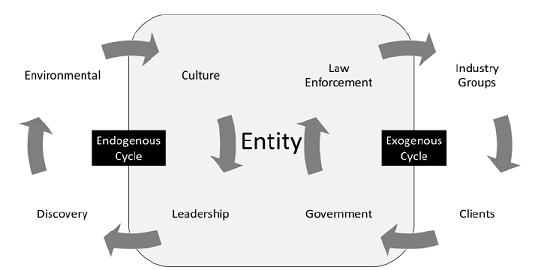
Figure 1: The endogenous and exogenous cycle of influence on an entity.
The goal of assessment is
discovery and vulnerability mitigation that leads to a more mature posture. The
entity can be a facility, a department, a cell, or any unit of manageable size.
How can the maturity of a single entity influence a global supply chain? The
answer is one entity at a time. While every entity in the supply chain is
different, similarities exist and the structure may be duplicated. With this in
mind, the first location can be strategically chosen and achieve the highest
level of maturity. Specifically, the original site (S0) can migrate from
maturity level 1 to a higher level over time. This entity can then influence a
sequenced list of entities (S1 or site 1 to S6 or site 6) in order of their priority
in relation to change capacity (and data classification, if applicable). Each
entity may not need to achieve the same level of maturity. This depends on the
service lines and products allocated to those facilities. This allocation of
work should be known before any transformation begins. In some cases, the
vulnerabilities are acceptable and in other cases they dont exist due to
physical uniqueness. In the case where maturity levels need to be achieved, the
goal would be for the site to migrate towards the goal by leveraging what has
already been accomplished at the original site. Specifically, as is illustrated
in Figure 2 below, site 2 (S2)
strives to achieve a maturity level 3 as part of the overall plan. Site 4 (S4)
does not have this requirement because the data classification or the
vulnerability in the workflows does not have the same level of vulnerability as
are present in S2. If this information is known each site can plan to mature in
parallel based on the requirements. To assure that the appropriate maturity
levels are achieved quickly, should a change happen regarding vulnerabilities
in a site, the site in question can obtain and implement the controls already
present in S0 as illustrated. In an efficient way, then, the controls validates
are relevant and effective in one site (S0) are transferred to all sites (S1 to
S6) in the supply chain as required by customers expectations and by internal
risk assessment and risk appetite.
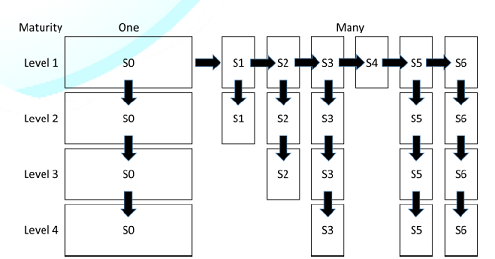
Figure 2: The scaling of maturity in a global supply chain from Site 0 (S0) to Site 6 (S6).
Literature Review
Achieving a high level of maturity at S0
Even though high loss events are
infrequent, threats should be known and captured on a Risk Register (Baker,
Anderson, Bishop, MacLeod, Parkinson, & Tuffen, 2014, Patterson &
Neailey, 2002). The Risk Register must identify which vulnerabilities have been
mitigated/minimized, list which vulnerabilities remain, and be periodically
updated. The Risk Register contents should be known by leadership who engage in
assessment or Environmental Scanning (ES) activities. Leaders may enact
mitigations based on priorities and resources. When mitigations are omitted,
leaders must also agree to live with the vulnerabilities that have not
experienced any mitigating action.
The amount of time between
assessment activities should increase when there is environmental uncertainty;
however, scanning frequency decreases when uncertainty is overwhelming, when
absorptive capacity is exceeded (Choudhury & Sampler, 1997, Cohen &
Levinthal, 1990), or when useful information is not accessible (Hough &
White, 2004, May, Stewart, & Sweo, 2000). If frequency is too high, it just
adds to the chaos. Why? Because it does not produce meaningful results.
Concurrently, a perception of diminishing returns from scanning efforts in a
stable environment may lull an organization into catatonic complacency (Hough
& White, 2004) or entropy (DAveni, Dagnino, & Smith, 2010, De Pree,
2004) while risk threats accumulate unnoticed.
Informal, or ad hoc, scanning by
leadership teams is typically short term, infrequent, fragmented, and may be
initiated by a crisis (Aguilar, 1967, Hambrick, 1979; Hambrick, 1981; Kefalas
& Schoderbek, 1973). Even though
leaders typically conduct scanning more frequently (Hambrick, 1981), strategy
making may be linked to subjective interpretations in difficult to comprehend
and rapidly changing environments (Elenkov, 1997, Hambrick, 1981, Jogarantnam
& Wong, 2009). A proactive stance may be further inhibited when leaders
assume that team leaders are performing scanning when in fact they are not
(Hambrick, 1981).
Scanning accuracy is dependent on
the threat domains selected and the approach taken (Hrebiniak & Joyce,
1985). For example, a worker might abide by clear-cut policies, while leaders
without clear role definitions or explicit bounds might have a more ambiguous
linkage to threat domains (Hambrick, 1981). Perception accuracy is a basis for
managerial action (Tsai, MacMillan & Low, 1991) and scanning is the first
step in the development of perceptions (Carpenter & Frederickson, 2001;
Davis & Meyer, 1998). Consequently, vulnerability assessment voids are
particularly risky (Hambrick, 1981) jeopardizing needed control implementation.
It is clear that continuous scanning must include structured data collection
using optimized frameworks that clarify perceptions, tasks, and reveal actual
results from actions taken (Bourgeois, 1985).
Two general measures of scanning
strategy are frequency and scope (Beal, 2000, Yasai-Ardekani & Nystrom,
1996). The range of characteristics of an expected environment helps leaders
make decisions today that align them with a desired future, at a suitable pace.
In high risk organizations, scanning frequency, scanning intensity, and
scanning type (Jennings & Lumpkin, 1992) matches, or exceeds, the
environmental change rate (Choudhury & Sampler, 1997) so that desired
future states can be realized in time (Hough & White, 2004, Sawyerr). A
lack of predictability, environmental fluidity, and complexity drive scanning
strategies (Czarniawska, 2007, Duncan, 1972, Dutton & Jackson, 1987,
Ebrahimi, 2000, Thompson, 1967).
Leaders in complex and risk-laden
environments are especially challenged to comprehend threats (Anderson &
Tushman, 2001, Fahey & Narayanan, 1986, Goll & Rasheed, 1997, Snyder,
1981). Organizations perceive their environments differently. This perception
depends, at least partially, on their strategic approach, and if data
collection is involved (Zahra, 1987). Furthermore, organizational intelligence
influences strategic decision making. Data completeness and analyzability
influences sense-making (Sutcliffe, 1994). Proactively, data structures must
assist with processing needed to develop, pursue, and monitor a strategy (Choo,
2001, Jogaratnam & Wong, 2009, Lau, Liao, Wong, & Chiu, 2012).
Otherwise, facility leaders may decide that an environment is unanalyzable
avoiding environmental scanning at their own peril (Aguilar, 1967, Ferrier,
Smith, & Grimm, 1999). Ultimately, sense-making from ES activities occurs
when leaders construct an assessment strategy by framing experiences and by
creating new capabilities (Milliken, 1987, Weick, 1987). Strategic enactment
occurs when activity, often simultaneous, is introduced to accomplish tasks,
create new capabilities, and create sense within them. It is clear then that
leaders with limited capacity for information processing have to be efficient
in their approach (Daft & Parks, 1988) to get a predictive picture of what
is to come, hence a need for scanning accuracy.
Threat Vector
De-escalation
Vulnerability may be exploited for purposes of
harm to the firm. These threat vectors are specific to each facility; however,
similarities exist between facilities allowing for synergies to be leveraged.
To illustrate, Figure 3 describes a
threat vector and illustrates the increase in loss potential if the
vulnerability is not de-escalated early. In this case the threat vector, one of
the elements on a Risk Register, is shown among other threat vectors all of
which contribute to risk loss. As time elapses the armed robbers moves from
trespassing to homicide as the risk loss potential increases. With a proactive
de-escalation response the vulnerability to loss is decreased.
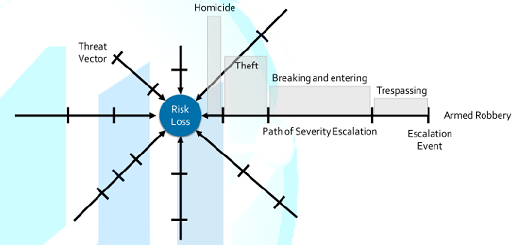
Figure 3: Threat vector and de-escalation.
The output of an ES activity is a
document that enables dialogue about and lists the vulnerabilities and threats
in an organization. It is called a Risk Register (Patterson & Neailey,
2002; Baker et al, 2014). Action can be taken from the transparency created by
the tool. The quantification of risk across the organization allows leadership
to apply their appetite for risk in a more accurate and informed way.
Minimally, the risk team and leadership should be made aware of its contents
periodically. At risk is organizational continuity, loss of property, loss of
life, loss of employee attendance, loss of ongoing revenue, and brand damage.
Each section of the Risk Register for this case will be discussed in detail in
the Findings section.
Risk Register:
An assessment of vulnerability
The
Risk Register is essential for threat management as it records identified
risks, their severity, and the action steps to be taken to reduce threats
(Patterson & Neailey, 2002, Baker et al, 2014). It can be a simple
document, spreadsheet, or a database system, but an effective format is simply
a table. A table presents a significant amount of information in a small area.
Security leaders should use the Risk Register as a risk management tool
(Patterson & Neailey, 2002, Baker et al, 2014). It should be reviewed and
updated continuously so that it can identify, assess, and manage risks to
acceptable levels. For leaders to decide what mitigation steps are acceptable,
they need to know the risks that are present and have a clear understanding of
their risk appetite. Not all risks are known, and some emerge over time,
however, existing threats can be determined based on insight from security team
members, past events, and from news accounts both local and national. Even with
this information in hand, allowances should be made for surprises. The register
provides a framework in which known elements that threaten the activities at
the facility are captured.
Setting
up the Risk Register is important for clarity and understanding of the threatscape
(Patterson & Neailey, 2002, Baker et al, 2014). Leaders comprehend scanning
results when they understand interaction between identified threats and their
influence on the local risk taxonomy (Aguilar, 1967, Hambrick, 1979, Kefalas
& Schoderbek, 1973, Venkatraman, 1989). Attributes of variables in
environmental scanning could include environmental complexity, rate of change,
organization size, impact and frequency of risk events, as well as information
source reliability (Jennings & Lumpkin, 1992, Lindsay & Rue, 1980,
Robinson, 1982, Valencia, 2010). The need for these variables, their variety,
an acceptable variation range within each one, and their weighting validate the
need to customize a scanning framework to a specific location.
The
literature categorizes variables as controllable (ex. location, employee base,
task assignment, organizational structure, and capacity) and uncontrollable
(ex. employee behavior, collaboration between functional areas, technology
changes, economic conditions, attendance drivers, and regulatory restrictions)
(Mitroff & Emshoff, 1979). Controllable variables can be influenced while
uncontrollable variables typically require forced adaptation (Mitroff &
Emshoff, 1979). An example of forced adaptation could be the establishment and
enforcement of a policy. A vulnerability measuring system needs to accommodate
these attributes and accurately represent the threats and associated variables
chosen. Of course, data collection planning and analysis methods assure that
the data collected is complete, relevant, and timely (Choudhury & Sampler,
1997). The methods for collecting the data for this study are now discussed.
Methods
According
to Isaac and Michael (1997), case and field research studies the background,
current status, and environmental interactions of a community. In this case the
community was a group of people that occupied a facility. This in depth
investigation into risk threat management was facilitated by a group of
interested co-researchers that were a part of the organizational security team.
Each person contributed input following a list of questions that were posed in
phases. This single unit was examined using a number of variables and
conditions. A limitation, then, is generalizability to other populations as the
data from this case may not be transferable to other cases. Even so, the data
exposed in this case brings to light experiences that may be common to other
settings thereby providing the opportunity for hypotheses that can be used for
further study. The research information was obtained by asking specific
questions to eight members of a team at a facility. Subjective bias was
controlled by listing all the information that was obtained and then
prioritizing it. Furthermore, Likert scales were used that could then be
averaged. Each participant understood the objectives of the study; to
understand the threats and mitigating controls in existence at the case sight.
The Risk Register framework presented in Figure
4 scaffolded the solicitation of information.
In
the beginning of the study, survey questions related to the descriptions of
historical events that each member of the security team was aware of their
either had happened or could happen based on local events documented in media.
Members of the security team were well informed of crime in the area as they
were also members of the law enforcement community. They had access to video
footage stored on site that described historical events. These descriptions
were then categorized by the type of crime and an identification number was
assigned. The security team members were then asked to provide a probability
number and severity number for each description. These were assigned to each
item based on a Likert scale shown in Figure
7. From the resultant values a high, medium and low designation was
assigned. The quantification of the risk loss threat description was then
complete and average values could be obtained. Finally, the risk loss type was
assigned.
The
security team was then asked what the mitigating controls were that were
deployed to mitigate these risk loss events. They provided the controls as well
as the value of the controls in terms of providing awareness that an event was
occurring and also a value of the controls ability to mitigate the event. These
were recorded for each item and the average was shown at the bottom of each
table for mitigation and awareness. The multiplication of the mitigation and
awareness values is the risk priority number. The total of each multiplication
resulting in an overall RPN of 617.
The
team brainstormed control enhancements. With these in mind projected mitigation
and awareness values with these controls in place were determined for each
threat vector. If a control did not have a significant impact on the as-is
mitigation or awareness variables, then it was dropped. The projected values
for mitigation and awareness when multiplied became the projected RPN; 449. This
value could be compared against the as-is RPN to see the impact of the
enhancements.
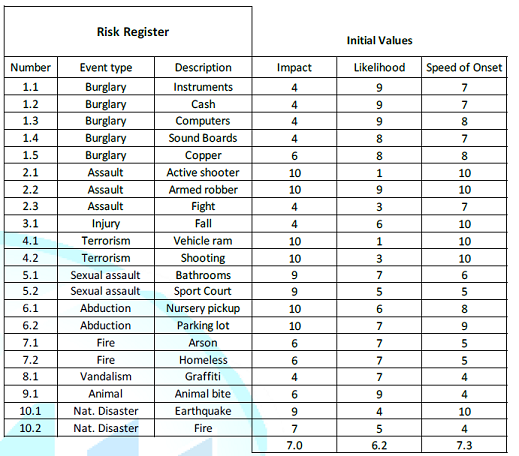
Finally,
the security team was asked the impact of the loss event would be, what
likelihood of the event occurring would be, and how fast the event could
happen, for each description. These values were captured using similar Likert
scales and documented in the Risk Register. These values were then used for the
heat map.
Case
studies are made of materials collected while working with a group of
individuals in a community. The intent of this case was to present a problem
through awareness and then determining ways to reduce the potential impact or
frequency of occurrence of the aspects within the problem. The author carefully
considered the balance between providing important information and keeping
confidential material protected. It is not possible to ensure that all of the
materials collected are in fact accurate and complete. However, to a
significant extent the facts as stated can be verified by other researchers,
even in other communities that have similar threats.
Findings
Risk Register
The Risk Register must be current
and transparent to leadership, so they can see which risks or vulnerabilities
they are tolerating, and which ones are being addressed (Patterson &
Neailey, 2002, Baker et al, 2014). Leaders may flag risks that havent been
registered so that they are included in the vulnerability measurement and so
that leadership can provide options for risk mitigation. There are several key
sections to the register. An overview of the figure below, an actual facility
Risk Register is discussed.
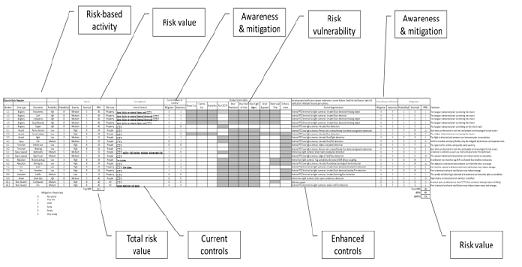
To view Figure 4, click below
Figure 4: Risk Register sections. The content is intentionally unreadable to focus attention on the sections.
The Risk Register has an owner
that is listed at the top on the left next to the facility that the Risk
Register is for. This person should be on the security team and be responsible
for adding threats as they are discovered, and as they emerge. The source of
this information can be external due to trends or internal from any
stakeholder. The landscape is constantly changing, and the Risk Register needs
to be kept up to date so that leadership is aware of the vulnerabilities and
actions taken to mitigate them. Each threat was assessed on several levels.
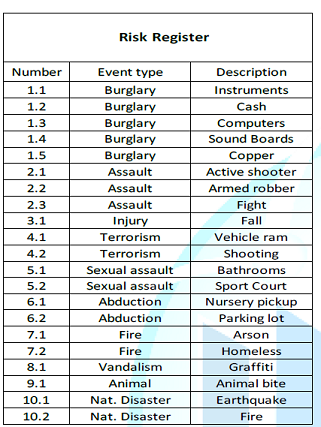
First, the threat, once registered, was given an item number for reference. The
first digit was related to the type of threat (ex. Burglary) with the decimal
number being the action from the threat source (ex. stealing instruments). This
allows for a breakdown of a threat into risk loss categories, and is
illustrated in Figure 5 below.
To view Figure 5, click below
Figure 5: Risk register threats.
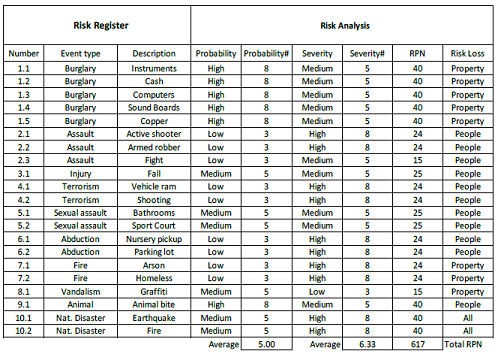
Each threat action was described
in terms of the probability and severity of the occurrence. The probability and
the severity are simply defined as High, Medium, or Low. No one knows this
better than the security team as they know the history and the impact of
losses. The probability and severity numbers are an 8 for high, a 5 for medium
and a 3 for low. These two numbers (probability and severity) multiplied by
each other produce the Risk Priority Number (RPN). The spreadsheet can be
sorted on this column from highest to lowest to produce a prioritized list of
threats. This may help with consensus on what to work on first. By reducing the
highest priority threats first, the RPN is reduced faster. The average
probability and severity will be reduced with increased mitigation influence on
the risk. In the meantime, these three numbers can be used as a baseline for
the current threatscape along with the existing mitigating controls. Typically,
when the risk-loss type is human the severity number will be higher. These
elements are shown in Figure 6.
To view Figure 6, click below
Figure 6: Risk Analysis.
In a column to the right of the
risk loss type the existing controls can be listed as shown below. It is good
to know how strong the controls for mitigating the risk are. Where the controls
are not strong, they could be enhanced to reduce the RPN. The influence of the
controls is represented by two values based on a Likert scale in Figure 7.
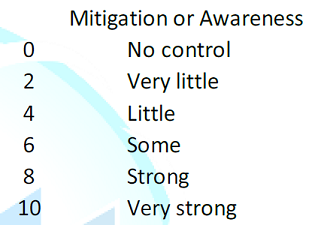
Figure 7: Likert scale for mitigation and awareness values.
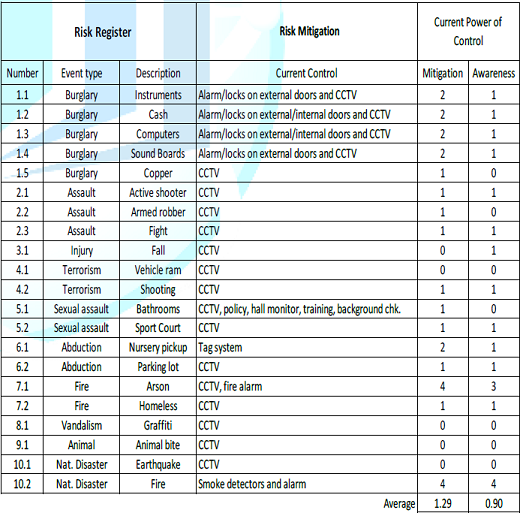
In the Current Power of Control
section, the mitigation column is the extent to which the current control
reduces a threat. The second column, awareness, is the extent to which the
control makes those who can take action to mitigate a loss aware of the threat
so that they can respond (Driouchi & Bennett, 2011). Again, the average of
the mitigation and awareness variables at the bottom of the columns can be seen
as a baseline to be improved. These values characterize the current state Figure 8.
To view Figure 8, click below
Figure 8: Existing controls and their impact.
The current threatscape is now
documented. The known threats are registered along with their potential impact.
The existing mitigating controls and their influence are documented with
measures. With this information the solutions part of the Risk Register can be
exploited to reduce the baseline values. Leadership will need to decide if
physical and/or procedural controls will be used. If procedural controls are
used, a discussion about enforcing the procedures will be relevant to their
impact. Additionally, the reaction time to threats must be minimized and
methods for the enforcement of policies will need to be considered. The choices
made have an effect on the existing vulnerabilities and reduce the risk threat
values. The mitigations taken are unique to each site and so are not listed;
however, their impact is in Figure 9
below.
To view Figure 9, click below
Figure 9: Threatscape with augmented controls.
The table indicates that each
control was augmented to a varying degree based on a like-for-like assessment
in relation to the based control. The net impact in this case study is a 73%
reduction in the RPN. This reduction is reflected by the difference between the
current and the future RPN, or the Projected Risk Priority Number (PRPN), is
shown as the percent reduction between these two numbers. The control
augmentations and enhancements (intentionally not listed as it is proprietary)
will need to be assessed for their influence on the threats resulting in an
improvement in awareness of threats, an improvement in mitigation power, a
reduction in probability of occurrence, and a reduction in severity if the
vulnerability is exploited. While the percent reduction in risk is not exact,
it represents a method that was applied to a case to measure risk threats. And,
it shows considerable impact from the actions that were taken. If the percent
reduction were ten percent, then leadership would need to require more analysis
so that stronger solutions are brought forward.
Threat scape
Management
The
contents of the register will indicate if the facility is a hard or soft target
(Patterson & Neailey, 2002, Baker et al, 2014). This posture will be clear
to lone-wolfs and burglars alike, leading to either an invitation or
deterrence. The register includes the value assigned to the risk, the crime
type, the description of the crime, the probability of occurrence of the action
happening, the severity if it did happen (high, medium, low), the type of risk
(people, property, reputation, etc.), the mitigation decided upon and if the
mitigation control is effective or not. A
domain is weighted relative to the influence of other domains in the framework.
A dominant outcome driver, or dominant domain, should not be ignored or treated
as an equal. Domain weights can be assigned using a Likert scale, or be linked
to variable significance. Domain specific tasks and their weights inform the
overall strategic plan. An understanding of the dynamic nature of internal and
external metrics (Bandy, 2002), a prospect of future expectations (Chrusciel,
2011), and an awareness of the weighted performance drivers on the critical
path are essential to the strategic plan. The
security team and the leadership representation on the security team decided
what the mitigation to deploy should be based on a cost benefit analysis. The
team must also assure that the augmented control is deployed and meets expected
performance levels. And, they must have a means to know if the control has
fallen out of place such that it is not mitigating the threat anymore. For
example, a new sign could have been placed in the field of view of a camera
making it ineffective. While the threat risk may be reduced, it may not
disappear. When it is still present, it should stay on the register. It may be
described differently if needed. The outcome of the process was that the
frequency of occurrence of a loss was reduced when the mitigations where
deployed.
The Illusion of
Vulnerability Mitigation Assurance
Many
leaders embrace an illusion of security. For example, a facility may have 140
surveillance cameras in place. Some of these cameras may be off line, broken,
dirty, not focused, with insufficient resolution, have an inability to handle
luminance changes, have a poor field of view, have a blocked field of view, or
be pointed in the wrong direction. When the leader is asked if they have
adequate security management, the response is that there are 140 cameras
covering the campus. While providing some deterrent value, having a large
number of cameras does not provide the mitigating control to reduce threats as
obfuscation techniques are well known. While insurance companies value camera
systems, they typically do not check to see if they are effective or even
capable to produce evidence for forensic analysis in the event that harm
occurs. The intention is that cameras are a forensic tool to find out what
happened after the crime was committed assuming the needed footage is
available. In the event that the criminals do not remove the video storage
device, other issues with the system may keep forensic footage from being available
to law enforcement. Cameras
may not handle light well, not have an appropriate field of view, go black in
the dark, be out of service, flare when pointed towards sunlight, be
obstructed, or be blinded by a nearby light source. The perception of security
is not the same as good security. Understanding threats is the start of a
mitigating design. Having a system that is able to de-escalate a threat
scenario will reduce recovery losses as they may mitigate a harmful act before
it happens. Consequently, a threat-based approach is not only more effective,
it is also cheaper. For example, purchasing surveillance equipment to cover
areas where the threat is low, or non-existent, is a waste of resources as
these resources should be collecting data where the risk is higher. An example
of poor light management is shown in Figure
10 below. In this case a light was placed in the field of view of a camera.

Figure 10: Capability challenges of video collection.
It
is worth noting that often the assumption is that the building alarm system
will take care of the security needs of the facility. Many bad actors have
adopted shared best practices (seen on YouTube, for example) that have made
them successful in causing harm to facilities. For example, it is possible to
cut the power in the power panel (or even at the meter) and cut the telephone
or internet lines to the building eliminating communication. It is also
possible to disable alarm boxes. Even if communication is not cut, thieves know
the response times to get in and get out before the police arrive (smash and
dash) and jammers can be used to block wireless systems. While bad actors may
only take items that will return $1000 they may cause $5000 worth of damage to
achieve this. Thieves gain entry by damaging doors, however, bumpkeys can be
used to gain access to almost any lock without damage. Burglars may also take
DVR/NVR video storage with them, removing forensic evidence from the scene.
With these scenarios logged in the Risk Register, leaders become aware and may
believe that their existing security controls are keeping them secure, when in
fact it is not the case.
A Predictive
Approach
This paper is not about the Risk
Register, but rather the use of it to improve the security posture of a
facility. An analysis produces no value until it is acted upon. Consequently,
the scope of the discussion needs to include leaderships status quo posture and
a posture that reduces the opportunity for risk-based losses and liabilities.
The evolving discussion then includes the authors position on the topic, that
there are four types of leaders with regard to risk management. The first is
the head in the sand leader. This leader does not think that anything could happen
and if it does, then it was supposed to be that way. When an issue occurs, this
facility will likely close down. Some workers will be afraid to come to work,
and the leaders end up losing their position. The damage is done and the leader
did not serve the interests of their employees. A defense that it was supposed
to be adequate may be only abdication of responsibility. The second kind of leader is the
reactive leader. The emphasis here is on recovery after a loss. Typically the
full value of the loss is not recovered, and so harm to the organization
occurs. Even if assets lost are recovered, an amount of loss will be incurred
and find its way onto the financial statements of the facility. An insurance
claim is filed and the rest of the cost including the deductible is taken from
the budget. This money will be used to restore the property to the extent
possible over a period of time during which the brand is vulnerable. The third
type of leader is a proactive leader. This leader will take action to prevent
risk loss from happening. Generally, this posture works except when a threat
emerges that was not considered in the risk mitigation plan. In all of these
cases, human loss is tragic. The proactive leader must try to minimize losses
through preparedness and enhanced controls. The last and fourth type of
leader is the predictive leader who approaches the threatscape anticipating
that changes in the threatscape will happen. The best case is that this leader
prepares mitigations before threats emerge. Minimally, as threats emerge or
occur elsewhere, this leader thinks about mitigations immediately. The
predictive leader doesnt need to recover because mitigations are anticipated
and in place prior to the threat visiting the facility. The predictive leader
will keep property, brand, and human loss from happening. While all threats cannot be
mitigated, leadership demands an approach that prevents losses. Threats should
be known and mitigated before they have the opportunity to cause damage. The
organization should anticipate the discovery of threats and be able to assume a
posture quickly to thwart the threat or discourage it. In some cases, controls
may also help keep risk threats from escalating as mitigating action can be
executed before the severity of the threat increases. When leaders are ready to deter malicious
acts, bad actors stand down.
Loss Likelihood
and Impact
The ability to minimize loss by
prioritizing preventive actions can be further understood through a risk threat
matrix as shown in Figure 11 below.
In this case, leadership can decide on the actions to take first by looking at
the likelihood of a loss and the impact of it. When the existing controls are
augmented and deployed, the RPN is reduced.
To view Figure 11, click below
Figure 11: Values for the risk threat matrix.
The risk threat matrix can be
exploited by using each item on the risk register and giving it a location on a
heat map and a relative area. A heat map is a visual representation of data
using colors with associated values. The threatscape is essentially a heat map
that shows which threats are critical and which ones are relatively
insignificant. A severe impact along with an almost certain likelihood is the
largest risk-loss threat. In this case, it is armed robbery. Robberies are
common, and when armed, bad actors can injure or kill people who are in the
facility during the robbery. Other events are also severe, such as a
terroristic shooting, however, this act is not as common an occurrence as an
armed robbery. The relative values of the threat type can be validated through
a quantitative survey or through local crime statistics. The area that represents each
threat index relates to the speed of onset. The speed at which the threat is
enacted is critical from a reaction time perspective. With a rapid speed of
onset, the ability to mitigate the loss and de-escalate the event after the act
has been initiated is very low. Consequently, the losses will be higher when
this threat is enacted as illustrated in the Figure 12 below. The values reflected by the risk loss matrix are
set by the local security team and may be agreed to by leadership.
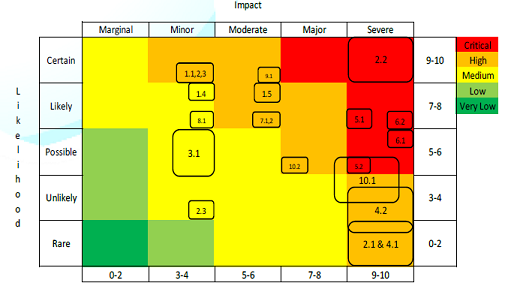
Figure 12: Risk loss matrix heat map.
The risk loss matrix above is the
current state prior to augmented controls. The impact of more powerful controls
will reduce the speed of onset (the box size around the number) while shifting
the location of the box in the heat map from redder to greener. In other words,
the box around the number will shrink as the enhanced control increases the
time of onset. The number and its shrinking box will move towards the left as
the augmented control reduces the impact of an exploited vulnerability. And,
the number with its box will move downwards as the likelihood of the exploited
vulnerability occurring is reduced. A reduction in the RPN ultimately indicates
the management of the threatscape and the reduction in vulnerability at the
facility. The movement of risk threats making them less likely, less impactful,
and having a longer onset time takes focused ongoing leadership within the
organization. Having the right leadership for
change activities is critical (Bossidy & Charan, 2002, Heifetz, 1994,
Smith, Ferrier, & Grimm, 2001, Wilkinson, 2006). An effective leader needs
to be an articulate and enthusiastic conceptualizer who is good at grasping
strategies and explaining them (Bossidy & Charan, 2002). Leadership
includes prioritization, deployment, and measurement against established goals. If outcome measurements indicate
that effort has fallen short of a target, a leader may initiate a limited
improvement cycle as a remediation. Additionally, a framework review may be
prudent due to project duration and environmental turbulence. A framework
conceived during a time of stability may not be applicable during, or
following, a time of volatility (DAveni, Dagnino, & Smith, 2010). Once the framework design has
been fine-tuned and verified as being appropriate by the facility security
team, an accountable leader should initiate a repeat scan to refresh the gap
analysis data. Continuous improvement is an aggressive leadership activity
allowing an organization that embraces learning to keep pace with a rapidly
evolving environment (Ferrier, 2001, Mintzberg, Ahlstrand, & Lampel, 1998).
Multi-site scaling
With
a single facility having achieved a strong or mature posture, the controls
adopted by the facility can now be leveraged for other facilities. The table
below shows how this can be accomplished. Along the column headings are the
list of facilities and a column that relates to the cost of each control item.
Each site may have different control requirements. These
requirements are listed on the rows and are grouped into three classes. A
facility that handles high value assets and needs strong controls would need to
achieve compliance with regard to all three control categories. Other
facilities that handle lower value assets may only have to achieve the first
category. Under each site column a simple Y or N can be used to indicate if the
control is in place. If it is not, the cost to achieve the control can be
listed. This allows leadership to know why the achievement of the control would
cost. The overall cost of compliance is then added up at the bottom of the
column as shown in Figure 13 below.
To view Figure 13, click below
Figure 13: Control assessment and costs.
This table can then be combined with the individual facility Risk Register that indicates the Risk Priority Number for the facility in relation to the threat vectors. This new RPN is what would be expected with the control listed in place. With this construct a leader can know the impact of the investment in the controls in the facility. This section will also show the impact of the investment across all facilities. With these tools in place, leadership can decide how to invest in the vulnerability mitigation posture of all facilities in the global supply chain as shown in Figure 14.
To view Figure 14, click below
Figure 14: Linking the RPN to costs related to facility vulnerability mitigations.
Conclusion
Clarity
around strategic planning is needed for better organizational outcomes. Through
collective sharing, predictive learning, and reflection, leaders can enhance
their ES techniques by using meaningful tools. Quick wisdom generation is
needed in a fast-paced environment; however, sometimes these efforts to collect
information are hampered by constraints imposed by internal and external
sources. For example, the availability of critical information may be a
challenge for a decision maker due to a lack of an organizational intelligence
gathering capability or from an incomplete awareness of legal constraints. By
increasing the speed to wisdom, strategic enactment potential is heightened and
a more secure posture is achieved. Practically, an information collection
capability coupled with an adaptive culture can be helpful in turning wisdom
into action, as long as data is collected and recorded accurately, and can be
extracted in a meaningful format (Choudhury & Sampler 1997, Davis, 1985). Strategic
agility enables an organization to achieve desired outcomes (Morris, 2014,
Sull, 2010) while sustaining organizational success (DAveni, Dagnino, &
Smith, 2010). Potentially strategic agility can be expressed in an algorithm as
follows:
Strategic
Agility = ES Accuracy x Agility x Adaptability
To
elaborate, Scanning Accuracy is simply the capability to obtain and exploit
knowledge of an organizations situation in its environment; current and future.
Agility is the ability to minimize the negative influence of obstacles on
momentum needed for adaptation. Adaptability is an organizations ability to
transform itself to stay ahead of threats, thereby preserving or increasing the
organizations viability and efficacy (Davis & Meyer, 1998). In
some cases, strategic planning is ad hoc with a dependency on serendipity that
may or may not be forthcoming (Aguilar, 1967, Hambrick, 1979, Hambrick, 1981,
Kefalas & Schoderbek, 1973). Alternatively, some organizations see value in
planning and execution (Welch & Charan, 2002). Organizations that plan may
underestimate the complexity that exists between the environment and aspect of
the organization. Even a mature organization may not appropriately understand
or leverage the links between domains that can improve outcome potential. For
example, a control to mitigate vulnerability in one area may have a positive or
negative impact in another. To understand this better, a confident
organization, inviting of criticism, may allow their concerned employees,
department leaders, and members of the security team to influence their
framework design, its weighting, and the metrics that are being applied to have
a better understanding of the complex and dynamic environment (De Pree, 2004). Task
selection within a threat domain directly impacts domain specific goal
achievement (Bourgeois, 1980). These tasks are aligned with goals imposed on a
situation. Ambiguity, uncertainty, and an understanding of residual risk in a
system are critical aspects of environments in transition (Daft & Weick,
1984, Wilkinson, 2006). Specifically, Perceived Environmental Uncertainty (PEU)
is the difference between information needed to make a decision about a task
and information available (Galbraith, 1973). PEU tends to mask composite
measures sought after during scanning activities (Boyd & Faulk, 1996) that
drive task creation. Concurrently, leaders tend to act on a perceived
environment (Boyd, Dess, & Rasheed, 1993) with a goal of achieving a
desired adaptation to a more secure posture (Davis & Meyer, 1998, Hambrick,
1981). Task leaders must also know that environmental variation relates to
changes that may occur independent of a leaders ability to notice, comprehend,
or interpret environment related data (Doty, Bhattacharya, Wheatley, &
Sutcliffe, 2006). Consequently, organizations tuned into their environment,
while allowing for discovery, are more likely to succeed because they are able
to respond predictively through meaningful action and contingencies to a wide
range of signals (Slaughter, 1999). Leaders must understand that the security
locus of control includes those who attend the facility and those who live or
work nearby. When
direct (employees) and indirect (neighbors of the facility) stakeholders know
that a strategic plan is thorough, and when they are given opportunities to
influence the plan (Chrusciel, 2011), they are more inclined to be cooperative
and in alignment with the objectives. Engaged stakeholders are also more likely
to follow a meaningful path laid out for the organization, even if sacrifice is
involved (De Pree, 2004). Even so, it is better to achieve a goal through
strategy than through sacrifice. Although complexity is intensified with the
diversity that exists within stakeholder population, methods discussed in this
article aid in efficient and timely ongoing accomplishment of organizational
postural transitions necessary in turbulent and evolving risk environments
(Aguilar, 1967, Buchholz & Kidder, 1999, Choo, 1999, El Sawy, 1985, Kefalas
& Schoderbek, 1973, McEwen, 2008).
References
1.
Aguilar FJ. Scanning
the business environment (1967) Macmillan Co, New York.
2.
Albright KS. Environmental
scanning: radar for success (2004) Information Management J 38: 38-44.
3.
Anderson P and
Tushman M. Organizational environments and industry exit: the effects of
uncertainty, munificence and complexity (2001) Industrial and Corporate Change
10: 675-711. https://doi.org/10.1093/icc/10.3.675
4.
Baird J. Churches
Can No Longer Hide Domestic Violence (2018) The New York Times.
5.
Baker RHA,
Anderson H, Bishop S, MacLeod A, Parkinson N, et al. The UK plant health risk
register: a tool for prioritizing actions (2014) EPPO Bulletin 44: 187-194. https://doi.org/10.1111/epp.12130
6.
Bandy NM.
Setting service standards: a structured approach to delivering outstanding
customer service for facility manager (2002) J Facilities Management 1: 322-336.
https://doi.org/10.1108/14725960310808033
7.
Martin R and
Lisanne P. Die another Day: What leaders can do about the Shrinking Life
Expectancy of Corporations (2015) BCG Perspectives, The Boston Consulting Group
Report, New York, USA.
8.
Doh JP, Lawton
TC and Rajwani T. Advancing nonmarket strategy research: Institutional perspectives
in a changing world (2012) Academy of Management Perspectives 26: 22-39.
DOI: 10.5465/amp.2012.0041
9.
Beal RM.
competing effectively: environmental scanning, competitive strategy, and
organizational performance in small manufacturing firms (2000) J Small Business
Management 38: 27-47.
10. Bossidy L and Charan R. Execution, the discipline of
getting things done (2002) Crown Business, New York, USA.
11. Bourgeois LJ. Strategy and environment: a conceptual
integration (1980) Academy of Management Review 5: 25-39. DOI: 10.2307/257802
12. Bourgeois LJ. Strategic goals, perceived
uncertainty, and economic performance in volatile environments (1985) Academy
of Management J 28: 548-573. http://dx.doi.org/10.2307/256113
13. Boyd BK, Dess GG, and Rasheed AMA. Divergence
between perceptual and archival measures of the environment: causes and
consequences (1993) Academy of Management Review 18: 204-226. https://psycnet.apa.org/doi/10.2307/258758
14. Boyd BK and Faulk J. Executive scanning and
perceived uncertainty: a multidimensional model (1996) J Management 22: 1-21. https://doi.org/10.1016/S0149-2063(96)90010-0
15. Brackertz N and Kenley R. Evaluating community
facilities in local government: managing for service enablement (2002) J
Facilities Management 1: 283-299. https://doi.org/10.1108/14725960310807971
16. Buchholz A and Kidder D. Integrating agency and
stewardship theories: the moderating role of the environment and time (1999)
Paper printed at the Academy of Management, Chicago, IL.
17. Carpenter MA and Frederickson JW. Top management
teams, global strategic posture, and the moderating role of uncertainty (2001)
Academy Management J 44: 533-545. https://doi.org/10.5465/3069368
18. Choo CW. The art of scanning the environment (1999) Bulletin
of the American Society for Information Science and Technology 25: 21-24. https://doi.org/10.1002/bult.117
19. Chourdhury V and Sampler JL. Information specificity
and environmental scanning: an economic perspective (1997) MIS Quarterly 21:
25-53. http://dx.doi.org/10.2307/249741
20. Chrusciel D. Environmental scan: influence on
strategic direction (2011) J Facilities Management 9: 7-15. https://doi.org/10.1108/14725961111105691
21. Cohin WM and Levinthal DA. Absorptive capacity: a
new perspective on learning and innovation (1990) Administrative Science
Quarterly 35: 128-152. DOI:
10.2307/2393553
22. Cuervo-Cazurra A, Ciravegna L, Melgarejo M and Lopez
L. Home country uncertainty and the internationalization-performance
relationship: Building an uncertainty management capability (2018) J World
Business 53: 209-221. https://doi.org/10.1016/j.jwb.2017.11.002
23. Czarniawska B. Complex organizations still complex
(2007) Int Public Management J 10: 137-151. https://doi.org/10.1080/10967490701323662
24. Daft RL and Parks D. Chief executive scanning,
environmental characteristics and company performance: an empirical study
(1988) Strategic Management J 9: 123-139. https://doi.org/10.1002/smj.4250090204
25. Daft RL and Weick KE. Toward a model of organizations
as interpretation systems (1984) Academy of Management Review 9: 284-295.
DOI: 10.2307/258441
26. DAveni RA, Dagnino GB and Smith KG. The age of
temporary advantage (2010) Strategic Management J 31: 1371-1385. https://doi.org/10.1002/smj.897
27. Davis GB. Management information systems: conceptual
foundations, structure, and development (1985) McGraw-Hill, New York, USA.
28. Davis S and Meyer C. Blur: the speed of change in a
connected economy (1998) Warner Books, New York, USA.
29. De Pree M. Leadership is an art (2004) Random House,
New York, USA.
30. Dess GG and Beard DW. Dimensions of organizational
task environments (1984) Administration Science Quarterly 29: 52-73. http://dx.doi.org/10.2307/2393080
31. Doty DH, Bhattacharya M, Wheatley KK and Sutcliffe
KM. Divergence between informant and archival measures of the environment: real
differences, artifact, or perceptual error? (2006) J Business Res 59: 268-277.
https://doi.org/10.1016/j.jbusres.2005.04.005
32. Driouchi T and Bennett D. Real options in
multinational decision-making: managerial awareness and risk implications
(2011) J World Business 46: 205-219. https://doi.org/10.1016/j.jwb.2010.05.007
33. Duncan RB. Characteristics of organizational
environments and perceived environmental uncertainty (1972) Administrative
Science Quarterly 17: 313-327. https://psycnet.apa.org/doi/10.2307/2392145
34. Dutton JE and Jackson SE. Categorizing strategic
issues: links to organizational action (1987) Academy of Management Review 12:
75-90. https://doi.org/10.5465/amr.1987.4306483
35. Ebrahimi BP. Perceived strategic uncertainty and
environmental scanning behavior of Hong Kong Chinese executives (2000) J
Business Res 49: 67-77. https://doi.org/10.1016/S0148-2963(98)00120-9
36. Elenkov DS. Strategic uncertainty and environmental
scanning: the case for institutional influences on scanning behavior (1997) Strategic
Management J 18: 287-302. https://doi.org/10.1002/(SICI)1097-0266(199704)18:4%3C287::AID-SMJ865%3E3.0.CO;2-B
37. El Sawy OA. Personal information systems in
turbulent environments: can the CEO go on line? (1985) MIS Quarterly 9: 53-60.
https://doi.org/10.2307/249273
38. Fahey L and Narayanan VK. Macro environmental
analysis for strategic management (1986) West Publishing, St. Paul, MN, US.
39. Ferrier WJ, Smith KG and Grimm CM. The role of
competitive action in market share erosion and industry dethronement: a study
of industry leaders and challenges (1999) Academy Management J 42: 372-388.
https://doi.org/10.5465/257009
40. Galbraith JR. Designing complex organizations (1973)
Addison-Wesley, Reading, MA, US.
41. Goll I and Rasheed AMA. Rational decision making and
firm performance: the moderating role of environment (1997) Strategic
Management J 18: 583-591.


