Introduction
More than 30 years ago
Antonovsky introduced the concept Sense of Coherence (SOC) [1-3]. He defined
SOC as “global orientation that expresses the extent to which one has a
pervasive, enduring though dynamic feeling of confidence that the stimuli
derived from one’s internal and external environments are structured,
predictable and explicable; the resources are available to meet the demands
posed by these stimuli and these demands are challenges, worthy of investment
and engagement”. It was a salutogenic point of view emphasizing a subject’s
protective resources and factors promoting health.
The original 29-item
SOC scale is comprised of three subscales [1,3]:
- Comprehensibility (11 items): The extent to which the social world is interpreted
as rational, understandable, structured, ordered and predictable; a dimension
referring to cognitive controllability of one’s environment.
- Manageability (10 items): The extent to which individuals consider resources
to be personally available to help them cope adequately with demands, stimuli,
and problems.
- Meaningfulness (8 items): This motivational component assesses whether a
situation is appraised as challenging and whether it is worth making
commitments and investment to cope with it.
The intention of
Antonovsky was to let the total sum-score represent the concept of SOC rather
than the subscale sum-scores. Antonovsky’s SOC focuses on the origins of health
and well-being rather than disease and as such constitutes the basis of the
salutogenic model [1]. People with a strong SOC seem to have the capacity of
dealing better with stressors of everyday life and to use available resources
to cope with these stressors [4]. This ability of coping may lead to better
health for people with a higher SOC. Although the evidence for the effect of
SOC on health is yet insufficient, groups with low SOC seem particularly
vulnerable to difficulties in life, leading to poorer lifestyle choices,
increased disease incidence and increased mortality [5-8]. SOC has been linked
to quality of life and perceived health, in particular mental health, in two
systematic reviews [9,10]. SOC seems to have a modifying influence on mental
health outcomes.
In a study of people
who had faced early childhood deprivation during the Holocaust, SOC moderated
the association between early life deprivation and post-traumatic stress in old
age [11]. A strong SOC could therefore be an important coping resource for
remaining healthy [12]. Furthermore, SOC could be modified through intervention
programs, [13,14]. A Finnish study compared employees aged 31-51 years with
burnout-symptoms with regard to two different interventions with similar aims
of reflecting the participants values, goals, beliefs and patterns of
behaviour. After 9 months both intervention groups showed a significant
increase in SOC compared with the control group [14].
A 12-month lifestyle
intervention program was implemented among persons with psychiatric
disabilities aged 22-71 years. Structured activities with sufficient level of
challenge contributed significantly to an increase in SOC, compared with the
control group [13]. Even if the number of studies is small, the results suggest
that interventions can influence SOC levels, also at old age, and that
promotion of health might benefit from strengthening of SOC [15]. SOC can also
be regarded a social concept that relates to socio-demographic factors [3].
According to Antonovsky’s theory, SOC develops along with experiences through
childhood, adolescence and adulthood and could in favorable circumstances reach
a stable level after the age of 30 years [3]. Volanen, et al., [16] found that
SOC increased with age and was most stable among the oldest subjects.
Gender differences have
been reported from SOC research. Some earlier studies found stronger SOC among
boys and men compared to girls and women [17]. Furthermore, women have been
reported to be less happy, less educated, less employed, and more distressed
with a lower SOC [18]. However, gender differences in SOC have not been consistently
reported [19]. Another study concluded that good social relationships
contribute to SOC [20]. Partnerships through cohabitating and marriage may
influence SOC and generally, those subjects living with a partner had higher
SOC-scores [16]. SOC has been shown to be related to socio-economic factors
[20]. A positive but small relationship between income and SOC among women was
reported from Canada [21]. According to Geyer, a strong SOC is shared by people
who are well educated and have higher socio-economic positions [22].
Consequently, he
proposed that high SOC should predominantly be present in higher social classes
and suggested that the SOC measures social status [22]. Deprived areas are
often associated with low social integration and poor social control. Low
social integration may lead to a sense of meaninglessness, which can give rise
to poor mental health, suicide and violent death [23]. However, Remes, et al.
found that SOC can moderate the association between area deprivation and
General Anxiety Disorder (GAD) in women [12]. Mental disorders have been found
to be associated with SOC; a strong SOC was negatively associated with anxiety,
depression and post-traumatic stress disorder [10]. Similar results were
reported by Frenz, et al., (1993) [24] and Henje Blom, et al., (2010) [25].
Furthermore, lasting
characteristics such as personality traits have been shown to be involved,
influencing both SOC and depression. The same study showed that SOC was
strongly negatively correlated with levels of trait anxiety [26]. It has been
suggested that depressive symptoms are strongest related to the Meaningfulness
factor and anxiety symptoms strongest to the Comprehensibility factor [27].
Furthermore, SOC is related to psychotic disorders and substance use disorders
as well [28]. Low SOC has been found to be a predictor of alcohol dependence
[29]. However, one study found that a strong SOC was significantly related to
not reporting dependence in 4,630 current drinkers [30]. Antonovsky suggested
that 13 of the 29 items could serve as a shorter version of the original scale
[1]. Thus, the SOC scale exists in at least in two forms; the original 29-item
SOC scale (SOC-29) and the 13-item SOC scale (SOC-13). SOC-13 has five items
concerning Comprehensibility, four items concerning Manageability, and four
concerning Meaningfulness. To the best of our knowledge Antonovsky himself
choose the 13 items but it is unknown why these particular items were chosen.
Pallant and Lae (2002) [31] recommended the 13-item scale when time or space
limitations prevented use of the full scale. Eriksson and Lindström (2005) [32]
showed that the 29-item SOC scale and the 13-item SOC scale version are valid
and reliable instruments to assess how people manage stressful situations and
stay well. However, Jakobsson (2011) [33] did not find acceptable construct
validity for the 13-item SOC and remarked that this version may not be
representative of SOC theory.
The aim of this study
was to determine if a reasonable explanation could be found why the particular
13 items were selected for the SOC-13 scale. This was done by comparing how
well socio-demographic variables and mental disorders related to sum-scores of
SOC-13, SOC-29 and sum scores of the excluded 16 items (SOC-16), and how well
the sum-scores correlated with each other. Furthermore, we investigated if the
single items from SOC-13 related stronger to sociodemographic and mental health
variables than the single items from SOC-16. Finally, for each item we
investigated the distribution of the responses in order to search for
differences between the two sets of items.
Material and Methods
The
Lundby Study
The Lundby Study is a
prospective study of mental health in an unselected population consisting of
subjects living in the south of Sweden. It started 1947, comprising 2,550
subjects living in a geographically defined area. In (1957) 1,013 subjects who
had moved into the area were added to the cohort; subsequently the cohort
comprised 3,563 subjects. Since then, no subjects have been added [34]. All
subjects were followed in later field-investigations, regardless of domicile.
In the follow-up in 1997, the last field-investigation, the population included
1,797 living subjects aged 40-96 years.
All subjects were
investigated by a semi-structured interview. In 1997, introductory letters were
sent to the subjects in the cohort. Subjects were contacted by telephone, and
appointments were scheduled with participants. Experienced psychiatrists
conducted the interviews at home, starting with questions about the
individual’s physical and mental health and contact with healthcare providers.
Mental health assessment included substance abuse disorder, also alcohol use
disorder. Additional information was obtained through relatives or other key
informants, such as general practitioners and from official registers including
hospital case notes (psychiatric and non-psychiatric) [35].
Sociodemographic
Assessment
Gender and age were
registered. Civil status is here categorized into living alone or living with a
partner. The subjects were categorized into three socio-economic levels:
blue-collar workers (unskilled, semiskilled and skilled workers); white-collar
workers (assistant non-manual employees, employed and self-employed
professionals, higher civil servant and executives) and self-employed workers
(other than professionals).
Diagnostic
Assessment
The subjects were classified
according to the Diagnostic and Statistical Manual of Mental Disorders,
(DSM-IV) and according to the Lundby diagnostic system, a diagnostic system
adapted to fieldwork [35,36]. In the present study, the diagnoses were grouped
into the following categories: depressive disorders, anxiety disorders,
somatoform disorders, organic disorders, psychotic disorders, dementia, alcohol
use disorders and personality disorders.
Depressive disorders
correspond roughly to the diagnosis of major depression in the DSM-IV and
anxiety disorders comprised of generalized anxiety disorders, panic disorders,
and social phobia. Somatoform disorders included undifferentiated somatoform
disorder and pain disorders. Organic disorders included syndromes with
cognitive deficits, such as memory difficulties, slow or delayed reactions, and
concentration difficulties (e.g. cognitive disorder NOS). Psychotic disorders
in the Lundby Study included schizophrenia and other psychotic disorders
including manic states. Dementia included multi-infarct dementia, Alzheimer’s
disease and other varieties of dementia. Alcohol use disorders were comprised
of alcohol use disorder and alcohol dependence. Personality disorders
correspond to personality disorders according to the DSM-IV.
SOC
Assessment
The Antonovsky SOC
scale has been translated into many languages and has been in use worldwide
[10]. A Swedish version of the original 29-item SOC and the 13-item scale has
been in use since 1990 and was utilized in the present study [37]. Each item in
the SOC questionnaire is scored from 1 to 7, the total score ranges from 29 to
203; higher scores indicate stronger SOC. The questionnaire was given to
participants after the interview with a request for it to be completed later
and returned by mail [35]. Thus, the psychiatrist was not present when the
participant completed the questionnaire.
Statistics
The socio-demographic
variables in the sample were described using medians and quartiles, as well as
with absolute and relative frequencies. Sum-scores for SOC-13, SOC-16 and
SOC-29 were calculated. Linear regression models were used to investigate how
demographic factors could explain the variations in the sum-scores of the
SOC-13 and SOC-29. The relationships between the sum-scores for SOC-13, SOC-16
and SOC-29 and age were calculated using Spearman’s correlation. The
relationships between the sum-scores for SOC-13, SOC-16 and SOC-29 and
socio-demographic variables other than age were analyzed using the Mann-Whitney
U-test and the Kruskal-Wallis test. Spearman’s correlations were used to
evaluate the relationships between age and the individual items.
The Mann-Whitney U-test
and the Kruskal-Wallis test were used to investigate the relationships between
the individual items in the SOC questionnaire and socio-demographic factors and
mental disorders. We calculated mean, standard deviation, and skewness of the
responses for each item and compared the means of these characteristics for the
items in SOC-13 with the means of the characteristics for the items in SOC-16.
This was done for individuals without and with a mental diagnose, and for all
individuals together. We investigated the prevalence of missing answers on the
SOC-13, SOC-16 and SOC-29 in relation to socio-demographic factors.
P-values<0.05 were considered significant.
Results
Participants
In 1997, 1,559 of 1,779
(87.6%) participants were interviewed and 1,164 (65.4%) completed the SOC
questionnaire. The sociodemographic factors and the point prevalence of mental
disorders are presented in Table 1. Median age was 60 years (inter quartile
range, 51-69 years). Most participants were living with a partner (72.7%). Less
than 10% were self-employed, around 40 % were white-collar and around 50% were
blue-collar workers. The most common prevalent mental disorders were
personality disorder (6.0%), alcohol use disorder (5.4%), anxiety disorder
(5.0%) and depressive disorder (3.2%). More women were living alone and
suffered more from depressive, anxiety and somatoform disorders compared to
men. On the other hand, alcohol use disorder was more prevalent among men. The
questionnaire was not completed for 395 persons, who were considered as
drop-outs.
The drop-outs were
often males, unmarried and blue-collar workers. Slightly fewer subjects among
the dropouts in comparison to those that filled in the SOC were diagnosed with
a mental disorder; however, the prevalence of alcohol use disorder was somewhat
higher among dropouts compared to participants (6.8% vs. 5.4%).
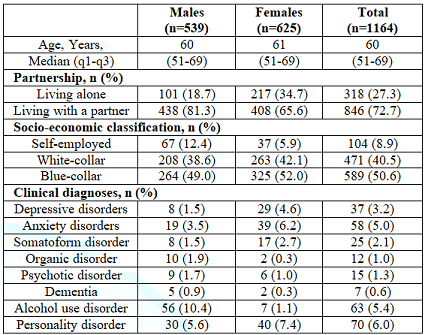
Table 1:Sociodemographic factors and point prevalence of mental disorders (n=1164) inthe 1997 investigation.
Relationships
between SOC Sum-Scores, Socio-Demographic Factors and Mental Disorders
Relations between
socio-demographic factors and mental disorders on the one hand and sum-scores
on SOC-13, SOC-16 and SOC-29 on the other are presented in in Table 2.
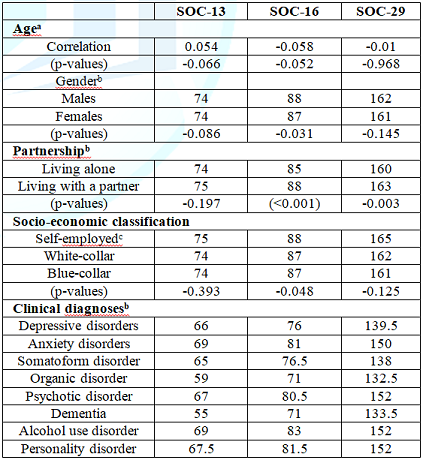
Table 2: Spearman’scorrelations between the sum-scores on SOC-13, SOC-16, SOC-29 and age. Mediansum-scores of SOC-13, SOC-16 and SOC-29 for gender, partnership, socio-economicclassification and mental diagnoses.
No significant
relationships were obtained between SOC-13 and the socio-demographic factors,
except for age, where there was an almost significant (p=0.066) positive
correlation. In contrast, the sum-score for SOC-16 was negatively and almost
significantly correlated with age (p=0.052); but SOC-16 was also significantly
correlated with the remaining three sociodemographic factors, giving higher
values to men, those living with a partner and self-employees. Partnership was
the only factor significantly correlated with SOC-29, giving those with a
partner higher value. Individuals with a diagnosis of a mental disorder had
significantly lower scores on all three SOC scales. The diagnoses with the
lowest SOC scores were organic disorder, dementia, somatoform disorder and
depressive disorder. Linear regression models relating the sociodemographic
variables to SOC-13 and SOC-29 sum-scores as dependent variables were analysed.
The regression coefficients for age and partnership were significant (0.07,
p=0.022 and 1.62, p=0.040, respectively) for the SOC-13 sum-score. Only
partnership was significantly associated with the SOC-29 sum-score (regression
coefficient 5.16, p=0.001), whereas age was not significantly related to the
SOC-29 sum-score after controlling for partnership.
Relationships
between Sociodemographic Variables and Each of the 29-Items
The significances of
the associations between the items in the questionnaire and the
socio-demographic variables are presented in Table 3, separated into the three
subscales. Much strong significances were found in the relationships to age for
both SOC-13 and SOC-16, within all three subscales.
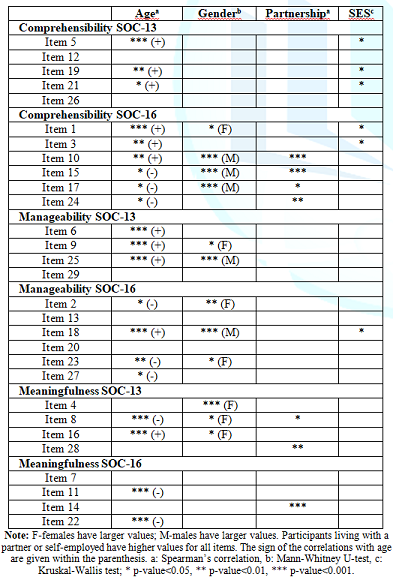
Table 3: Significantrelationships between each item from SOC-29 and sociodemographic variables.SOC-13 items are presented before SOC-16 items for each subscale.
However, the directions
of the relationships differed, among SOC-16 most items with negative
correlations appeared. Gender significances were observed in the
comprehensibility subscale only for some items from SOC-16, mainly giving males
higher values. For items from the manageability subscale, no clear difference
was found between SOC-13 and SOC-16 in relations to gender. Finally, females
generally scored higher on items in the SOC-13 for the meaningfulness subscale.
There were significances for partnership on SOC-16 items in comprehensibility;
and in both the SOC-13 and SOC-16 for meaningfulness. No strong significances
for socio-economic status were detected, neither for SOC-13 nor SOC-16. Some
weak associations were found in the comprehensibility scale, where blue-collar
workers had higher values both on SOC-13 and SOC-16.
Relationships
between Mental Disorder Diagnoses and Each of the 29 Items
The majority of the
items related significantly to a mental disorder with no clear distinction
between SOC-13 and SOC-16 items. For depressive disorder, anxiety disorders or
somatoform disorder there were no substantial distinctions in correlations to
SOC-13 and SOC-16 items. Depressive disorder in the manageability subscale was
slightly more correlated to SOC-16 items than to SOC-13 items. Organic
disorders showed stronger correlations in SOC-16 items from the meaningfulness
subscale.
Psychotic disorders
correlated more often to SOC-13 items in the meaningfulness subscale than to
SOC-16 items. Few significant correlations were found for dementia, whereas
personality disorders correlated higher to items in SOC-13 from the
manageability subscale (Table 4). Pearson’s correlation coefficient between
sum-scores for SOC-13 and SOC-16 was 0.817. SOC-13 had a somewhat lower
correlation (0.576) to SOC-16 for the comprehensibility subscale. The
correlation between SOC-13 and SOC-16 was 0.593 for the manageability subscale,
and 0.717 for the meaningfulness subscale.
In table 5 we compare
the mean values of the statistical characteristics mean, standard deviation and
skewness of responses for items belonging to SOC-13 and to SOC-16 for
individuals with and without a mental diagnose, and for all individuals
together. In general, the means of items belonging to SOC-13 were higher than
the means for items belonging to SOC-16; the standard deviations were more or
less equal. The skewness values revealed that the distributions were generally
more negatively skewed for items in SOC-13. Mean values were in general lower
and the distributions of the items were less skewed for those with a mental
illness. The number of missing values was low. A tendency towards more missing
values for items in SOC-13 compared to items in SOC-16 was found (result not
shown). In total, 1,090 subjects had no missing values, 63 had 1 missing value,
5 had 2, 3 had 3, and 3 individuals had 4 missing values.
There were in total 94
(0.28%) missing values. The occurrence of missing values was not related to
gender, partnership, or socioeconomic status. However, a significant positive
correlation was observed between age and the number of missing values; those
with no missing values had a mean age of 59.9 years, while those with 1-4
missing values had a mean age of 66.2 years (p<0.001).
Discussion
The aim of the present
study was to explore why the specific 13 items were selected for the shorter
version of the SOC. According to the theory, SOC could be seen as a way of
viewing life leading to the deployment of coping strategies in stressful
situations. Subjects with good generalized resilience resources could be
expected to frame the world as organized and understandable and could be fit to
meet stressful conditions. SOC could be considered a social concept used in the
field of mental health.
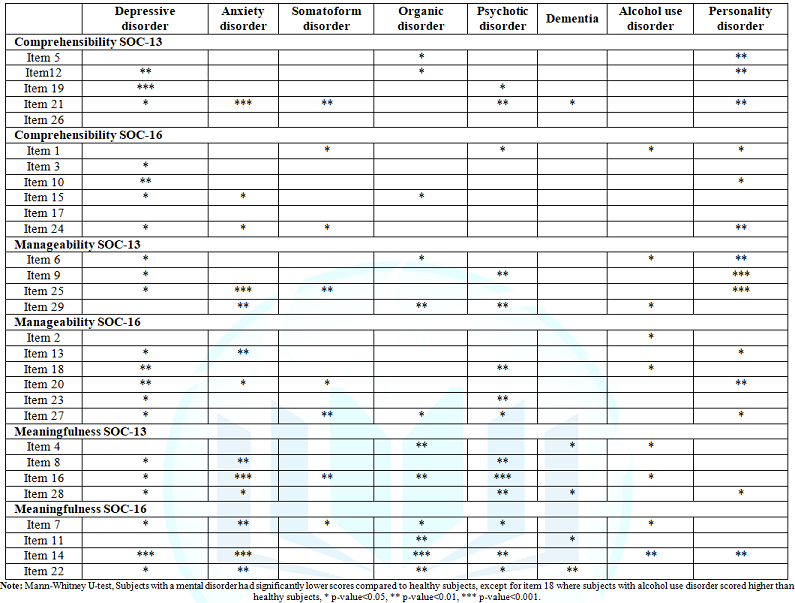
Table 4: Significantrelationships between each item from SOC-29 and mental disorder diagnoses. SOC-13items are presented before SOC-16 items for each subscale.
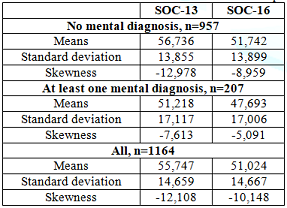
Table 5: Means of thestatistical characteristics mean, standard deviation, and skewness forresponses of items in SOC-13 and in SOC-16, for persons without and with mentalillness as well as for all individuals.
Socio-demographic
factors and mental health have been shown to be related to SOC scales [12,20].
Therefore, it was important to determine if the 13 items selected for the
shorter SOC were more sensitive to variations in socio-demographic factors and
mental health compared to the remaining 16 items. This was accomplished by
comparing the relationships between the socio-demographic factors and the total
scores on the SOC-29, SOC-13 and SOC-16 and by studying the relationships
between the socio-demographic factors and individual items within the three
subscales manageability, comprehensibility and meaningfulness. The
relationships between SOC and mental disorders were investigated in a similar
way. Finally, it was interesting to see if the distributions of the responses
for the 13 items differed from those for the responses on items in SOC-16. We
found different relationships between the sociodemographic factors (gender,
partnership, socioeconomic status and age) and total SOC scores.
SOC-13 did not relate
significantly to any of the factors, SOC-29 related to age, whereas the total
scores constructed by SOC-16 showed significant relationships with all factors
considered. The study of the individual items clarified where the differences
occurred. The values of items belonging to SOC-13 were in general higher than
the values of items belonging to SOC-16 and the distributions were more
negatively skewed for items in SOC-13. Researchers have found different results
regarding associations between age and SOC. It has been suggested that the
second and third decade of life are crucial formative years for the development
of SOC [38].
However, it has been
debated whether SOC remains stable. Some has found that SOC tends to increase
with age over the lifespan [32]. However, on the other hand older age can be
associated with losses, loneliness and deteriorating health, suggesting SOC
could decrease; no significant association was found between age and the SOC-29
sum-score. In our study, several items were highly significantly related to
age; SOC-13 was generally increasing with age, whereas SOC-16 was decreasing
with age. Accordingly, when these two sum-scores were added no significant
correlation remained between age and the sum-score for SOC-29. Due to the
differences in the relationship to age found here for the specific items in the
questionnaire, it appears that the association between age and SOC is not well
captured by the sum-scores.
Higher SOC-scores were
detected for males in comparison to females among Swedish adults aged 60 and 70
years [4]. We found no significant relationships between gender and the SOC-13
and SOC-29 sum-scores; however, males had slightly, but significantly higher
sum scores than females using the SOC-16 (see table 2). The reason for the lack
of significance was understood by looking at the specific items. Males scored
higher on some items but females higher on other items; by creating the
sum-scores these differences vanished. The gender differences appeared
particularly within the subscales; males had higher values than females on the
comprehensibility subscale, but not on the manageability subscale; males had
lower scores on the meaningfulness subscale (see table 3). It is not easy to
explain these differences.
A Finnish study found
that psycho-emotional resources rather than socio-economic circumstances
associated with SOC in both men and women [16]. Thus, neither sum-scores of
SOC-13, SOC-16 nor SOC-29 were suitable to address gender differences; the
sub-scales or possibly specific items should be investigated to understand the
relationship between gender and SOC. Partnership seems to influence SOC. A
study based on SOC-13, concluded that good social relationships and high SOC
are influencing each other [16]. Furthermore, a study using SOC-29 reported
that family-related variables contributed to the explanation of SOC [39]. This
is in line with our results; partnership gave higher values on most items in
the questionnaire. The manner in which relationships are perceived can in
particular influence the way the comprehensibility subscale is answered.
However, the strongest
statistical associations were found in this study for items belonging to
SOC-16; indicating that SOC-16 is probably better than SOC-13 to study the
influence of partnership on SOC. SOC was thought to be stronger for people
raised in a stable home with clearly defined cultural norms [1]. However,
earlier findings from the Lundby Study showed that subjects with what was
considered a high-risk childhood had SOC scores comparable to the scores of
those from the middle class [37]. It is possible that the strength of SOC is
shaped by life experiences in childhood and adolescence but can be modified by
environment such as working conditions [38].
An earlier study
suggested that the stability of an individual’s SOC might be open to the
influence of position in the occupational hierarchy, even after the age of 30
years [40]. Clear associations have been reported between SOC scores and social
classes, in particular occupation. Prospective population studies have shown
that lower socio-economic position is leading to poorer health among people
compared to those at higher socio-economic levels [41]. Unskilled occupational
positions have been shown to increase the risk for lower SOC scores relative to
professional and semi-professional occupations [17]. SOC scores are highest
among those with a high social position and good education [22]. There exists
evidence that stabilization of SOC associates with stabilization of the labour
market position, moreover, the fluctuations of SOC seem to depend on the type
of trajectory throughout adult life [42].
Thus, a more favorable
development of SOC could be seen among those whose trajectories were directed
upward. The associations of poor SOC with unemployment were evident, whereas
the effects of fixed-term employment seemed to be neutral or even positive. In
the present study, we found weak relationships to socioeconomic status and no
profound differences between sum scores for SOC-13 and SOC-29. However, as the
sum-score for the SOC-16 was significantly related to socioeconomic status it
is not obvious that SOC-13 or SOC-29 are more informative than SOC-16. Sweden was
a fairly equal society at the time of the study, which may explain the weak
correlations found here.
Furthermore, with the
median age of 60 in this study many participants were above the retirement age
and thus out of occupation and enjoying a fairly generous retiret system. It
has been suggested that SOC does not capture a salutogenic construct but could
rather be used as a measure of emotionality [43]. SOC has been found to have an
inverse relation to mood and anxiety disorders [25]. The findings are in
accordance with studies reporting that strong SOC is associated with a reduced
risk of psychiatric disorders [8]. In the present study we found strong
associations between mental disorders and all three SOC-scales considered here.
No clear distinction could be seen between SOC-13 and SOC-16.
The distributions of
the responses for the 13 items differed from the responses for the items in
SOC-16 in such a way that the responses of the items were generally higher for
items in SOC-13 and the distributions of responses more negatively skewed. It
is noteworthy that the means were generally very high and close to the maximal
value of 7, for instance 5.57 and 5.10 among all individuals for SOC-13 and
SOC-16, respectively. This implies that most individuals use only the highest
values and not the full range from 1 to 7, and in particular so for items in
SOC-13. Further analysis showed that in 6 of the 13 items more than 70%
answered 6 or 7; while in 5 of 16 items more than 70% answered 6 or 7 (see
Figure 1).
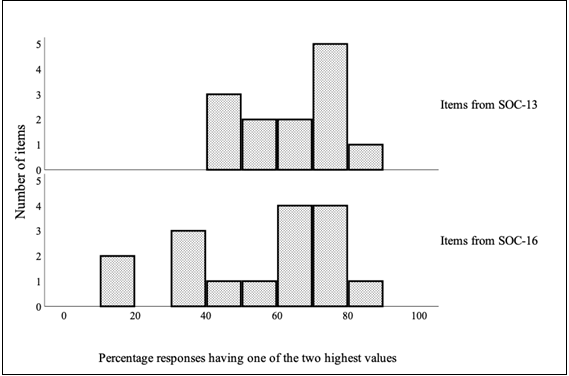
Figure 1: Percentage ofresponses with values in one of the two highest categories out of sevenpossible, 13 items from SOC-13 and 16 items from SOC-16.
The question arises if
the skewness depends on how the response possibilities were formulated. No
explicit words describe the alternatives except for the endpoints, leading to
difficulties choosing values other than the extremes. Expectations form the
social environment may also influence the tendency of giving higher values on
the items. There is also the possibility of psychological mechanisms such as
wishful thinking influencing the answers.
Conclusions
SOC has been considered
a social concept, also used in mental health; therefore, SOC sum-scores would
be expected to relate to socio-demographic factors and mental diagnosis.
However, in the present study different results were obtained, depending on
which of the three scales (29,13,16) were used. In particular, the SOC-16
appeared to be sensitive to differences in socio-demographic factors. In
general, the individual items related similarly to partnership and to some
extent to socio-economic status, but strong inconsistencies were found for the
relationships to age and gender. It was not possible to find a clear
distinction regarding how the items in SOC-13 and SOC-16 related to mental
disorders.
Thus, we found nothing
suggesting that the items in SOC-13 were more informative than the 16 excluded
items. The responses for the items were concentrated on the highest values for
many items, and relatively more so for the SOC-13. The question arises if this
depends on how the items were formulated, and if expectations from the social
environment play a role. It is important to consider what scale to use in
studies of socio-demographic factors. One could, depending on the aim, choose
items, in particular those where respondents use the full scale. More research
is needed concerning the operationalization of the SOC concept.
Strength and Limitations
The cohort was
comprised of an unselected, geographically defined population. There were few
dropouts in the follow-up, diminishing selection bias. There were few missing
values in the SOC-questionnaire. SOC-13 was not applied on its own but was
inherent in the SOC-29.
References
- Antonovsky A. Unravelling the mystery of health
(1987) San Francisco: Jossey Bass, California, USA.
- Antonovsky A. Health Stress and coping (1979) San
Francisco: Jossey Bass, California, USA.
- Antonovsky A. The structure and properties of the
sense of coherence scale (1993) Soc Sci Med 36: 725-733.
https://doi.org/10.1016/0277-9536(93)90033-Z
- Lindmark U, Stenström U, Gerdin EW and Hugoson A.
The distribution of “sense of herence” among Swedish adults: a quantitative
cross-sectional study (2010) Scand J Public Health 38: 1-8.
https://doi.org/10.1177/1403494809351654
- Surtees PG, Wainwright NWJ and Khaw KT. Resilience,
misfortune and mortality: evidence that sense of coherence is a marker of
social stress adaptive capacity (2006) J Psychosom Res 61: 221-227. https://doi.org/10.1016/j.jpsychores.2006.02.014
- Wainwright NW, Surtees PG, Welch AA, Luben RN, Khaw
KT, et al. Sense of coherence, lifestyle choices and mortality (2008) J
Epidemiol Community health 62: 829-831.
https://doi.org/10.1136/jech.2007.066464
- Poppius E, Tenkanen L, Hakama M, Kalimo R and
Pitkänen T. The sense of coherence, occupation and all- cause mortality in the
Helsinki Heart Study (2003) Eur J Epidemiol 18: 389-393.
https://doi.org/10.1023/a:1024213427147
- Kuovonen AM, Väänänen A, Vahtera J, Heponiemi T,
Koskinen A, et al. Sense of coherence and psychiatric morbidity: a 19-year
register-based prospective study (2010) J Epidemiol Community Health 64:
255-261. https://doi.org/10.1136/jech.2008.083352
- Eriksson M and Lindström B. Antonovsky's sense of
coherence scale and its relation with quality of life: a systematic review
(2007) J Epidemiol Community Health 61: 938-944.
https://doi.org/10.1136/jech.2006.056028
- Eriksson M and Lindström B. Antonovsky's sense of
coherence scale and the Relation with health: a systematic review (2006) J
Epidemiol Community Health 60: 376-381.
https://doi.org/10.1136/jech.2005.041616
- Van der Hal-van Raalte EA, Van Ijzendoorn MH and
Bakermans-Kranenburg MJ. Sense of coherence moderates late effects of early
childhood Holocaust exposure (2008) J Clin Psychol 64: 1352-1367.
https://doi.org/10.1002/jclp.20528
- Remes O, Wainwright NWJ, Surtees P, Lafortune L,
Khaw KT, et al. A strong sense of coherence associated with reduced risk of
anxiety disorder among women in disadvantaged circumstances: British population
study (2018) BMJ Open 8: e018501. https://doi.org/10.1136/bmjopen-2017-018501
- Forsberg KA, Björkman T, Sandman PO and Sandlund M.
Influence of a lifestyle intervention among persons with a psychiatric
disability: a cluster randomized trial on symptoms, quality of life and sense
of coherence (2010) J Clin Nurs 19: 1519-1528.
https://doi.org/10.1111/j.1365-2702.2009.03010.x
- Kähönen K, Näätänen P, Tolvanen A and Salmela-Aro K.
Development of sense of coherence during two group interventions (2012) Scand J
Psychol 53: 523-527. https://doi.org/10.1111/sjop.12020
- Super S, Wagemakers MA, Picavet HS, Verkooijen KT
and Koelen MA. Strengthening sense of coherence: opportunities for theory
building in health promotion (2016) Health Promot Int 34: 869-878.
https://doi.org/10.1093/heapro/dav071
- Volanen SM, Lahelma E, Silventoinen K and Suominen
S. Factors contributing to sense of coherence among men and women (2004)
European journal of public health 4: 322-330. https://doi.org/10.1093/eurpub/14.3.322
- Antonovsky H and Sagy S. The development of a sense
of coherence and its impact on responses to stress situations (1986) The
Journal of Social Psychology 126: 213-225.
- Anson O, Paran E, Neumann L and Chernichovsky D.
Gender differences in health perceptions and their predictors (1993) Soc Sci
Med 36: 419-427. https://doi.org/10.1016/0277-9536(93)90404-r
- Volanen SM, Suominen S, Lahelma E, Koskenvuo M and
Silventoinen K. Negative life events and stability of sense of coherence: a five-year
follow-up study of finnish women and men (2007) Scand J Psychol 48: 433-441.
https://doi.org/10.1111/j.1467-9450.2007.00598.x
- Festin K, Thomas K, Ekberg J and Kristenson M.
Choice of measure matters: A study of the relationship between socioeconomic
status and psychosocial resources in a middle-aged normal population (2017)
PLoS ONE 12: e0178929. https://doi.org/10.1371/journal.pone.0178929
- Ing JD and Reutter L. Socioeconomic status, sense of
coherence and health in Canadian women (2003) R Can J Public Health 94:
224-228. https://doi.org/10.1007/bf03405071
- Geyer S. Some conceptual considerations of the sense
of coherence (1997) Soc Sci Med 44: 1771-1179.
https://doi.org/10.1016/S0277-9536(96)00286-9
- Durkheim E. Suicide-a study in sociology (2010)
Simon and Schuster, New York, USA.
- Frenz AW, Carey MP and Jorgensen RS. Psychometric
evaluation of Antonovsky’s Sense of Coherence Scale (1993) Psychological
Assessment 5: 145-153. https://doi.org/10.1037/1040-3590.5.2.145
- Henje Blom EC, Serlachius E, Larsson, Theorell T and
Ingvar MJO. Low Sense of Coherence (SOC) is a mirror of general anxiety and
persistent depressive symptoms in adolescent girls-a cross-sectional study of a
clinical and a non-clinical cohort (2010) Health and quality of life outcomes
8: 58. https://doi.org/10.1186/1477-7525-8-58
- Hart KE, Hittner JB and Paras KC. Sense of
coherence, trait anxiety and the perceived availability of social support
(1991) J Res Pers 25: 137-145. https://doi.org/10.1016/0092-6566(91)90010-n
- Sandell R, Blomberg J and Lazar A. The factor
structure of Antonovsky’s sense of coherence scale in Swedish clinical and
nonclinical samples (1998) Pers Individ Dif 24: 701-711.
https://doi.org/10.1016/s0191-8869(97)00225-0
- Tops A and Hansson L. The validity of Antonovsky`s
Sense of coherence measure in a sample of schizophrenic patients living in the
community (2001) J Adv Nurs 33: 432-438. https://doi.org/10.1046/j.1365-2648.2001.01692.x
- Midanik LT and Zabkiewicz D. Indicators of sense of
coherence and alcohol consumption- related problems: The 2000 US National
Alcohol Survey (2009) Subst use Misuse 44: 353-373.
https://doi.org/10.1080/10826080802347511
- Larm P, Åslund C, Starrin B and Nilsson KW. How are
social capital and sense of coherence associated with hazardous alcohol use?
Findings from a large population-based Swedish sample of adults (2016) Scand J
Public Health 44: 525-533. https://doi.org/10.1177/1403494816645221
- Pallant JF and Lae L. Sense of coherence,
well-being, coping and personality factors: further evaluations of the sense of
coherence scale (2002) Pers Individ Dif 33: 39-48.
https://doi.org/10.1016/s0191-8869(01)00134-9
- Eriksson M and Lindström B. Validity of Antonovsky´s
sense of coherence scale: a systematic review (2005) J Epidemiol Community
Health 59: 460-466. http://dx.doi.org/10.1136/jech.2003.018085
- Jakobsson U. Testing construct validity of the
13-item sense of coherence scale in a sample of older people (2011) Open
Geriatr Med J 4: 6-13. https://doi.org/10.2174/1874827901104010006
- Hagnell O, Essen-Möller E, Lanke J, Öjesjö L and
Rorsman B. The Incidence of Mental Illness Over a Quarter of a Century: Lundby
Longitudinal Study of Mental Illnesses in a Total Population Based on 42, 000
Observation Years (1990) Almqvist and Wiksell Internat, Sweden.
- Nettelbladt P, Bogren M, Mattisson C, Öjesjö L,
Hagnell O, et al. Does it make sense to do repeated surveys?-The Lundby Study 1947-1997
(2005) Acta Psychiatr Scand 111: 444-452.
https://doi.org/10.1111/j.1600-0447.2005.00518.x
- American Psychiatric Association. Diagnostic
Statistical Manual of mental disorders (1994) (4th Edn) American Psychiatric
Association, USA.
- Dahlin L, Cederblad M, Antonovsky A and Hagnell O.
Childhood vulnerability and adult invincibility (1990) Acta Psychiatr Scand 82:
228-232.
https://doi.org/10.1111/j.1600-0447.1990.tb03058.x
- Feldt T, Lintula H, Suominen S, Koskenvuo M, Vahtera
J, et al. Structural validity and temporal stability of the 13-item sense of
coherence scale: Prospective evidence from the population-based HeSSup study
(2007) Quality of Life research 15: 483-493.
https://doi.org/10.1007/s11136-006-9130-z
- Olsson M, Hansson K, Lundblad AM and Cederblad M.
Sense of coherence: definition and explanation (2006) Int J Soc Welfare 15:
219-229. https://doi.org/10.1111/j.1468-2397.2006.00410.x
- Smith PM, Breslin FB and Beaton D. Questioning the
stability of sense of coherence: The impact of socio-economic status and
working conditions in the Canadian population (2003) Soc Psychiatry Psychiatr
Epidemiol 38: 475-484.
https://doi.org/10.1007/s00127-003-0654-z
- Allen J, Balfour R, Bell R and Marmot M. Social
determinants of mental health (2014) Int Rev Psychiatry 26: 392-407.
https://doi.org/10.3109/09540261.2014.928270
- Liukkonen V, Virtanen P, Vahtera J, Suominen S,
Sillanmäki L, et al. Employment trajectories and changes in sense of coherence
(2010) Eur J Public Health 20: 293-298. https://doi.org/10.1093/eurpub/ckp171
-
Schnyder U, Buchi S, Sensky T and Klaghofer R.
Antonovsky’s Sense of Coherence: Trait or State? (2000) Psychother Psychosom
69: 296-302. https://doi.org/10.1159/000012411
Corresponding
author
Cecilia Mattisson, Institute of
Clinical Sciences in Lund, Department of Psychiatry, Lund University, Baravägen
1, SE-221 85 Lund, Sweden, Tel: +4646177800, E-mail: cecilia.mattisson@med.lu.se
Citation
Mattisson C, Gräsbeck
A, Bogren M and Horstmann V. Antonovsky’s short 13-items SOC scale in a Swedish
community cohort-considering the selection of the 13 items from the original 29
SOC scale (2020) Edelweiss Psyi Open Access 4: 7-14.