

Research Article :
Sikarwar MS, Szeek CK and Paliwal N Background: Herbal medicine mostly contains wide range of
chemical compounds responsible for medicinal therapeutic use. Costus woodsonii is commonly called as
Red Button Ginger and synonyms of the botanical name are Costus spiralis, Alpinia
spiralis and Costus pisonis. In
Malay, it is known as Setawar Halia Merah. In Chinese, it is known as Hong Bi Qiao Jiang. Objective: This research was conducted to study the
pharmacognostical, phytochemical, antioxidant and antimicrobial activity of C. woodsonii leaf extracts. Method: Macroscopy, microscopy, phytochemical analysis,
thin layer chromatography, antioxidant activity and antimicrobial activity of C. woodsonii leaf were carried out.
Total flavonoids were estimated in the leaf extract. The total phenolic content
of C. woodsonii leaf was determined
using Folin-Ciocalteu reagent. The antioxidant activity of leaf extract of C. woodsonii was determined by
performing DPPH radical scavenging. The microbial activity was determined by
Well diffusion test, MIC (Minimum Inhibitory Concentration) test and MBC
(Minimum Bactericidal Concentration) test. Result and Discussion: C. woodsonii belongs
to costaceae with elliptical green
leaves. Till now are no extensive studies on C. woodsonii. Preliminary phytochemical analysis revealed the
presence of flavonoid, steroid, fat, phenol, tannin and mucilage in leaf
extract. Physicochemical studies further revealed the ash value of leaf as
8.7%. Among the three extractions, alcohol extractive values showed the highest
as 13%. Loss on drying at 105 degree Celsius in leaf was found to be 12.67%.
The plant extract showed total phenolic content of 7.941 mg GAE/g at
concentration of 5µg/ml. As for flavonoids content, plant extract showed 21.7
mg RE/g at concentration of 200µg/ml and 43.4 mg RE/g at concentration of
400µg/ml. For antioxidant activity, the plant extract showed weak antioxidant
activity in DPPH scavenging activity assay. For antimicrobial test, the leaf
extract of C. woodsonii showed weak antimicrobial
activity. Conclusion: From this study, it
can conclude that C. woodsonii leaf
extract possess weak antioxidant activity and weak antimicrobial activity which
need to be further validated by using more antioxidant assays and antimicrobial
tests. Herbal medicines have been utilized
throughout written history, and probably even longer. Archaeological evidence
suggests the use of herbal medicines for various conditions as early as 60,000
years ago [1]. Herbal
medicines
are plant-based medicines which are complex mixture that made from different
combinations of plant parts such as leaves, flowers, stems, fruits or roots.
Each part can have different medicinal uses and the many types of chemical
compounds needed different extraction methods. Both fresh and dried plant
matter are used and it is depending on the herb [2]. The plant that I have
selected for my research project is C.
woodsonii. It is commonly called as Red Button Ginger, Scarlet Spiral Flag,
Red Cane, Panamanian Candle Ginger, Indian Head Ginger, Dwarf French Kiss and
Dwarf Cone Ginger. The synonyms of the botanical name are C. spiralis, Alpinia spiralis
and C. pisonis [3]. In malay, it is known as Setawar
Halia Merah. In chinese, it is known as Hong Bi Qiao Jiang (红闭鞘姜). The classification of C.woodsonii
is as follow [3-5]. Nehete J 2010 studied C. Speciosus in vitro antioxidant activity of different extracts.
It was revealed that benzene extract had the maximum phenolic content 4.38% and
showed good correlation coefficient (r2) for all antioxidant methods
[6]. Khan MM 2019 used the Bulb Extract of C.
woodsonii for Phytogenic
Synthesis
of Band Gap-Narrowed ZnO Nanoparticles. C.
woodsonii was used as a green approach to synthesize zinc oxide (ZnO)
nanoparticles from its bulb (flower). These studies confirmed the synthesis of
ZnO nanoparticles with a lower band gap [7]. Until now there are less research
done on Costus family and there were
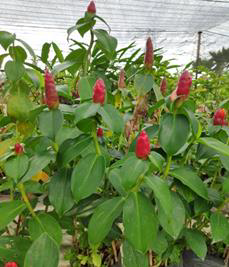
no extensive studies on C. woodsonii. Figure 1: C. woodsonii collected
from Lakeview Horticulture Nursery in Sungai Lalang, Malaysia. A study was conducted to further
discover this plant. The objective of this research was to evaluate the
phytochemical constituents, antioxidant and antimicrobial properties of the plant,
with the aim to discover their medicinal value and standardizing this plant
with its potential benefit. Plant of study which is C. woodsoniiwas collected in 16th October 2018 from Lakeview Plant
Nursery in Bedong, Sungai Petani, Kedah, Malaysia. The leaves of plant were
dried at 45 degree Celsius in hot air oven for 4 days. The leaves were
continued to dry until it was able to crush into small pieces and blended into
fine powder using blender. Then the blended powder was passed through sieve to
get the evenly smaller size fine powder and separated it from the plant fiber
that was unable to be reduced in size. A herbarium voucher specimen of C. woodsonii was prepared and then
submitted to Faculty of Pharmacy of AIMST University, Malaysia. The selected
plant was examined for its size, shape, color, texture, surface and macroscopic
characteristics. In microscopic study, leaf of the selected plant and its
powder were studied for various micro chemical test and microscopically
parameters using standard methods.In physicochemical analysis,
extractive values with different solvents, loss on drying, total ash value,
foreign organic matter, fluorescence analysis and thin layer chromatography was
carried out using the procedures mentioned in reference text. Extraction was
done by using Soxhlet extraction. After extraction, the solvent was removed by
using rotavapour and dried extract was preserved for further studies. Phytochemical
Screening of the plant extract was carried out to detect various phytochemicals
present in plant by following reference methods as cited in pharmacopoeial standards. For the standard stock solution,
gallic acid was used and was prepared in concentration of 1000 µg/ml by
dissolving 10mg of gallic acid in 10 ml of 95% ethanol. Mixing of 95 ml of
absolute ethanol with 5 ml of distilled water produced 95% ethanol. Then serial
dilution was performed from the stock solution. Several dilution of standard
gallic acid was prepared which include 2, 4, 6, 8 and 10µg/ml. The total
phenolic contents of the ethanolic extracts of sample were estimated using the
Folin Ciocalteu reagent. 2.5% sodium bicarbonate was prepared by dissolving
2.5g in 100ml of distilled water. After serial dilution, 0.2ml of prepared Folin-Ciocalteu
reagent and 4ml of sodium carbonate was added according to 0.2ml of stock
solution of various concentrations. The sample was then incubated at room
temperature for 1 hour. The absorbance of each concentration was measured at
750nm using UV
spectrophotometer and subsequent calibration curve was constructed [8]. In order to measure the absorbance
of various concentrations, two sets of blank were prepared by mixing in each
set with 0.2 ml of 95% ethanol and 0.2 ml of Folin-Ciocalteu reagent and 4 ml
of sodium carbonate. These blank was also incubated as same manner as done with
gallic acid. As for the extract sample, stock solution was prepared for a
concentration of 1000 µg/ml similar to gallic acid preparation, which is 10mg
of ethanolic leaves extract were dissolved in 10 ml of 95% ethanol. 3 solutions
were made through serial dilution for concentration of 5, 10 and 20 µg/ml.
Similarly, 0.2ml of Folin-Ciocalteu reagent and 4ml of sodium carbonate was
added to each prepared extract dilution. After preparation, they were incubated
at room temperature for 1 hour. The phenolic content was determined for
ethanolic leaves extract by using the formula, Total Phenolic Content, C = (A/B) x Dilution
Factor. Where C = Expressed as mg GAE/g dry weight
of the extract. A = the equivalent concentration of
gallic acid established from calibration curve (mg). B = Dry weight of the extract
(grams). Rutin was used as standard stock
solution. Initially stock solution was prepared for concentration of 1000 µg/ml
by dissolving 10 µ 10 mg of rutin in 10 ml of 95% ethanol. Serial dilution was
performed from stock solution to form differences concentrations which are 10,
20, 40, 60, 100, 200 and 300 µg/ml. Then, 2% AlCl3 solution was
prepared by dissolving 2 g in 100 ml of ethanol. 0.5 ml of sample from each
dilution was added with 1.5ml of ethanol, 0.1 ml of 10% AlCl3
solution, 0.1 ml 1 M potassium
acetate
solution and 2.8 ml of distilled water and incubated at room temperature for 1
hour accordingly. Meanwhile, stock solution for leaf extract was prepared by
dissolving 10 mg in 10 ml of 95% ethanol to make a concentration of 1000 µg/ml.
It was then diluted to 200 µg/ml and 400 µg/ml respectively. Also, 1.5 ml of
ethanol, 0.1 ml of 10% AlCl3 solution, 0.1 ml 1 M potassium acetate
solution and 2.8ml of distilled water and incubated at room temperature for 1
hour accordingly. In order to measure the absorbance of various concentrations,
two sets of blank were prepared by mixing in each set with 1.5ml of ethanol,
0.1 ml of 10% AlCl3 solution, 0.1 ml 1 M potassium acetate solution
and 2.8 ml of distilled water [9]. The blank was incubated as the same
manner done for rutin and leaf extract. After incubation, absorbance of various
concentrations of rutin stock solution and ethanolic extract was determined at
maximum wavelength of 415 nm. Calibration curve was constructed and flavonoid
content was calculated as follow, Total Flavonoid content, C = (A/B) x
dilution factor Where C = expressed as mg RE/g dry weight of extract. A = the equivalent concentration of
rutin established from the calibration curve (mg). B = dry weight of extract (g). In DPPH assay, Butylated
Hyroxytoluene (BHT) was used as standard stock solution. It was prepared by
dissolving 10ml of BHT in 10 ml of 95% ethanol to make a concentration of 1000
µg/ml. Serial dilution was done from the stock solution to make various
concentration which are 10, 20, 40, 60, 80 and 100 add until 400 µg/ml
respectively. The DPPH scavenging activity of the
ethanolic extracts of samples were estimated using the DPPH reagent. Thus, the
0.1mM DPPH reagents were prepared by dissolving 3.94 mg in 100ml of 95%
ethanol. 3 ml of DPPH reagent prepared was added into 2.5ml of each dilution of
stock solution. Since DPPH reagents are extremely photosensitive, each test
tube was wrapped with aluminum foil after addition of DPPH reagent. In addition
the whole process was carried out in a dark room. The mixture was then well
shaken and allowed to stand for incubation in dark at room temperature for 30
minutes. In order to measure the absorbance of various concentrations, two sets
of blank were prepared by mixing in each set with 2.5 ml of 95% ethanol and 3
ml of DPPH reagent. The blank was incubated as the same manner done for BHT. As
for the extract sample, stock solution was prepared for a concentration of 1000
µg/ml similar to BHT, which is 10mg of ethanolic leaves extract were dissolved
in 10ml of 95% ethanol. Serial dilution was made into various concentrations
which include 20, 40, 60, 80 and 100 µg/ml. Similarly, 3 ml of DPPH reagent was
added to 2.5ml of each prepared ethanolic leaves extract and then test tube was
wrapped with aluminum foil accordingly [10]. The mixture was then well shaken and
allowed to stand for incubation in dark at room temperature for 30 minutes.
Absorbance for both BHT and ethanolic extract was determined and calibration
curve was constructed. Antioxidant activity usually expressed as IC50 which can
be calculated from standard graph plotted. Percentage scavenging activity of ethanolic extract can be calculated as
follow, Percentage scavenging activity =
[(Ac-As)] x 100 Where, Ac = absorbance of control reaction. As = absorbance of extract samples. Agar well diffusion method: In this study, Bacteria strains of Pseudomonas aeruginosa, Escherichia coli, Staphylococcus aureus, Salmonella
typhi, Acinetobacter baumannii, Bacillus pumilusand Micrococcus luteus were cultured using
nutrient agar broth in 6 different universal bottles. The bacterial strains
stored in the universal bottles were left shaking incubator for 24 hours at 37°C
at 180 rpm. The next days, the bacteria strain which has grown in nutrient agar
broth is then cultured into nutrient agar plate. 15% Dimethyl Sulfoxide (DMSO)
solution was prepared by dissolving 15 ml of DMSO in 100ml of sterilized
distilled water. 15% DMSO solution and penicillin was used as a positive
control and an agar plate without culture growth was used as a negative
control. Marker pen was used to label the bottom of the prepared petri dish.
100 µl of bacterial strain (Pseudomonas aeruginosa) was spread onto the surface of
agar by using spreader. 4 different spot corresponding to the label around 6 to
8 mm were punched aseptically by using cork-borer. Each hole was filled with
10.0 mg/ml, 20.0 mg/ml, 40.0 mg/ml, 60.0 mg/ml, 80.0 mg/ml, 100.0 mg/ml, of
extract respectively using 100µl micropipette. The procedure was repeated for
another 5 bacterial strains (Escherichia
coli, Staphylococcus aureus, Salmonella typhi, Acinetobacter baumannii, Bacillus
pumilusand Micrococcus luteus). After that, the agar plates were covered and
subjected to incubate at 37°C for 24 hours. Determination of
antimicrobial activity was determined and zone of inhibition was measured [11]. Minimum Inhibitory Concentration (MIC)
Test Preparation of standard McFarland bacteria culture: 4-5 loops of the bacterial strains
were cultured in each sterile nutrient broth. Incubated the prepared nutrient
broth at 37 degree Celsius for 24 hours. After the incubation, allow the
incubated culture to centrifuge at 3000 rpm for 15 minutes to obtain the cell
mass (pellet). After 15 minutes, the supernatant was discarded and the
resulting cell mass was re-suspended in another new sterile nutrient broth. The
suspension was standardized by ensuring an absorbance reading range is around
0.08-0.1 using a spectrophotometer at 625nm. MIC test: 30 mg of the ethanolic plant extract was dissolved in 3 ml
of 15% DMSO to obtain concentration of 1000 µg/ml. Two fold serial dilutions
were made to get 5 different concentration which was 1000, 500, 250, 125, and
62.5 µg/ml. 0.2ml of extract solution was transferred into a cleaned assay tube
by micropipette and 1.8ml of standard McFarland bacterial culture was then added
into the tube containing extract solution by micropipette. 1ml of the mixture was then
transferred into a second cleaned assay tube already containing 1 ml of
standard McFarland bacteria culture by micropipette to obtain 500 µg/ml. The
steps were repeated until 62.5 µg/ml concentrations were achieved. Each time
transfer, the micropipette tip should be changed. This is to prevent the mixing
of concentration or increase in concentration. The process was repeated for
each bacterial strain and duplicate sets were made. Two positive tubes
containing only the bacterial culture suspension were prepared respectively.
One negative tube containing the sterilized nutrient broth was also prepared.
The tubes were then incubated at 37 degree Celsius for 24 hours. The MIC
activity was observed and determined. After 24 hours incubation, the tube
which showed clear solution was chosen as test sample for each bacterial
strain. The agar plate was labeled with name, Nutrient agar, name of bacteria
and date. 0.1 ml of incubated nutrient broth of selected tube was transferred
onto an agar plate and spread evenly. 0.1ml of each clear solution of bacterial
strain was transferred onto an agar plate and spread evenly. The plate was
incubated at 37 degree Celsius for 24hours. The result was observed [12-15]. Morphology of leaves as follows:
Mature Foliage Color(s): Green, Mature Foliage Texture(s): Smooth,
Glossy/Shiny, Prominent Young Flush Color(s): Green, Young Flush Texture(s):
Smooth, Foliar Type: Simple/Unifoliate, Foliar Arrangement along Stem: Spiral,
Foliar Attachment to Stem: Sessile, Foliar Shape(s): Non-Palm Foliage
(Elliptical), Foliar Venation: Parallel, Foliar Margin: Entire, Foliar Apex/Tip:
Acute Herbarium voucher specimen of Hedyotis hedyotidea was prepared and
submitted to the Herbaria of Faculty of Pharmacy (FOP), AIMST University,
Malaysia. Herbarium voucher specimen accession number AIMST/FOP/41 was assigned
to the specimen. Visualization by using naked eyes and with the help of
magnifying glasses, morphology of the plant was observed. Each and every
external structures of plant leaf were noted in accordance with the reference
of literature reviews. The microscopic features of the leaf were observed with
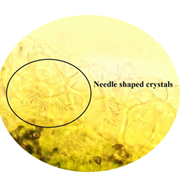
and without staining agents by using Binocular compound microscope. When the leaf was stained with Ruthenium
Red, it showed mucilage containing cells in pinkish red color. When the leaf
stained with 60% sulfuric acid, it showed needle shaped crystals in lamina and
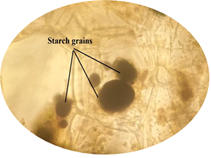
midrib of the leaf. When it stained with dilute iodine, it showed starch grain
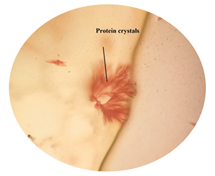
in dark brown color. When it stained with Sudan Red III, it showed red color
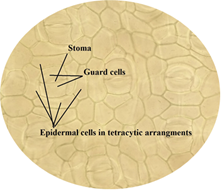
protein crystals. From the observation, the type of stomata was identified to
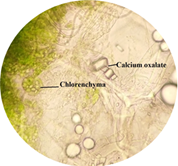
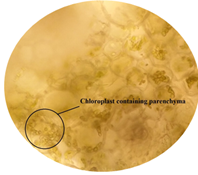
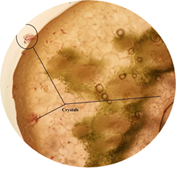
be tetracytic stomata. Microscopic studies showed the presence of many
microscopic cellular structures and pictures of some of the structures are
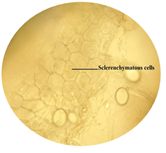
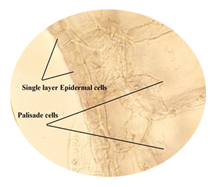
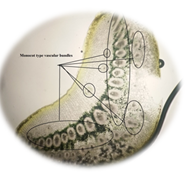
cited below in (Figure 2 to Figure 16). Figure 2: Calcium oxalate and chlorenchyma in lamina of leaf. Figure 3: Sclerenchymatous cells in lamina of leaf. Figure 4: Needle shaped crystals in lamina of leaf. Figure 5: Single layer epidermal cells and palisade cells in lamina
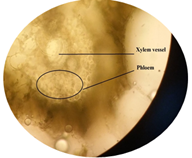
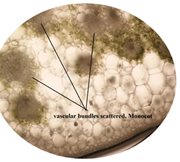
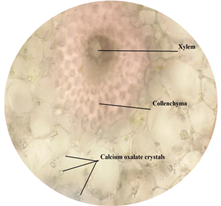
of leaf. Figure 6: Starch grain in lamina of leaf in lamina of leaf. Figure 7: Xylem vessel and phloem in mid rib of leaf. Figure 8: Vascular bundles scattered, monocot type in mid rib of leaf. Figure 9: Chloroplast containing parenchyma in mid rib of leaf. Figure 10: Crystals in mid rib of leaf. Figure 11: Protein crystal crystals in midrib of leaf. Figure 12: Monocot type vascular bundles in petioles of leaf. Figure 13: Xylem, collenchyma and calicum oxalate crystal in petiole
of leaf. Figure 14: Stoma, guard cells and epidermal cells in tetracytic
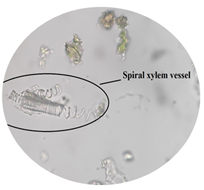
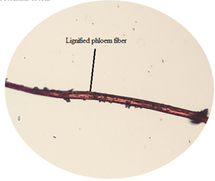
arrangements in stomata of leaf. Figure 15: Spiral xylem in powdered leaf. Figure 16: Lignified phloem fiber in powdered leaf. In this study, alcohol-soluble
extractive value (13%) was found to be the highest among the 3 type of
solvents. This shows that the constituents of the drug are more extracted and
soluble in alcoholic solvent as compared to water, chloroform and petroleum ether as solvent. In
this study, the Loss on drying of leaves of C.
woodsonii was estimated to be 12.67%, which showed that leaves contain
large amount of water content. This might due to the time for the collection of
the leaf of the sample was during morning and the surrounding temperature was
low. The higher the surrounding temperature, the more the amount of water lost
due to evaporation [15]. It was found to that the recommended moisture content
value for powder production using dried leaves is 10% and below [16]. The ash content of the crude drug is
residue remaining after incineration that all the water and organic matter in
the plant cell have been completely removed by heating. Ash commonly contains
inorganic radicals like carbonates, calcium, potassium, magnesium and many
more. After complete burning, ash value obtained for leaves of C. woodsonii was 8.7%. A high ash value
is the indication of consequences contamination, adulteration, substitution or
carelessness in preparing the drug. It was found that the ash value for
individual drug is between the ranges of 4.18% to 14.47% w/w [17]. In this
study, the percentage showed a normal ash value, thus the present of inorganic
matter content in the leaves of plant is within the normal range. From this
study, foreign organic matter was extremely low which was found to be 0.301%. Foreign
matter that present were mostly sand or dust adhere on the surface of the
leaves. The fluorescent studies of dried leaf powder of C. woodsonii with different chemical do not show fluorescence under
UV light with wavelength of 254 µm and 365 µm. phytochemical analysis results
showed the presence of carbohydrates, amino acid, flavonoid, alkaloids, tannins and phenolic
compounds. In Thin Layer Chromatography (TLC)
solvent development, first solvent system was tried was Toluene: Ethyl Acetate:
Formic Acid, TEaF (5:4.5:0.5) and Butanol: Ethanol: Water BEW (5:1:1.1).
However these 2 solvent systems did not show clear separation. Thus referring
to the Phytochemical Methods by J.B Harbone, some other solvent systems were
tried such as Butanol: Acetic Acid: Water, BAW (4:1:0.5) and BEW with different
ratio (3:1:3.3). These two solvent systems have shown some separation of
component under ultraviolet light. After comparison BAW (4:1:0.5) and BEW
(3:1:3.3) were selected. TLC plates were observed under UV light with
wavelength 254 nm and 365 nm. Spots if separations were marked accordingly and
the retention factor (Rf value) was calculated using formula. A
total of 6 components found in C.
woodsonii leaves which Rf values are 0.183, 0.521, 0.583, 0.634,
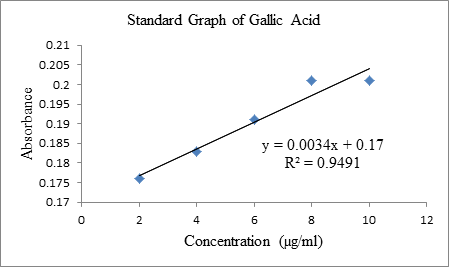
0.761, 0.817. In Total phenolic content (TPC), Standard calibration curve was
plotted with an equation of y = 0.0034x + 0.17, R² = 0.9491. The absorbance of
each concentration of the extract was recorded. It showed that the absorbance
value increase as the concentration (µg/ml) increase. C. woodsonii extract showed total phenolic content of 7.941 mg
GAE/g at concentration of 5 µg/ml. This indicate that leaf contain large amount
of polyphenol content (Graph1). Graph 1: Standard Graph of Gallic Acid. The Total Flavonoids Content (TFC)
can be determined using 2 calorimetric methods, which uses either aluminum
chloride or DNP (2, 4-Dinitrophenylhydrazine). In this study aluminum chloride
was used. The TFC in the leaf extracts using the aluminum chloride was
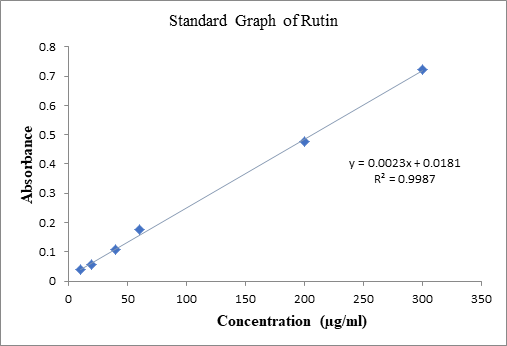
expressed in term of rutin equivalent (mg RE/g). Standard calibration curve was
plotted with an equation of y = 0.0023x+0.0181, R² = 0.9987. It showed that the
absorbance value increases as the concentration (µg/ml) of the plant extract
increase. By comparing the absorbance of the standard rutin absorbance, it was
found that the C. woodsonii showed
total flavonoids content of 21.7 mg RE/g at concentration of 200 µg/ml and 43.4
mg RE/g at concentration of 400µg/ml. This indicated that the leaf extract
contain less amount of flavonoids (Graph
2). Graph 2: Standard Graph of Rutin. In this study, DPPH (2,
2-Diphenyl-1-Picryl-Hydrazyl) was used to determine the antioxidant capacity of leaf
extract. DPPH remain as stable free radical on room temperature and appears as
violet molecule. When undergoes reduction which caused by antioxidant molecule,
it decolorize from deep purple to yellow color [18]. The evaluation of the
antioxidant activity of sample was determined based on the scavenging activity
against the free radical DPPH through the calculation of IC50, which represents
the concentration of the material required for inhibit 50% of the free
radicals. Thus, a lower IC50 value in a particular sample indicates a greater
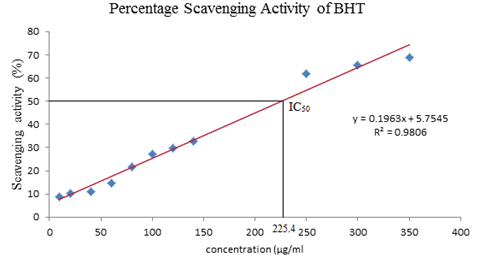
ability to neutralize free radical. In this study, both the BHT standard and
the plant extract were determined at 518nm. Standard calibration curve was
plotted with an equation of y = 0.1963x+5.7545 R² = 0.9806. It showed that the
absorbance decreases as the concentrations (µg/ml) increase. However, the
increase in concentration results in increase of scavenging percentage which
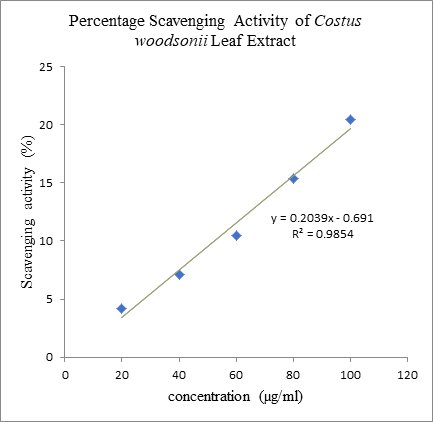
results in the linear graph. The results of IC50 were calculated based on the
standard curve of BHT, the value of standard BHT was 225.4µg/ml. The IC50 value
of standard BHT plant extract was much higher compare to the plant extract as
the scavenging activity for the plant extract on 5000 µg/ml was only 33.75% (Graph 3 and Graph 4). It indicated that
ethanolic extract of C. woodsonii had
very less antioxidant capacity [19]. Graph 3: Percentage scavenging activity of BHT. IC50 of BHT was found to be IC50=225.4
µg/ml Graph 4:
Percentage scavenging activity of C.
woodsonii leaf extract. In
Antimicrobial Test, there was no zone of inhibition for Escherichia coli and Staphylococcus
aureus. Most probably this is because of the minimum inhibition
concentration of leaf extract of C.
woodsonii for Escherichia
coli and Staphylococcus
aureus was higher or it does not shown antimicrobial activity to
Escherichia coli and Staphylococcus
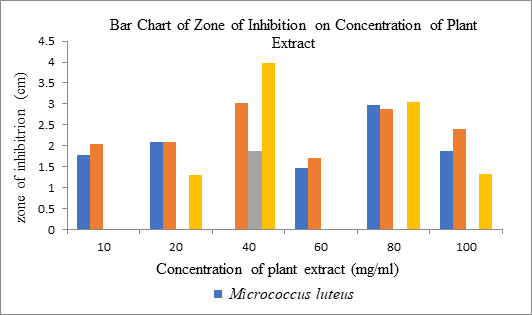
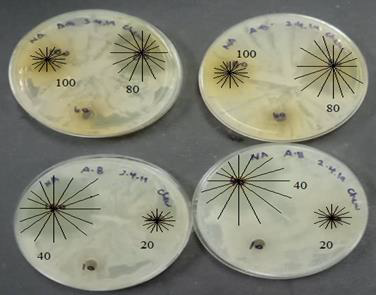
aureus. The ethanolic extraction of C.
woodsonii with the concentration of 80mg/ml showed the largest zone of
inhibition (3.98 cm) among other 5 concentration (10, 20, 40, 60 and 100 mg/ml)
on Acinetobacter baumannii.
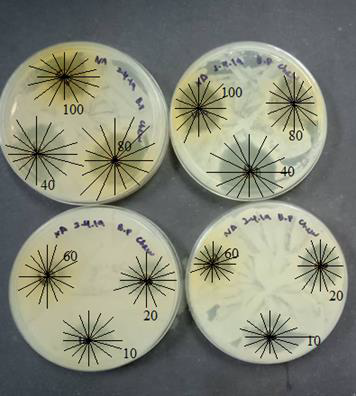
For Bacillus pumilus, 40mg/ml of the ethanolic extraction of C. woodsonii showed the largest zone of
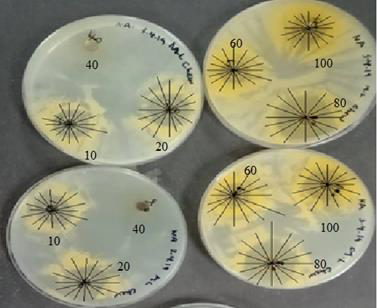
inhibition (3.02 cm) among other 5 concentration. For Micrococcus luteus,
80mg/ml showed the largest zone of inhibition (2.98 cm) among the other 5
concentrations. The
zone of inhibition should increase as the concentration of plant extract
increase. The factors that cause these might be the difference in amounts of
microorganism presence in the nutrient agar plates as the volume of each
inoculations of bacteria were not standardised. If the inoculation of the
bacteria is too much, it required more extract to inhibit the growth of the
bacteria. In the other way, the ethanolic extraction of C. woodsonii had larger zone of inhibition at lower concentration
of extract for Acinetobacter baumannii,
Bacillus pumilus
and Micrococcus luteus. This might
due to lesser amount of bacteria inoculated on that particular plate so lower
concentration and lesser amount of extract is required to inhibit the growth of
the bacteria, thus showing larger zone of inhibition at lower concentration of
extract used. Repetition and further investigation is required to determine the
error and the causes. For Salmonella typhi, only 40mg/ml of the ethanolic
extraction of C. woodsonii showed the
zone of inhibition (1.88 cm) among other 5 concentration. The absent of zone of
inhibition for other 4 concentration may due to contamination of the extract
solution for those 4 concentration (10, 20, 60, 80 and 100 mg/ml). Another
reason might be inadequate amount of extract added to the well of the agar
plate. 10 µg/ml penicillin and 15% DMSO were used as the positive control for
each type of bacteria test and a nutrient agar plate without culture of
bacteria was used a negative. The penicillin showed no zone of inhibition on Micrococcus luteus, this may cause by
the improper diffusion of penicillin or insufficient amount of penicillin added
into the well of the agar plate (Figure
17 to figure 20). By comparing the zone of inhibitions for each
concentrations of plant extract on the 4 bacteria species, the plant extract
showed weak antimicrobial
activity. Repetition of the test or further
investigation should be carried out for the validation of the results. Figure 17: Bar Chart of Zone of Inhibition on Concentration of C. woodsonii. Figure 18: Zone of inhibition on Micrococcus
luteus. Figure 19: Zone of inhibition on Bacillus
pumilus. Figure 20: Zone of inhibition of Acinetobacter
baumannii. In Minimum Inhibitory Concentration (MIC) Test, Based on the result shown, there
was no significant of MIC in the test. So MBC Test was not carried out. The
absence of MIC might due the contamination of nutrient broth or contamination
during any process of MIC or the MIC for ethanolic extract of leaf of C. woodsonii is higher than 1000 µg/ml.
Repetition and further investigation are required for the validation of the
results. C. woodsonii was chosen for this study as there was no research done on it
before. Soxhlet extraction method was used for the extraction of leaf of Costus
woodsonii. All standardization parameter of leaf of the plant were done
according to pharmacopoeia standards. The results of these parameters were
found within the limits. The phytochemical analysis of C. woodsonii revealed the presence of carbohydrate, amino acids, fat and oils,
flavonoids, alkaloids and phenolic compounds. Besides, antioxidant activity
studies such as DPPH radical scavenging activity were carried out for the leaf
extract. Based on the results, it can be concluded that ethanolic leaf extract
of C. woodsonii possess weak
antioxidant activity and thereby required validation by more antioxidant
assays. Antimicrobial test such as Well Diffusion Test and MIC Test were
carried out and the result showed that ethanolic extract of leaf of C. woodsonii has weak antimicrobial
activity and need more antimicrobial test for the validation of the result.
Furthermore, C. woodsonii required
more extensive studies such as pharmacological activities as it might have
other potential which have not been explored yet. 1.
Herbal Medicine - an overview. 2.
What
is Herbal Medicine?-The National Institute of Medical Herbalists. 3.
C.
woodsonii (Red Button Ginger) with exotic
torpedo-shaped blooms. 4.
My Tropical Plants Finder: Costus woodsonii. 5.
Flora Fauna Web - Plant Detail - C. woodsonii Maas. 6.
Nehete J, Bhatia M and Narkhede M. In-vitro Evaluation of
Antioxidant Activity and Phenolic Content of Costus speciosus (Koen) J.E. Sm (2010) Iran J Pharm Res9:
271-277. 7.
Khan MM, Saadah NH, Khan ME, Harunsani MH, Tan AL, et al.
Phytogenic Synthesis of Band Gap-Narrowed ZnO Nanoparticles Using the Bulb
Extract of C. woodsonii (2019)
Bionanoscience 9: 334-344. https://doi.org/10.1007/s12668-019-00616-0 8.
Ainsworth EA and Gillespie KM. Estimation of total phenolic
content and other oxidation substrates in plant tissues using Folin-Ciocalteu
reagent (2007) Nat Protoc 2: 875-877. https://doi.org/10.1038/nprot.2007.102 9.
Sen S, De B, Devanna N and Chakraborty R. Total phenolic,
total flavonoid content, and antioxidant capacity of the leaves of Meyna
spinosa Roxb., an Indian medicinal plant (2013) Chin J Nat Med 11: 149-157. https://doi.org/10.3724/
sp.j.1009.2013.00149 10. Mishra K, Ojha H and Chaudhury NK.
Estimation of antiradical properties of antioxidants using DPPH assay: A
critical review and results (2012) Food Chem 130: 1036-1043. https://doi.org/10.1016/j.foodchem.2011.07.127 11. Balouiri M, Sadiki M and Ibnsouda KS.
Methods for invitro evaluating
antimicrobial activity: A review (2016) J Pharma Analy 6: 71-79. https://doi.org/10.1016/j.jpha.2015.11.005 12. Chandel HS, Pathak AK and Tailang M.
Standardization of some herbal antidiabetic drugs in polyherbal formulation
(2011) Pharmacognosy res 3: 49-56. https://doi.org/10.4103/0974-8490.79116.
13. Han C, Liu Y, Yang Y, Ni X, Lu J, et
al. Study on fluorescence spectra of molecular association of acetic acid-water
(2009) Chinese Optics Letters 7: 357-360. https://doi.org/
10.3788/col20090704.0357 14. Piluzza G and Bullitta S.
Correlations between phenolic content and antioxidant properties in twenty-four
plant species of traditional ethnoveterinary use in the Mediterranean area
(2011) Pharmaceutical Biology 49: 240-247. https://doi.org/
10.3109/13880209.2010.501083 16. Raja KS, Taip FS, Azmi MMZ and
Shishir MRI. Effect of pre-treatment and different drying methods on the
physicochemical properties of Carica papaya L. leaf powder (2019) J Saudi Soc
Agric Sci 18: 150-156. https://doi.org/10.1016/j.jssas.2017.04.001 17. Pekal A and Pyrzynska K. Evaluation
of Aluminum Complexation Reaction for Flavonoid Content Assay (2014) Food Anal
Methods 7:1776-1782. https://doi.org/10.
1007/s12161-014-9814-x 18. Tirzitis G and Bartosz G.
Determination of antiradical and antioxidant activity: basic principles and new
insights (2010) Acta Biochim Pol 57: 139-142. 19.
Gupta M, Karmakar N and Sasmal S. In Vitro Antioxidant
Activity of Aqueous and Alcoholic Extracts of Polyherbal Formulation Consisting
of Ficus glomerata Roxb and Symplocos racemosa Roxb Stem Bark Assessed in Free
Radical Scavenging Assays (2017) Int J Pharmacogn Phytochem Res 9: 181-189.
https://doi.org/10.25258/
phyto.v9i2.8060 Sikarwar MS, Associate
Professor, Pharmaceutical Chemistry Unit, Faculty of Pharmacy, AIMST
University, Bedong, Malaysia, Email: mukeshsikarwar@gmail.com Costus
woodsonii, Antioxidant activity and Antimicrobial
activity.Pharmacognostical, Phytochemical, Antioxidant and Antimicrobial Activity of Costus woodsonii
Abstract
Full-Text
Introduction
Materials and Methods
Total Phenolic Content
Total Flavonoid Content
DPPH (1,1-Diphenyl-2-Picryl Hydrazyl)
Radical Scavenging Assay
Antimicrobial Study
Minimum Bactericidal Concentration
(MBC) Test
Results and Discussion
Conclusion
References
*Corresponding author
Citation
Sikarwar MS, Szeek CK
and Paliwal N. Pharmacognostical, phytochemical, antioxidant and antimicrobial activity
of C. woodsonii (2019) Edelweiss Appli Sci Tech 3: 53-59. Keywords
