Review Article :
Howard Moskowitz, Attila Gere, Yeshaya Danny Moskowitz,
Robert Sherman, Yehoshua Deitel,
Divya Nagarajan and Petraq
Papajorgji This paper introduces a new approach to understanding the mind of the customer with the goal of optimizing the supply chain by creating, marketing and then delivering what the customer(s) want. The underlying notion is that for every product one can discover groups of people with defined preferences for the product and defined messages which drive expected purchase. The approach divides into two parts, knowledge development through Mind Genomics experiments and mind-set sequencing through the PVI (Personal Viewpoint Identifier). The paper shows data for six flavored beverages, the creation of mind-sets and the creation of the PVI to drive the messaging and thus purchase of each product. The paper finishes with the prospects for the world of product design and marketing when one can rapidly discover these product-specific mind-sets and the messages which excite each mind-set. One could fill book after book with
what we know about consumer preferences, ranging from simple tests of acceptance
for specific products, to patterns of preferences for lifestyles [1-3]. The knowledge
for such books emerges from business focus on a specific product, all the way to
grand strategies for general marketing efforts and to the academic investigation
of what consumers find interesting [4]. A great deal has been written about what
consumers want, their preferences and even aspects of what we might call cognitive
economics [5,6]. Most of these segmentation schemes
work from the top down, dealing either with whom the respondent IS, the pattern
of what the respondent does or how the response answers a detailed questionnaire
about general attitudes towards many topics. There is little in the way of a bottom-up
approach, with actionable knowledge emerging from specific topics, such knowledge
then integrated into a larger structure of general knowledge. Or, if there is integrated
knowledge basis going from the granular to the general, the knowledge base has not
been shared with the general public. The lure of knowledge to provide a competitive
advantage is increasing, year by year, with the massive increase in the ability
to collect data (e.g., the internet of things, the shopping baskets, the purchase
patterns of people), the decrease in cost to store and retrieve information about
purchases and the exploding power of data analytics which correlate
the data with publicly available information about a person. The temptation is to
rely increasingly on data science, on so-called business analytics, with the rationale
that the answer must be in there. In the world of foods, we see an increasing number
of supermarket chains making use of the information to understand trends in food.
What took months with Nielsen audits now takes minutes. The question, however, is
how to move from these lakes of data, masses of information in which one hopes the
treasures of knowledge swim, into an actionable world of business decisions. It
is no longer acceptable or even reasonable to wait months to analyze data, in the
hopes of finding something which may allow a competitive advantage, no matter how
temporary. Recent advances in computer technology,
modeling, artificial
intelligence and data acquisition by the grocery trade promises a new age for understanding
the consumer. The new era of knowledge about the consumer can be described as from
the outside in. That is the newly emerging technology can track what the supermarket
customer looks at and what they buy [7-9]. When the shopping occurs on-line, it
is easy to measure the response of the customer by what the customer chooses in
the path, i.e., the click and note exceptions to typical behaviors [10]. Furthermore, the customers previous
behavior may be analyzed to suggest the next items to be purchased [11]. These advances
promise a new era of understanding the shopper first to the usually small group
of early adopters who try new technologies and then later to the world of the supermarkets
themselves, who take comfort in seeing others do the experimentation [12]. What
is missing from all these efforts, these technological breakthroughs, is foundational
knowledge about the mind of the customer. That is, the analyses can track eye movements,
record market basket contents, measure clicks and by so doing get a sense of what
is actually happening and what external, measurable factors co-vary with each other.
But the failure is the lack of knowledge about the mind. The measures are similar
to the efforts of Skinner, starting almost 80 years ago, at Harvard University and
John B. Watsons efforts years before that. These Behaviorists in the world of psychology
ignored the mind of the person (or animal), measured regularities in behavior and
deduced what might be happening. They would not and could not understand the mind,
relegating themselves as they did to observing externalities and hypothesizing. Of course,
the animals with which they worked could not be interviewed to report what they
were thinking. As the grocery trade moves towards
accepting new technologies in the increasingly competitive space of food sales,
it is important to move towards a greater discipline in the knowledge we obtain
and use. The knowledge-building efforts should create a competitive advantage for
the current scenario and for new scenarios evolving through technology, through
changes in product design, through changes in the competitive frame and most important, through the ever-present change
in patterns of consumer preferences. What is a competitive advantage today in technology
may become simply yesterdays news as competitors leapfrog one another at a pace
which accelerates week-by-week. It no longer suffices to remain within ones comfort
zone with the reassuring but deadly platitude which served so often in the past,
namely people always have to eat. During the past decades, a new science
has emerged to help the supply chain. The science is known as Mind Genomics. The
underlying notion of Mind Genomics is that each person experiences daily life as
a series of small experiences, reacting to different aspects of those experiences.
When we map out those experiences, whether behavioral situations or information
(messages) we discover regular or systematic individual-differences among people.
The result is a structured science to approach the mind of people confronting the
every day. The contribution of the Mind Genomics effort is a tool by which to increase
the effectiveness of business communications by putting consumer mental demand into
the supply chain as a key driver of upstream activities. The thesis of this paper is that the
supply chain may profitably begin with a deeper understanding of the last step,
the person who buys the product and consumes it, whether the consumption be preparing
it, eating it, or feeding to another. When we know that final step in depth, there
is the possibility of a new form of supply chain optimization – reaching
from the end of the chain, the customer/consumer, to the start of the chain, the
production and even to the product design and product planning. The problem is simple,
one faced by every food manufacturer on the one hand, or the food wholesaler/retailer
on the other. We illustrate the problem and Mind Genomics solution by a typical
case history. The topic is the creation and selling of a new set of flavored beverages
by a company which wishes to take advantage of the increasing penchant of consumers
to explore the sensory characteristics of beverages beyond the initial limited array
of flavors available only decades ago. The veritable explosion of flavors, so well
documented by popular science writer Malcolm Gladwell in his TED Talk, Choice, Happiness
and Spaghetti Sauce, has led to a public, searching for new
experiences a lot of the time which explores sensory experience, choosing new ones
all the time [13]. Indeed, rather than a limited array of less than optimal alternatives
today we have what has been called the Paradox of Choice, wherein so many SKUs,
shop-keeping units, are launched in order to gain shelf space. All too-often the
pell-mell introduction of flavors backfires [14]. Let us look at how a company might
approach marketing the above-mentioned flavored beverages, spanning the range of
beer, cider, tequila, low alcohol beverage, hot coffee and ice coffee, respectively.
The objective is with knowledge of the consumer, not yet developed, to message correctly
and most important, drive the right message to the right person. We assume that
the products have already been developed. The formal problem is simple to state.
We are considering the customer as a destination into which we put a product. We
treat the customer as possessing a set of sensitivities toward each product, whether
or not the customer is involved with the product. The sensitivities are to specific
messages which attract the customer to the product or push the customer away from
the product. Our objective to move the product to this receptacle, with the assumption
that once the product reaches the consumer it will be consumed and thus the product
journey will end. Most marketers and product developers would react in disbelief
to the statement. It is as if we are treating the consumer as something whose dynamics
are known, a simple but final conduit to our set of products. So much of marketing
is a deep discussion of what consumers want, when they want it and the dynamics
of competition that we seem to reduce the very humanness of a consumer to a set
of factors to be determined and then expect the optimum to occur the product to
be accepted. How can the depth of the customer experience be captured by a series
of messages, much less messages which are determined through science, experimental
design and simple experiments? Most optimization efforts assume the
real problem in optimization is to identify WHAT to do. Here, with consumers, we
may not even know either what to do or what to say. What are the features of the
product which the consumer wants? When we solve that, what should the marketer say
about the product to convince the buyer? This part of the supply chain, the ultimate
buyer, has a mind of its own. The consumer can simply say NO. It is the emerging
science of Mind Genomics to which we now turn. We assume zero knowledge for marketing,
rather than assuming the marketer or advertising agency knows the single best message
to drive purchase. One way to identify messages which work consists of mixing and
matching message, present these mixtures to the person, get the reaction and determine
which particular messages in the mix are responsible for the YES, the answer by
prospective customers that, YES, I want that product. Mind Genomics refers to a young science,
about 30+ years by now, at the time of this writing (fall, 2019). Mind Genomics
emerged from the efforts of experimental psychologists and marketing academics to
understand the way people made decisions, moving beyond simply asking the people
to describe their criteria, not always easy and often not at all possible. Rather
than asking a person to reflect on HOW and WHY a specific decision is arrived at,
Mind Genomics implements
small experiments, on the computer to establish a causal relation. The respondent
reads different vignettes or sets of messages, about a product or service and rates
the vignette on some type of simple anchored scale, the Likert scale [15,16]. The
analysis reveals what features of the vignette drive the decision, reveals new groups
(mind-sets) and shows how to discover those mind-sets among new people who had not
participated in the study. The test materials of Mind Genomics phrases, known as
elements or messages, are mixed according to experimental design to create a set
of prescribed combinations. The same element appears several times
in combination with other of elements. After reading each individual combination
the respondent integrates all the information in the vignette and assigns a single
rating. The process is quick, lasting often only 1-2 seconds. Regression analysis
deconstructs the individual contributions of each element, respectively, creating
an additive model. The coefficients of the model or equation are the part-worth
contribution, interpreted as the importance of each element to the respondent. Typically,
the respondent is not even aware of his or her individual weighting scheme, but
generally the data make intuitive sense to the respondent when the respondent is
shown the coefficients of the one-person model emerging from his or her own ratings.
One feature of Mind Genomics worthy of special mention is the attention given to
ease of set-up, speed of data acquisition and rapidity of analysis and reporting,
all facilitated by todays (2019) technology, Smartphones and a simple app called
BimiLeap (www.BimiLeap.com).
The app leads the respondent through the sequence of ideation, study setup and moves
to respondent acquisition through a link and associated sample providers for respondents.
The app finishes with an automatic analysis done with 2-3 minutes of the end of
the study. The output is a Microsoft Powerpoint® report of the results in a formatted
template, ready for immediate use and publication. We now move to the experiment which
provides the necessary data. The data from this study were collected more than ten
years before, funded by the Wild Corporation, a flavor supplier, under the name
Drink It! We report the data, show the results and then show the PVI for the six
products and representative mind-set membership data for two respondents on each
of the six flavored beverages after the two respondents each used the PVI. Step
1-Define the topic and select the beverages: The topic
is what drives interest in buying a beverage for consumption. The original study
(Drink It!) funded by Wild Flavors and focused on 30 beverages, with a goal to understand
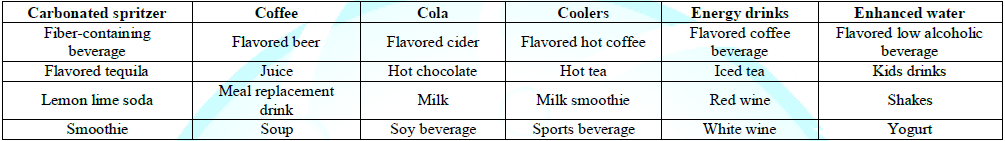
the broad spectrum of drivers of interest in the beverage category. (Table 1) shows the beverages. The six flavored
beverages are those chosen to demonstrate the creation
of the six-beverage PVI and its deployment. They are shown in the shaded cells. Table
1: The 30 beverages tested in the Drink It! Project. (Courtesy
of It! Ventures, Inc.) Step 2-Develop the
structure of messages that will be used to identify what to say: The structure of the
It! Studies was set up to investigate four questions, and nine answers to each question.
(Table 2) shows an example of these elements
for one product, juice spritzer. Step 3-Run relatively
small-scale studies and extract mind-sets from each study: The actual Mind Genomics
process is straightforward. A basic experimental design is developed so that each
of the 36 elements or answers appears an equal number of times, in this case five
times. The experimental design for this specific array of questions and answers
(4x9) generates 60 combinations or vignettes, each vignette comprising 2-4 elements
or answers, at most one answer from a question in each vignette. That is, the vignettes
are not always complete, since some vignettes comprise three elements and other
vignettes comprise two
elements. The experimental design ensures that all 36 elements are statistically
independent of each other, allowing for regression analysis to relate the presence/absence
of each of the 36 elements to the rating. The incompleteness of the design further
ensures that statistical independence, so that the coefficients from the regression
model (explained below) have ratio-scale properties. The underlying experimental
design produces 60 combinations, tested by a single respondent. The next respondent
receives vignettes, the combinations, created by the same experimental design, but
for this new respondent the combinations are changed. The strategy called permuted
experimental design ensures that the experiment tests many, if not most of the possible
combinations that can be created [17]. The strategy of Mind Genomics thus differs
from the strategy of other studies using experimental design. Mind Genomics permutes
the combinations. The knowledge about how people respond comes from a wide range
of different test vignettes, i.e., a fuller picture not from a limited number of
test vignettes evaluated by many people, i.e., a less noisy but far more incomplete
picture. Step 5-Create mind-sets
by clustering: The
mind-sets for a beverage are simply those people whose patterns of responses to
the 36 elements for a beverage are similar. We can think of these mind-sets as mental
primaries for the beverage, primaries which emerge when we have a reasonable number
of respondents participating. The approaches to developing these primaries have
been described in detail elsewhere [18]. We need only keep in mind that to discover
these primaries we apply the well-accepted statistical procedure of clustering to
the respondents in each study, dividing the respondents into homogeneous groups, based
upon the pattern of their 36 coefficients for that beverage. Clustering is a well-accepted
statistical method which creates groups of objects (people), based upon a definition
of distance, specifically distance between two profiles of coefficients k1
- k36. Clustering is the general name given to a set of statistical procedures
which divide objects, our respondents, into groups with the property that the patterns
of the 36 coefficients are similar to each other within a cluster and the pattern
created by the average of all respondents to create 36 average coefficients are
very different from cluster to cluster [19]. In the language of Mind Genomics, the
clusters are mind-sets (Table 3) shows
the six sets of coefficients for three mindsets, one set for each flavored beverage.
For each study we pulled out three mind-sets, shown in columns labelled MS1, MS2,
and MS3, respectively. We sort each table, first by MS1, then by MS2, then by MS3,
respectively. All coefficients of 9 and above are shaded. It is clear from Table
3 that the mind-sets differ and can be interpreted by looking at the coefficients
that are darkened. For table 3 please go through the below link Step 6-For each beverage;
create a PVI (Personal Viewpoint Identifier): The objective is to assign a new person
to the appropriate mind-set, for each beverage. Up to now, we have looked at the
respondents who participated in each study in terms of who they say they ARE (e.g.,
age, gender product usage and so forth). The discovery of mind-sets produces a new
way to define who a person is, namely the pattern of elements to which the person
responds, i.e., the mind-set. The only problem is that people cannot easily tell
an interviewer who they are in terms of the mind-set with respect to a product.
They may know, but most likely they have never even thought of mind-sets with respect
to the product. It becomes vital to create a simple tool, a PVI, which can quickly
assign a NEW person to one of the two or three mind-sets for a specific beverage,
these mind-sets empirically uncovered in a Mind Genomics experiment. A
variety of statistical tools have been developed to assign objects to predefined
groups. These tools use the property of the objects along a vector of different
variables to create a classification tool. The tool weights the individual variables
and combines them. The result is then a number or set of numbers which map to one
of the clusters, defined as the most appropriate cluster for the pattern of responses.
The tools require the raw data and statistical back testing. The most common of
these is known as DFA, discriminant function analysis [20]. Often, however, we only
have the summary data, such as the profiles in Table 3. Authors Gere and Moskowitz
have developed an algorithm which uses Monte Carlo simulations
and response patterns to assign a new individual to one of the mind-sets or cluster.
The tool, PVI, allows presents the respondent with six questions taken from the
most discriminating elements from the study. The questions are selected after a
Monte Carlo simulation of 20,000 data sets, based upon the original data, but perturbed
with noise. The
outcome is a set of six questions, each answered by the same two answers, appropriate
for the product. The six questions generate 64 possible patterns. Each of the 64
possible patterns maps to one of two mind-sets, or where appropriate, one of three
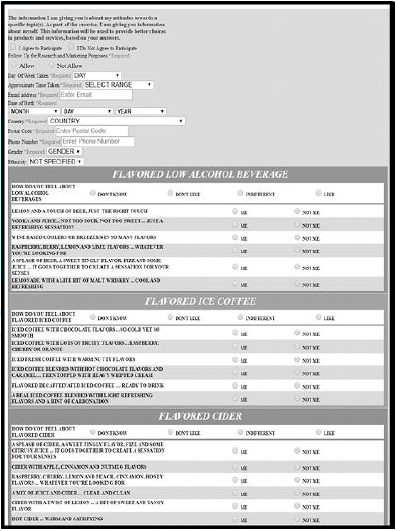
mind-sets. Figure 1 shows part of the
PVI for this study. Figure 1 show three of the six sets of questions The PVI begins
with requisite information about the respondent and two opt-ins. The full PVI continues
with six sets of questions, one set for each study. The PVI varies the order of
studies across participants and the order of questions within a study. In this way
the PVI attempts to minimize order bias. The PVI takes about 30-45 seconds for the
up-front basic information and about 15-20 seconds for each product. The full set
of six products thus takes about 2-3 minutes. As in all on-line studies, it is best
to offer an incentive to the respondent to participate. Otherwise, the process to
obtain many respondents can take days or weeks, rather than minutes and hours. The
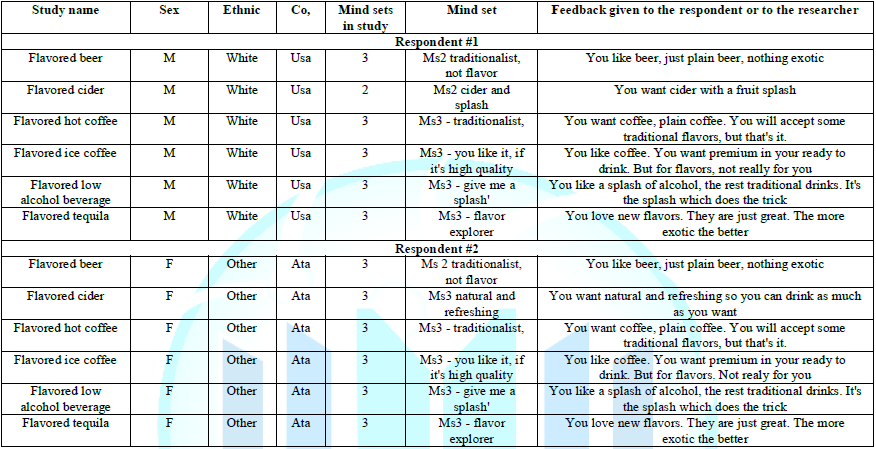
PVI returns with six records for each respondent, one record for each product and
each respondent, as shown in (Table 4).
The PVI data is laid out in the form of a flat file, with the relevant information
about each respondent and each product as a separate record. Each respondent generates
six records. The flat file allows individual analyses of each product, as well as
subsequent creation of a master record for each respondent. The PVI has no place
for the respondent name. The respondent is identified by name or home address. The
respondent is completely informed about the data being collected. The respondent
can opt-out entirely, or opt-in but request no further contact. Every effort is
made to adhere to the current privacy rules [21]. The
vision of the PVI is not simply a set of typing tools, allowing the consumer researcher
to assign a given individual to a set of different mind-sets, based upon the pattern
of ratings. Such a limited vision would constrain the use of the PVI to marketing
efforts. The
reality is that the combination of Mind Genomics with the PVI offers dramatic advances
for our understanding of the human mind. Beyond this understanding is the looming
an enticing prospect of correlating the mind of people (pattern of mind-sets) with
other behaviors and even with physiological features such as genes. It is worthwhile
exploring the potential in a bit of detail. We begin with the precursor of the PVI,
BimiLeap and a do-it-yourself technology to understand the mind of people. The
data reported above come from a precursor of BimiLeap, a technology known as Idea
Map. BimiLeap is an accelerated, simplified, inexpensive and far more rapid tool,
which can be set up, deployed and full results obtained in a matter of a few hours.
Todays BimiLeap technology has been optimized for four questions, each with four
answers rather than nine answers, in the interest of speed, cost and ease. The BimiLeap
project follows a series of simple steps, paralleling the approach but in a do-it-yourself
format. The study for a single topic (e.g., any topic) begins with the statement
of the topic, the creation of four questions and four answers to each question.
The BimiLeap program makes it easy to set up the study on a smartphone or on a computer
or laptop. The
program then requires the researcher to write an introduction to the respondent
about what is expected and provide a rating scale. Finally, the researcher selects
the target population, pays by credit card, the study is launched and each respondent
who participates evaluates 24 unique combinations. The analysis is the same as presented
here, with the addition of modeling both for the rating and for the response time
between the presentation of the stimulus and the rating assigned. The results are
returned in 1-2 minutes after the end of the fieldwork. The results, sent by email,
comprise templated, pre-formatted Microsoft PowerPoint® presentation with the data
incorporated and the tables and raw data in an accompanying Microsoft Excel® file. The
speed of the set-up and data acquisition, often within a few hours for a single
study, make it possible for the researcher to deeply investigate an entire vertical,
comprising 2-20 or more topics, related to each other, either in terms of alternatives
(e.g., types of products in a supermarket), or in terms of what researchers call
The journey (e.g., sequence of activities in ones from entering a hospital to discharge,
from entering school on the first day to leaving school on the last day). Each study
may require as few as 100 respondents and can be completed within the aforementioned
2-4 hour time span. The
final activity, creating the PVI for the 2-20 topics in a vertical, takes 3-4 hours,
launching the PVI takes five minutes. Deployment a matter of distributing the PVI
to the correct individuals who will participate. What
then does this capability of Mind Genomics +PVI mean for science and for application? · At the very simplest
level, the above-mentioned process produces an integrated library of data for a
vertical, with the information archived, relatable to each other in terms of metrics.
· The next level comprises
the analysis of alternative populations by the PVI to understand the distribution
of mind-sets under different situations, whether these situations be geography,
culture, health versus disease, economics and so forth.
The sheer simplicity of implementing the PVI with todays communications makes it
reasonable to obtain millions, tens of millions, or even hundreds of millions of
respondent. The consequence is a rich database of the mind of people, at one time,
with the ability to identify the covariation of mind-sets with exogenous factors
(age, gender, market, behavior) across many different, related topics, in the vertical.
In other words, for food, the mind-set of 100 million people versus who they are
and versus what they purchase. · At an even deeper
level, with services specializing in genetic typing, there may be a way to relate
genetic profiles of people to mental profiles obtained from the PVI and the two
of them to behavior. The PVI is the missing piece, as is the need to scale up the
data acquisition to millions. It is the PVI, the operational structure of the mind
in terms of RELEVANT topics which is the linchpin, holding both
sides together, the measured genetic profile and the behavioral and social profile. Attila Gere thanks the support of the Premium
Postdoctoral Research Program of the Hungarian Academy of Sciences. The authors
acknowledge the original assistance of Dr. Hamid Faridi and Ms Marianne Gillette
of the McCormick and Company, for their early support of the It! Studies. The authors
acknowledge the early support of the Wild Flavors Company, for the funds and encouragement
to conduct the Drink It! Study, from which the data in this paper were extracted.
The authors acknowledge the early support of Ms Hollis Ashman and Ms Jacqueline
Beckley (The U&I Group, Inc.) for the early analyses of the Drink It! Data.
The authors thank Dr. Philip Perkins for his ongoing moral support of the entire
It! Effort. We
have focused this paper on the supply chain for food because the original challenge
of the PVI and the BimiLeap technologies were posed to the authors by the manufacturers
of food as far back as 2001. The original request was made to author Howard Moskowitz
by the Dr. Hamid Faridi and Ms. Marianne Gillette of the McCormick Company, to use
Mind Genomics to identify the patterns of product features driving acceptance in
a set of 30 products. In 2008 Howard Moskowitz was requested by Dr. Philip Perkins
of Bush Brothers Inc., to use the same technology to understand the entire range
of foods in a store, in order to drive increased purchase through targeted messaging.
It would take several years for the PVI to be developed, finding preliminary use
in foods, but then enjoying a modest but growing demand in the finance industry,
the insurance industry and finally the hospital business with its relentless focus
on patient satisfaction and patient compliance. 1.
Brower
M. Claritas (formerly Nielsen) Segmentation and Market Solutions (2017) Charleston
Advisor 18: 15-20. https://doi.org/10.5260/chara.18.4.15 2.
Weinstein
A and Cahill DJ. Lifestyle Market Segmentation (2014) CRC press, United States. 3.
Wells
WD. LifeStyle and Psychographics (2011) Marketing Classics Press, USA. 5.
Kahneman
D and Egan P. Thinking, Fast and Slow (2011) Farrar, Straus and Giroux, United States. 6.
Moskowitz HR and Gofman A. Selling Blue Elephants: How
to Make Great Products that People Want Before They Even Know They Want Them (2007)
Pearson Education. https://doi.org/10.1111/j.1540-5885.2008.00327_3.x 7.
Cowburn
G. The Front of Pack Nutrition Information Panel: Using Novel Methods to Explore
Consumer Decision Making at Point of Choice during Routine Supermarket Shopping
(2016) PhD Dissertation, University of Oxford, UK. 8.
Turow
J. The aisles Have Eyes: How Retailers Track Your Shopping, Strip Your Privacy and
Define Your Power (2017) Yale University Press, United States. 9.
Sigurdsson
V, Larsen NM and Fagerstrøm A. Behavior Analysis of In-Store Consumer Behavior (2016)
Routledge Comp Cons Beh Anal 40-50. 10.
Huyghe E, Verstraeten J, Geuens M and Van Kerckhove A.
Clicks as a Healthy Alternative to Grocery Shopping Reduces Vice Purchases (2017)
J Marketing Res 54: 61-74. https://doi.org/10.1509/jmr.14.0490 11.
Londono
JC and Castano R. Supermarket suggested shopping lists (SSSL), Promotions and Grocery
Purchases (2017) Int Rev Ret Distri Cons Res 27: 146-163. https://doi.org/10.1080/09593969.2017.1288650 12.
Faulds
DJ, Mangold WG, Raju PS and Valsalan S. The Mobile Shopping Revolution: Redefining
the Consumer Decision Process (2018) Business Horizons 61: 323-338. https://doi.org/10.1016/j.bushor.2017.11.012 13.
Gladwell M (2004)
Ted Talks. 14.
Schwartz
B. The Paradox of Choice: Why More Is Less (2004) Harper Perennial, United States. 15.
Green PE and Srinivasan V. Conjoint Analysis in Marketing:
New Developments with Implications for Research and Practice (1990) J Marketing
54: 3-19. https://doi.org/10.1177/002224299005400402 16.
Moskowitz
HR, Gofman A, Beckley J and Ashman H. Founding a New Science: Mind Genomics (2006)
J Sen Stu 21: 266-307. https://doi.org/10.1111/j.1745-459x.2004.00066.x 17.
Gofman
A and Moskowitz H. Isomorphic Permuted Experimental designs and their application
in Conjoint Analysis (2010) J Sensory Studies 25: 127-145. https://doi.org/10.1111/j.1745-459x.2009.00258.x 18.
Moskowitz
HR. Mind Genomics: The Experimental Inductive Science of the Ordinary and its Application
to Aspects of Food and Feeding (2012) Physiol Behav 107: 606-613. https://doi.org/10.1016/j.physbeh.2012.04.009 19.
Dubes R and Jain AK. Clustering Methodologies in Exploratory
Data Analysis (1980) Adv Comp 19: 113-238. https://doi.org/10.1016/s0065-2458(08)60034-0 20.
Wang
S, Lu J, Gu X, Du H and Yang J. Semi-Supervised Linear Discriminant Analysis for
Dimension Reduction and Classification (2016) Pattern Recognition 57: 179-189. https://doi.org/10.1016/j.patcog.2016.02.019 21.
General Data Protection
Regulation. Howard
Moskowitz, Mind Genomics Associates, Inc., White Plains, 11 sherman ave, New
York, USA, E-mail: mjihrm@gmail.com General marketing, Computer technology and Personal
viewpoint identifierImbuing the Supply Chain with the Customers Mind: Todays Reality, Tomorrows Opportunity
Abstract
Full-Text
Introduction
Design
Thinking-Precursor Steps to Knowing the Mind of the Specific Customer
A
Re-Conception of a Moment of Truth-Communicating to the Mind of the Customer
The
Role of NO
Mind
Genomics Thinking: Uncovering mind-sets, i.e., basic patterns of acceptance
Demonstrating
the Mind Genomics Science by Sequencing Patterns of Individual Preferences

Table
2: The four questions and the nine answers to each question,
the brand names are part of the initial data acquisition (Mind Genomics) but discarded
for the PVI (personal viewpoint identifier).
Step 4-Transform the
ratings and create individual-level regression models: The analysis relates
the presence/absence of the 36 elements to the 9-point rating scale of interest
in the product as described by the vignette. In deference to the consumer-research
heritage of Mind Genomics, the ratings on a 9-point scale are converted to a binary
scale, with ratings of 1-6 converted to 0 and ratings of 7-9 converted to 100. For
each respondent the OLS (Ordinary Least-Squares) regression program computes a simple
model: Binary 0/100=k0 + k1(A1) + k2(A2) … k36(D9)
Each respondent generates a set of coefficients, k0 and k-k36.
The additive constant, k0, shows the likelihood of a respondent assigning
a rating of 100 to a vignette or combination lacking ny elements. The additive constant
is strictly a theoretical, computed measure because by design all vignettes comprised
2-4 elements. The additive constant is useful a baseline of interest, however, each
of the 36 elements generates a coefficient, either positive or negative. The size
of the coefficient tells us the incremental percent (positive coefficient) or decrement
percent (negative coefficient) that would be added to the additive constant. The
sum tells us the likely percent of responses of magnitude 7-9 for a specified composition
of the vignette.
Table
3: The coefficients for the relevant elements for each
Drink It! Study, with the source of the coefficients being the three mind-sets extracted
separately for each study. The brand names are not part of the input data for the
subsequent PVI, and are not shown. Discussion-Mind
Genomics +PVI to Create Opportunities for a New Type of Integrative Research
Conclusions
Acknowledgements
How
Mind Genomics and the PVI began
References
*Corresponding author
Citation
Moskowitz H, Gere A, Moskowitz DY, Sherman R, Deitel Y, et al. Imbuing the supply chain with the customer’s
mind: today’s reality, tomorrow’s opportunity (2019) Edelweiss Appli Sci Tech 3: 44-51. Keywords