
 PDF
PDF
Background
Those who study political science, history, economics, sociology, and indeed all of the different social sciences know that it is the nature of countries to experience both good times and bad times, prosperity and difficulties, respectively. We know that difficulties may stem from many causes, economic, social, physical (example: climate), and so forth. We also know that people respond differently to the difficulties facing them, whether these difficulties are of global sort, plaguing their country or the world, or whether these difficulties are of the local sort, plaguing individuals. Each discipline of social science looks at the situation and the data from its own discipline-appropriate point of view. Economists working on the behavior of people and nations call these issues micro-economic when the topic is the individual and macro-economic when the topic is the nation. Sociologists look at the social structures within the country. Political scientists look at the nature of man’s motivates within the society, and how those manifest themselves in terms of power and activities. Social issues with which a country must deal vary from those outside of its control and emerging from the ‘world order’, both political and economic, as well as issues within the country, also political and economic.
The typical
social science study looks for the ‘nomothetic,’ the recurrent patterns over
time which generate ‘rules’. Psychologists working with these national-level
problems must work with the nomothetic, and supplement the information with
interviews from the ordinary citizen, or, if fortunate, from key players, those
responsible for the situation, or at least in power. The topics with which we
deal in this study are some of the problems faced by a country today, including
slow growth, corruption, young people leaving the country, and political
instability, respectively. The literature of each of these topics is writ large
in both the academic and popular presses. Studies of slow growth talk about
ways to stimulate the economy, which work and which don’t. Studies of
corruption abound in the literature, perhaps because corruption is a topic
appealing to many people from the vantage points of morality, legality,
economics, etc.
Studies of young
people leaving a country in search of a better life are the warp and woof of
stories of people writing their autobiographies, but also today of concern in
many countries with low growth which face losing the young population. Finally,
political instability is a mainstay of historians, sociologists, political
scientists, economists, and psychologists, each of whom approaches the effects
of political instability on the actions of the country with respect to other
countries, the social fabric of the country, and the minds of the citizens.
One can get a
sense of paradox in social science, from excerpts from a few studies. For
example, dealing with corruption one gets a sense of the mind of the citizen,
but not a deep sense [1]. Borrowing theoretical insights from the
information-processing theory of voting, this study finds that political
corruption becomes a formative electoral factor when the regime fails to
sustain a sufficient level of economic growth. Otherwise, political corruption
is not a significant factor that shapes electoral outcomes, irrespective of the
level of perceived corruption, because the economy occupies voters' minds as
the most important issue, making it a more accessible issue than political
corruption A second example of the psychological approach comes from the National
Bureau of Economic Research, which considers ‘gross’ psychological measures,
rather than refined, in-depth measures [2].
Assessing the
economic impact of the COVID-19 pandemic is essential for policymakers, but
challenging because the crisis has unfolded with extreme speed. We identify
three indicators-stock market volatility, newspaper-based economic uncertainty,
and subjective uncertainty in business expectation surveys-that provide
real-time forward-looking uncertainty measures. We use these indicators to
document and quantify the enormous increase in economic uncertainty in the past
several weeks. This paper presents a new approach to studying national
problems, albeit from the point of view of the individual. The objective is to
incorporate the mind of the ordinary citizen into an experiment about
alternative situations, specifically combinations of problems and solutions.
How does the ordinary citizen respondent to these problems and solutions, when
they are presented in a situation (vignette)? Can we deconstruct the data to
reveal the mind of the citizen, even if that mind been only revealed through a
pattern of responses, and through direct questioning? Finally, does unique
situation, a ‘Black Swan’ event, such as the Covid-19 pandemic, affect the mind
of the citizen [3].
Our first topic,
from a set of planned topics, how people in the United States feel about
problems and solutions for issues which involve their country. These problems
range from corruption to slow growth to loss of population (e.g., the young
people leaving the country for lack of opportunity). The solutions range from
what can be done for workers to what types of education opportunities can be
created. The problems are not stated with respect to the United States, but
rather stated as general problem facing a nation. The paper represents a year
on year comparison of the responses to the same stimuli, with the intervention
produced by the recent t Covid-19 pandemic. The pandemic has affected people
world-wide, forcing them to shelter in place, and changing the reality of their
futures as the dismal economic news emerging in the wake of this pandemic
applied to many of the people in the population. The original
study, responses to problems/solutions for a country was run in May, 2019, with
51 respondents in the US, sufficient to reveal patterns. The second, exactly
parallel study with the same material but with 51 new respondents was run in
May 2020, one year and one week later, with the same type of respondents. The
data from these two studies can be directly compared, as well as merged, to
understand how a pandemic might affect the mind of a person as the person
responds to different vignettes about the situation of one’s country.
The research
protocol followed the steps used for Mind Genomics, an ‘experimenting science,’
which focuses on the response to people to compound stimuli presents situations
(e.g., problems and solutions). The ingoing bases of Mind Genomics are the
belief that experimentation may provide stronger linkages between problems and
solutions than might a non-systematic, cross-sectional analysis of problems and
solutions. Mind Genomics traces its history of experimental psychology, with
the study framed as an experiment whose outcomes reveal linkages and causations
[4,5] Mind Genomics also traces back to statistics, specifically experimental
design and finally to the focus of market research, which deals with the
everyday aspects, and the rules for decision making [6,7] Mind Genomics follows
a specific set of choreographed steps, along with a technology (BimiLeap®),
which provides rapid, automatic, and affordable analyses of research data from
the experiments. A statistical graphics software package was used named SYSTAT,
Inc, 2009. SYSTAT® 13: Statistics.
Step
1: Set up the raw material, questions and answers (elements): The Mind
Genomics process works in a Socratic fashion, requiring the researcher to think
of four questions, relevant to the topic, questions which tell a story. The
focus of this study was on problems and solutions that a country might face.
Table 1 shows the four questions, with Question A (what is the country
situation now?) dealing with the problem, and Questions B-D dealing with
alternative types of solutions. The answers to the questions (henceforth called
‘elements’) reflect different alternatives addressing and answering the
problem. Altogether there are 16 such elements, four elements dealing with the
problem, and 12 elements dealing with solutions (Table 1).
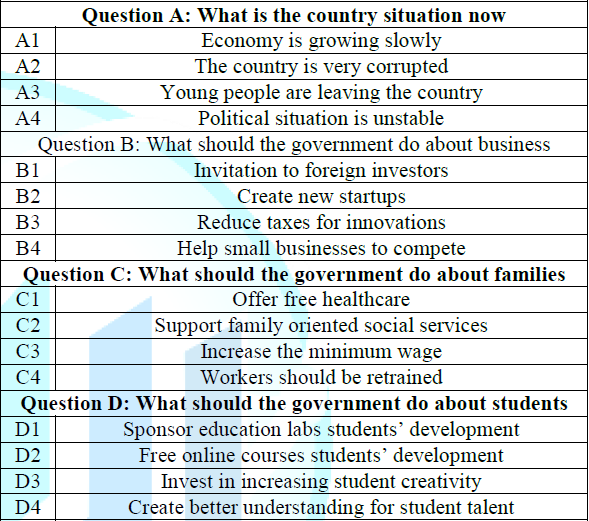
Table 1: The ‘raw material’ comprising the four questions
Step 2: Construct the test vignettes: Mind Genomics works with
combinations of elements, rather than working with single elements in the manner
of a survey. The ingoing world view is that for most of their lives navigate
through oceans of information, typically mixtures, and with a low level of
attention [8].
The construction of the vignettes is
dictated by a plan called an experimental design [6]. The specific design calls
for 24 combinations, the vignettes. Each combination comprises 2-4 elements, at
most one element or answer from a question. The experimental design calls for
many of the vignettes to be absent elements or answers from one, and sometimes
from two questions. Furthermore, the vignette can never have more than one
element or answer from any question. Finally, each respondent evaluated a
unique set of 24 vignettes. The mathematical structure underlying the 24
vignettes was maintained from respondent to respondent, but the actual
combinations changed. This strategy allows the research to ‘cover’ a great deal
of the so-called ‘design space,’ defined as the world of possible combinations [9].
Step 3: Respondent evaluated the vignettes in an
internet-based experiment lasting 3-5 minutes: The respondents were members of a
panel operated by Luc.id, and had previous agreed to participate in all types
of studies sent to them. Membership in on-lie panels is very popular because
the respondents are compensated for participation. Occasionally, an objection
will be raised that such respondents are biased.
Mind Genomics is fairly immune to
such objections because the vignettes are put together in a way defying one’s
ability to understand the underlying structure. Respondents answer at a ‘gut
level,’ in the same way that they live their ordinary lives, without paying
deep attention to the world around them. The respondent began the experiment by
providing gender, age, and then one of four answers regarding feelings about
the government. In the actual experiment, quickly following the classification
and orientation, the respondent was presented with each vignette one at a time,
in a randomized order, meaning that not only were the combinations of elements
different for each respondent, but the order of the vignettes in the set of 24
vignettes was varied. The respondent each vignette, and rated the vignette as a
totality. The instructions were sparse and simple. The key information is
contained in the vignette, not in the instructions: Read this vignette-what
will be the outcome in 6 months if this happens? 1=disaster, 2=simple failure, 3=no change, 4=improvement,
5=prosperity.
Step 4: Recode the data to prepare for OLS (ordinary least-squares)
regression modeling: The ratings for the five-point scale were recoded twice.
The first recode, Top2 or Positive Outcome, transformed ratings of 1-3 to 0 to
denote a non-positive outcome, whether a negative outcome or no change. In
turn, ratings 4-5 were transformed to 100 to denote a positive outcome. The
second recode, Bot2 or Negative outcome, transformed ratings of 1-2 to 100 to
denote a negative outcome. In turn, ratings 3-5 were transformed to 0 to denote
a non-negative outcome.
Step 5: Select three dependent variables: Step 4 created two new variables by
recoding the ratings. These two variables show responses which are either
clearly positive (Top2), or clearly negative (Bot2). The third dependent
variable was the response time, defined as the number of seconds to the nearest
tenth of a second, elapsing between the appearance of the vignette on the
screen and the rating assigned by the respondent. All elapsed times beyond 9
seconds were converted to 9 seconds.
Step 6: Create individual-level models for Top2 and for
Bot2, and then cluster the respondents: Each respondent evaluated a full
set of 24 combinations, conforming to an experimental design for the
respondent. The design allowed the OLS regression to estimate the relation
between the presence/absence of the 16 elements and the two newly created
variables (Top2, Bot2, respectively). All 24 vignettes were used to create two
models for each respondent, one model relating the elements to optimistic
outcome (Top2), and the other model relating the elements to pessimistic
outcome (Bot2). The two equations were expressed by the simple linear
expression: Binary Transformed Rating = k1(A1)+k2(A2) … k16(D4).
The equations were estimated without an additive constant. With two equations
for each respondent, there 204 equations, two for each of 51 respondents
participating in 2019, and two for each of 51 different respondents
participating in 2020. The 102 respondents were clustered by k-means
clustering, with the distance between any two respondents defined by the
expression (1-Pearson R, viz., 1- Pearson correlation coefficient computed on
the 24 corresponding coefficients between two respondents.) The expression,
‘distance between two respondents,’ ranges from a low of 0 when the coefficients
from the two respondents are perfectly aligned (R=+1, 1-1 =0), to a high of +2
when the coefficients from the two respondents are perfectly inversely aligned
(R=-1, 1-1=2) [10].
Step 7: Computing the means and performing the “Grand’
regression analysis on vignettes 2-24 for each group: Previous studies suggest that the
respondent does not know what to do on the first rating. Since each respondent
evaluated a unique set of combinations, the average data and the group
regressions (total, all males, mind-sets, etc.) were computed using the data
from vignettes 2-24, and ignoring the first vignette evaluated by the
respondent. Note that the individual-level analysis (Step 6) was made using all
24 vignettes for each respondent, a necessary step because the experimental
design at the level of the respondent requires all 24 vignettes, whereas the
analysis of larger groups is based on much more data, so the individual-level
experimental design is not necessary. The first vignette and its rating may be
safely discarded with base sizes of 20+ respondents.
Results
Means for ratings, comparing pre Covid-19 ratings to ratings
assigned during Covid-19: Table 2 shows averages for ratings of vignettes in position
2-24, 23 vignettes. The variables on which the vignettes were rated are Top2
(Positive outcome), Bot2 (Negative outcome), and RT (response time, or time to
read the vignette). The data come from the Total Panel of 102 respondents,
first considered as one group, and then divided into the first study (before
the Covid-19 pandemic) and the second study (during the Covid-19 pandemic) (Table 2).
We are not looking for statistical
differences, but rather simply for patterns which can suggest hypothesis. The
Mind Genomics world-view is akin to a cartographer, not so much looking to
falsify a hypothesis in the manner of the hypothetico-deductive process but
rather to identify interesting patterns. In this spirit of patterns, the data
suggest the following for the total panel, first combined and then broken out
into the data from the respondents who participated in 2019 (pre-Covid-19) and
those participated in 2020 (during Covid-19) [11].
· When we look at the averages from those vignettes comprising
only solutions and no problems, viz., elements B1-D4, we see that respondents
participating in 2019, pre-Covid-19 were far more optimistic than respondents
participating during-Covid-19 (average of 41 vs 28, respectively for Top2). The
reverse is the case when look at pessimism. Respondents participating
during-Covid-19 were slightly more pessimistic than respondents participating
pre-Covid-19 (24 vs 32, respectively for Bot2). The respondents participating
pre-Covid-19 showed a dramatically longer response time than respondents
participating during-Covid-19 (4.3 vs 3.6 seconds, respectively).
· When we move to incorporating all vignettes, those with
problems (A1-A4) and with solutions (B1-D4), we see an unexpected pattern.
Those responding pre-Covid-19 are slightly LESS optimistic than those
responding during-Covid-19 (30 vs 34 for Top2). Those responding pre-Covid-19
are slightly more pessimistic than those responding during-Covid-19 (37 vs 30
for Bot2). Finally, those responding pre-Covid-19 showed a much longer response
time (4.7 seconds vs 3.8 seconds).
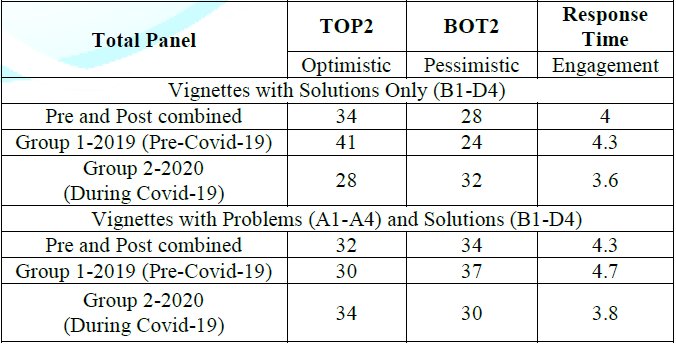
Table 2: Average ratings assigned to vignettes
Uncovering
the granularity of the mind through regression
A deeper understanding of the mind of the respondents
emerges by relating the presence/absence of the different elements (problems,
solutions) to the ratings (Top2 for optimistic, Bot2 for pessimistic, and
Response Time for engagement). The benefit of experimental design is that the
combinations are specified; afterwards the researcher can deconstruct the
ratings into the part-worth contribution of each of the 16 elements. The Mind
Genomics approach becomes even more valuable when the elements themselves are
‘cognitively rich,’ having meaning that they have denotative and connotative
meaning. Becomes far easier to understanding the patterns which emerge from
these straightforward experiments which mix ideas, i.e., elements, in contrast
to having to uncover, or really impute a meaningful pattern from a set of
simple points, these points themselves having no intrinsic meaning.
The equation is the same one as used for the individual
respondents, but the ‘cases’ or ‘observations’ are all vignettes tested in
position 2-24, half of those vignettes from 2019, and the other half from 2020.
The equation is: Transformed Rating or Response Time=k1(A1)+k2(A2)….K16(D4).
The coefficients appear in (Table 3).
All coefficients greater than 1.0 are shown for Response Time. Only the
positive coefficients are shown for Top2 (optimistic) and Bot2 (Pessimistic).
Showing only the positive coefficients for the binary-transformed rating or the
higher response time coefficients makes it easy to detect patterns, without
forcing the reader to face a ‘wall of numbers’.
Emotional
responses to situations (problems facing the country)
When we step back from the individual elements, and look at
the general pattern, we see that there are about equal numbers of pessimistic
and optimistic responses. There are two types of situations, one type driving
clear pessimism (A2–The country is very corrupted; A4–Political situation is
unstable), and the other type driving an ambivalent response (A1–The economy is
growing slowly; A3-Young people are leaving the country).
Emotional
responses to solutions
The solutions are much clearer. A number of solutions drive
strong optimism, especially for pre-Covid-19 days, not so much for feelings
during the pandemic (C3–Increase the minimum wage; B1–invitation to foreign
investors; B3–Reduce taxes for innovations; C1–Offer free healthcare). The
strong performing solutions divide into those dealing with economic incentives,
and those dealing with social benefits. As we will see below, these two types
of solutions appeal to two mind-sets, respectively. There is another set of
solutions which drive optimistic responses, but less strongly, but driving
optimism both before the pandemic and during the pandemic. These are: B2–Create
new startups; D2–Free online courses for students’ development; D3–Invest in
student creativity. There only a few scattered solutions which drive
pessimistic responses, none strongly. The strongest is C3–Increase the minimum
wage, driving pessimism only during the pandemic.
Which
elements engage attention (Response Time).
In the history of experimental psychology, response time
(also called reaction time) is assumed to represent underlying psychological
processes [12]. When it comes to reading vignettes, the response time, measured
from the time the stimulus appears to the time the response assigns the rating,
may reflect the time it takes to read the vignette, the time it takes to
comprehend what is read, and the time it takes to assign the response. The
model for response time is expressed in the same way as the model for Top2 and
Bot2, optimistic and pessimistic responses, respectively. The equation is: RT =
k1(A1)+k2(A2)…k16(D4). The coefficients of 1.0
or less (response time less than 1 second) are not shown, and may be considered
to be not engaging. Whether these non-engaging elements drive optimistic or
pessimistic responses is irrelevant. Coefficients of 1.1-1.4 are shown, but not
highlighted. These elements drive engagement, but not long engagement.
Coefficients of 1.5 or higher are shown in bold type and in shaded cells. These
elements drive long engagement. With respect to problems A1-A4, all four
problems drive engagement. The longest engagement is A1, political situation is
unstable. With respect to solutions, we see a range of engagement, from
elements driving strong engagement (e.g., 1.8 seconds for B3, reduce taxes for
innovation pre-Covid-19), to elements which drive little engagement (e.g.
D1-D4, elements about students, during-Covid-19).
Dividing
the respondents by the pattern of coefficients
The creation of the mind-sets through clustering is a mathematical
process, not a process of interpretation. The computational formulas define the
clusters based upon variability within a cluster versus variability across
clusters. Yet, the mathematical clusters are not the objective of clustering.
Rather, it is the creation of different and interpretable groups of
respondents. The clusters or groupings must be parsimonious (fewer clusters are
better), but must also be interpretable (tell a story). A two-cluster solution
is parsimonious, but not easy to interpret. A three-cluster solution is easier
to interpret.
Three mind-sets are the following, based upon what makes
them feel optimistic. Rather than looking at each element, one at a time to
determine what these mind-sets are ‘all about,’ it’s easy simply to look
holistically at the pattern of the elements for optimistic responses, for
pessimistic responses, and for response time. The three mind-sets have been
already decided upon by the combination of statistics (clustering) and
interpretation (a general, almost intuitive sense of the meaning of the
clusters).
What
drives optimism (Top2) among the three mind-sets, Pre-Covid-19 and
During-Covid-19?
Table 4 shows the non-zero coefficients for Top3, the sense
of optimism. (Table 4) shows the
positive coefficients for each of the three mind-sets, for those respondents in
the mind-set participating Pre-Covid-19 (May 2019) and During-Covid-19 (May
2020).
Mind-Set
1:
(Focus on startups and students)
Pre-Covid-19-Optimistic when helping everyone, being
generous, the effort has to build something. During-Covid-19-Optimism increases
when focusing on what students can do to help the country
Mind-Set
2:
(Focus on investment and deep structural change
Pre-Covid-19-Optimistic when helping business to compete. During-Covid-19-Optimism
goes away.
Mind-Set
3:
(Focus on the family and the social safety net)
Pre-Covid-19 Optimistic when helping the social fabric.
During-Covid-19–Optimism drops, but still interested in helping the family.
What
drives pessimism (Top2) among the three mind-sets, Pre-Covid-19 and During
Covid-19
Table 5 shows the non-zero coefficients for Bot2, the sense
of pessimism. (Table 5) shows the
positive coefficients for each of the three mind-sets, for those respondents in
the mind-set participating before Covid-19 (May 2019) and during Covid-19 (May
2020)
Mind-Set 1:
(Focus
on startups and students) Pre-Covid-19. Focuses on problems and effort involved
in retraining workers. During-Covid-19. Less pessimistic about problems
Mind-Set 2: (Focus on investment and deep
structural change) Not pessimistic about the problems Pre-Covid-19. Pessimistic
when the solution involves social aspects. Such as worker retraining, higher
minimum wage, free healthcare. During-Covid-19. Dramatically more pessimistic
about solutions.
Mind-Set 3: (Focus on the family and the social safety net) Pre-Covid-19 and During-Covid-19-Almost equally pessimistic about the problems and solutions. Little effect of the pandemic on their point of view.
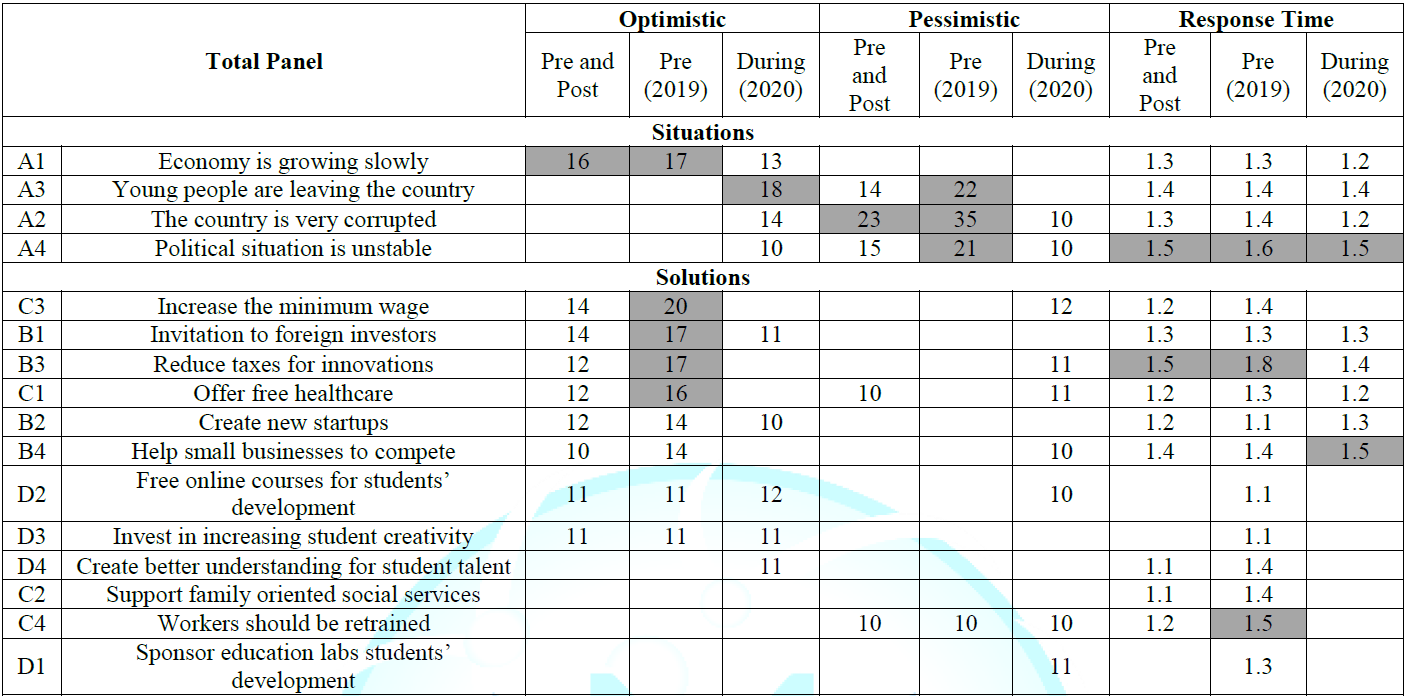
Table 3: Coefficients for the total panel, showing the models
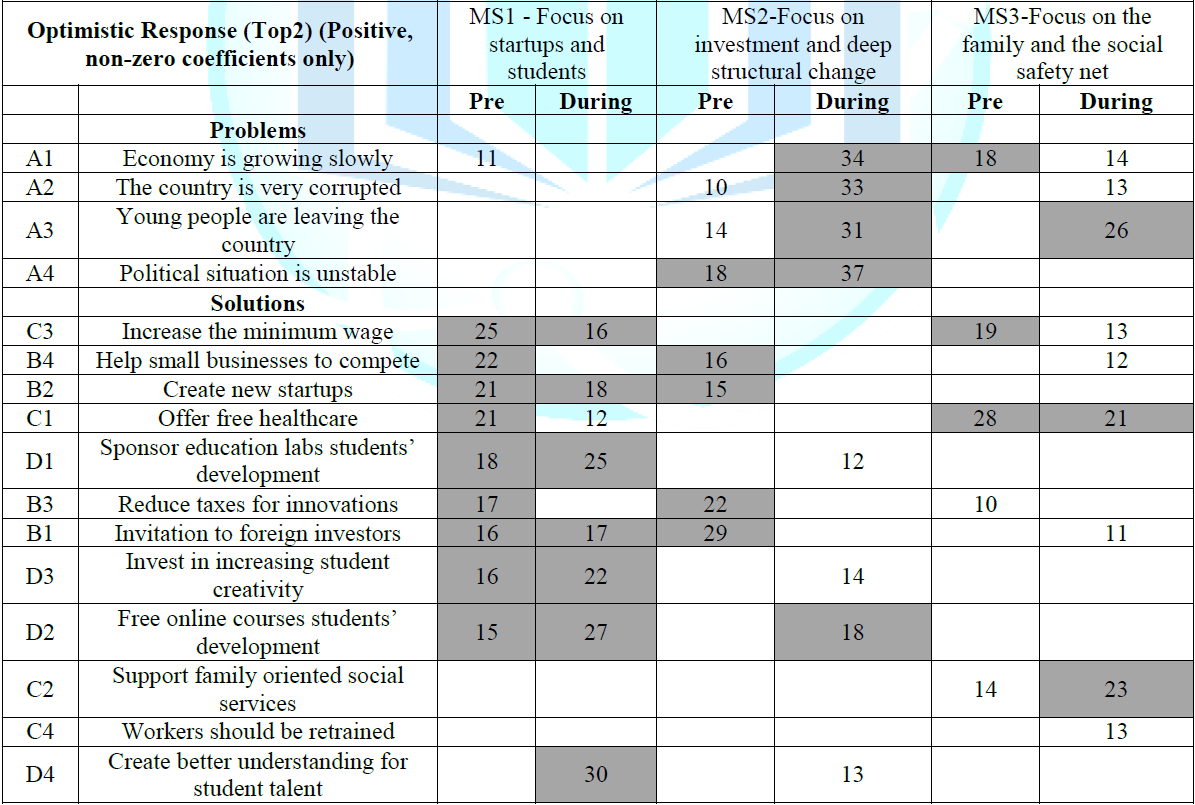
Table 4: Non-zero, positive coefficients for elements

Table 5: Non zero coefficients for elements, showing those
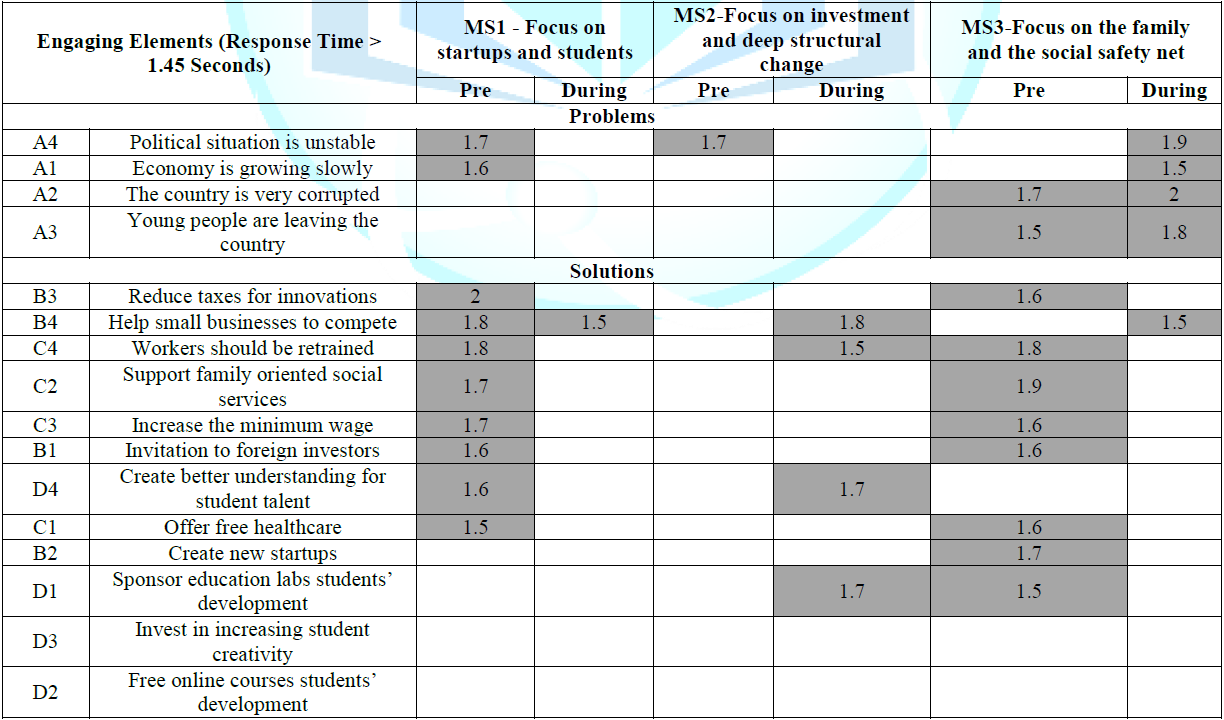
Table 6: Strongly engaging elements (RT>1.45)
Table 6 shows only those elements which demonstrate ‘strong
engagement,’ operationally defined here as a response time coefficient of 1.451
seconds or longer, a coefficient which rounds up to 1.5 seconds. There could
have been other cut-points. This point was selected to allow a pattern to
emerge, if one exists (Table 6).
Mind-Set: (Focus on startups and students) Barely
focuses on problems. Pre-Covid-19. Focuses on solutions. During-Covid-19. Does
not focus on solutions
Mind-Set
2:
(Focus on investment and deep structural change)
Barely focuses on problem
Pre-Covid-19. Does not focus on solutions
During-Covid-19. Focus on solutions
Mind-Set
3:
(Focus on the family and the social safety net)
Focuses on problems, both before and during Covid-19.
Pre-Covid-19. Focuses on solutions.
During-Covid-19. Does not focus on solutions.
Finding
these mind-sets in the population
A key tenet of Mind Genomics is that within any population
of people the differences in opinion about a topic will manifest themselves in
ways that we might consider random or at least in patterns across standard
demo- and psycho-graphics that we will find hard to predict. People are
accustomed to believing that people similar in their geo-demographics or in the
psychographic profile will think similarly about a topic. The reality is
absolutely different. Even within a typical group at a fixed time there are a
variety of patterns of responses to the same test stimuli, by people who might
be otherwise labelled homogeneous with respect to standard criteria, such as
age, gender, income, education, political belief, and so forth. Presents the
distribution of respondents by year, gender, age group and response to the
government all provided before participation in the experiment.
The numbers in the table are the numbers of respondents in
the group. No clear pattern emerges suggesting that the mind-sets align with
standard measures, e.g., period (before versus during the pandemic),
geo-demographics (age, gender), or attitude towards the government. There may
be other metrics which do show clearer alignment of mind-sets, but finding
these metrics may be very hard for any specific set of mind-sets which emerge
when the Mind Genomics study is run on a challenge-topic, one with little
previous data. During the past three years, beginning in 2017, authors Gere and
Moskowitz have addressed the issue of discovering mind-sets in the general
population. The metaphor for the approach is the development of a ‘colorimeter,
a device which, when applied to any object, deconstructs the color of the
object, showing the percent of ‘primary’ colors which combine to create the
object’s color.
The issue for Mind Genomics is that each topic area, and
indeed each study, will reveal so-called primaries, or in the language of Mind
Genomics, so-called mind-sets. These mind-sets emerge from the common pattern
of responses to a set of messages. Thus, the issue for discovering the mind-set
of an individual in the general population is complicated by the fact that the
mind-set may be hitherto unsuspected, i.e., newly discovered, and the
requirement for identifying the mind-set among new people is time-limited.
Political or economic instability may emerge, the Mind Genomics effort may
provide a set of viable solutions, but only for certain mind-sets.
The real problem is to discover these mind-sets first, then
identify the proper solutions, and finally poll the general population with a
tool that assigns each new individual to one of the mind-sets, and thus
suggests the most appropriate ‘messaging’ for that newly assigned person. The
approach presented here is called the PVI, the personal viewpoint identifier.
It uses the basic data from the study, independent of year (see Table 8), focusing only on the optimistic responses (Top2).
The approach uses a Monte Carlo simulation to create 20,000 sets of data, with
random perturbations in the coefficients of the elements, and then searches for
a linear function comprising exactly six elements, so that the three mind-sets
are best separated. The algorithm can be employed for any data emerging of the
form shown in (Table 7) (with the
blanks either the original coefficients, or the blank cells replaced by 0,
which they were for the PVI reported here).
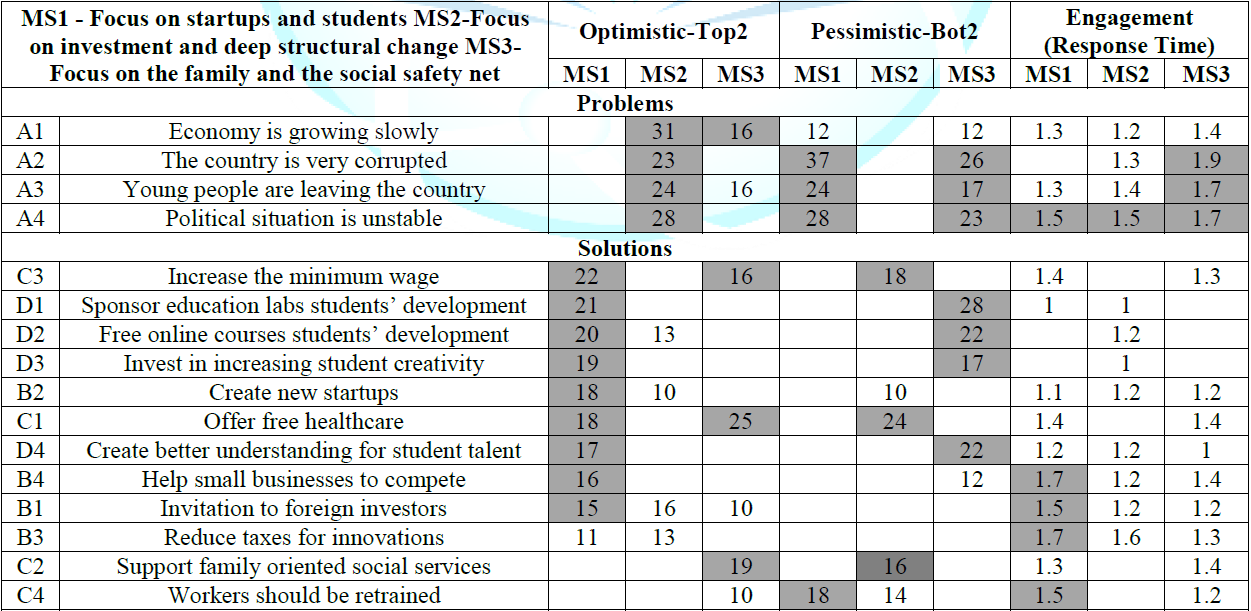
Table 7: Original data from the mind-set segmentation
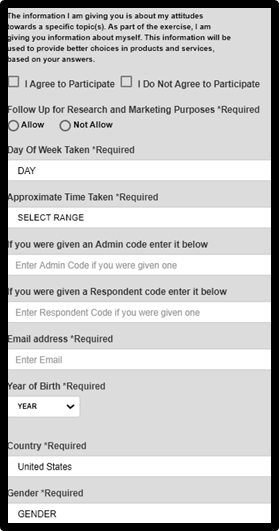
Figure 1:Part 1 pf the PVI-self-profiling classification
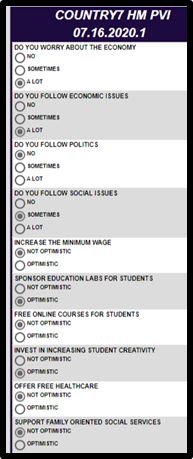
Figure 2: Part 2 of the PVI, showing the four attitudinal questions and the six binary questions.

Table 8: The feedback table for the mind assignment
Discussion and conclusions
For many years now researchers dealing with public policy have worked either with published or about-to-be published secondary data, or with what may well be considered to be simplistic attitudes. The data about behavior and geo-demographics are often quite detailed, presumably because such data are readily available. The many measures of a personal available in so-called purchasable data allows the creative researcher to divide the respondent population into many groups, depending upon the predilection of the researcher to delve into the deep of granularity underlying who a person is, what the person does, and in some cases what the person thinks or at least expresses, the latter through analytics of social media posts, and so forth. The aforementioned data is part of the mass of information known as big data. Econometricians know this type of information as cross-sectional data, namely data which has some basic structure, that structure awaiting the adept researcher or data scientist to reveal some hitherto unknown pattern. The analysis becomes even more interesting when one has a modest amount of attitudinal information about the person, obtained from simple questionnaires, or self-reported behavior of interest, such as voting. What appears to be missing in the conventional data analysis but provided by Mind Genomics is an understanding of a topic at a deep, granular level, through experimentation. Rather than working with the standard categories of information available to everyone, whether these be geo-demographics, behaviors, or even so-called segmentation schemes based on attitudes, Mind Genomics goes right to the heart of the matter, structuring a topic by a series of questions and alternative answers, presenting these answers, obtaining ratings, and by so doing understand the mind of the person at deep level, as shown in this paper. The analysis has been able to delve into what problems and solutions are associated with an optimistic feeling, a pessimistic feeling, as well as which problems and solutions engage attention.The small-scale exercise with Mind Genomics demonstrates for social scientists a new opportunity to move beyond simply collecting and analyzing cross-sectional data, or using simplistic surveys, both to attack defined problems. The world-view of Mind Genomics is focused experimentation, with the objective to descend into the granularity of experience, at virtually any level of granularity desired. The study reported here focused on general problems that a country may have, and general solutions to these problems. Yet, the problems are not so general that they are without real meaning. The problems as stated and the solutions as stated provide sufficient concreteness and granularity so that they paint different world pictures.
If this paper can be said to make one major contribution, it is to introduce the aforementioned notion of experimentation to political science. It is impossible to do ‘real experiments’ with nations and their inhabitants, but it is straightforward to set up an experiment, mixing descriptions of situations, problems and solutions, present these descriptions (vignettes) to respondents, secure ratings of the vignettes, and deconstruct the responses into meaningful, interpretable patterns, as well as even find different mind-sets. Furthermore, the mix of psychology as informed by market research (dealing with the cognitive rich and real, rather than doing abstract experiments) with political science, and other social sciences, opens up new vistas, whereby once can observe the world order or the national order at a macro-level, and at the same time probe deeply by experiment into the psyche of the citizen. The experiments are short (3-5 minutes), meaning that during the course of a day or two a dozen or two dozen studies can be run quickly, to obtain a real-time snapshot of the mind of the citizen as the world about the citizen is in flux. Some of proposal solutions that comes as a framework of this study are that a country should create programs and projects for education to increase the minimum wage; sponsor education laboratories for students, provide free online courses for students. Also, it would be advantageous to increase the economy; a country should invite foreign investors and should reduce taxes to encourage innovation in order to have incomes and to increase labor force. For families, free healthcare should be supported to support family-oriented social services by creating programs and support from government.
Acknowledgment
Attila Gere thanks the support of Premium Postdoctoral Research Program of the Hungarian Academy of Sciences.References
- Choi E and Woo J. Political corruption, economic
performance, and electoral outcomes: A cross-national analysis (2010)
Contemporary.
- Baker SR, Bloom N, Davis SJ and Terry S. Covid-induced
economic uncertainty (2020) National Bureau of Economic Research.
- Taleb and Nassim N. The black swan: The impact of the highly
improbable (2007) Random house.
- Moskowitz HR. ‘Mind genomics’: The experimental, inductive
science of the ordinary, and its application to aspects of food and feeding
(2012) Phys and behavior 107: 606-613. https://doi.org/10.1016/j.physbeh.2012.04.009
- Moskowitz HR and Gofman A. Selling blue elephants: How to
make great products that people want before they even know they want them
(2007) Pearson Education. https://doi.org/10.1111/j.1540-5885.2008.00327_3.x
- Box GE, Hunter WH and Hunter S. Statistics for experimenters
(2nd) (1978) New York: John Wiley and Sons 664.
- Green PE and Srinivasan V. Conjoint analysis in marketing:
new developments with implications for research and practice (1990) J mark 54:
3-19. https://doi.org/10.1177/002224299005400402
- Kahneman D. Thinking, fast and slow (2011) Macmillan.
- Gofman A and Moskowitz H. Isomorphic permuted experimental
designs and their application in conjoint analysis (2010) Journal of Sensory
Studies 25: 127-145. https://doi.org/10.1111/j.1745-459x.2009.00258.x
- Jain AK and Dubes RC. Algorithms for clustering data (1988) Prentice
Hall, USA.
- Elstein AS. What goes around comes around: return of the hypothetico‐deductive strategy (1994) Teaching and Learning in Medicine: An Int J 6: 121-123. https://doi.org/10.1080/10401339409539658
- Schweickert R. Response time distributions: Some simple
effects of factors selectively influencing mental processes (1999) Psychonomic
bulletin and review 6: 269-288. https://doi.org/10.3758/bf03212330
Corresponding author
Howard Moskowitz, Mind Genomics Associates, Inc., White Plains, NY, USA, E-mail: mjihrm@gmail.comCitation
Moskowitz H, Prendi V, Gere A, Harizi A, Papajorgji P. Mind-sets of worried citizens and the ‘real-world experiment’ of covid-19: a mind genomics cartography (2020) Edelweiss Appli Sci Tech 4: 41-49.Keywords
Micro Economic, Mind Genomics and Covid-19
