Introduction
Bimatoprost, (7-[3, 5-dihydroxy-2-
(3-hydroxy-5-phenyl-pent-1-enyl)- cyclopentyl]-N-ethyl-hept-5-enamide), is
antiglaucoma agent (ophthalmic) [1].
BMT
is a prostaglandin analog/prodrug used topically (as eye drops) to control the
progression of glaucoma and in the management of ocular hypertension [2-8]. Few
methods were reported for determination of BMT. These included Ultra
Performance Liquid Chromatography (UPLC-MS) for determination of the drug in
presence of its impurity (methyl ester) [9], HPLC-UV methods for
determination of BMT in bulk and ophthalmic solution [10], and HPLC-MS/MS for
quantification of BMT, latanoprost and travoprost in Eyelash Enhancing Cosmetic
Serums [11]. To the best of our knowledge, there is no reported reverse phase
TLC or HPLC stability indicating methods for determination of BMT using stress
conditions. In this study, we present rapid, selective chromatographic methods
for determination of BMT in ophthalmic solution and in synthetic mixtures of
the drug and hydrolytic and oxidative degradation products.
Experimental
Instrumentation
TLC scanner
three densitometer (Camag, Muttenz, Switzerland).
The
following requirements are taken into consideration:
·
Slit dimensions: 6 x 0.3 mm
·
Scanning speed: 20 mm/s
·
Spraying rate: 10 µL/s
·
Data resolution: 100 µm/step
·
Band width: 3 mm
·
Result output: chromatogram and integrated peak area, Linomat IV with 100
μL syringe (Camag), Sonix TV ss-series ultrasonicator (USA, Newtown, CT)
·
UV lamp with short wave length 254 nm. (Desaga, German).
·
RP-TLC plates (20 x 20 cm) coated with silica gel 60 F254 (1.05554.0001)
(Merck, Germany).
·
Hamilton micro syringe, (5 µL & 25 µL).
·
LC-MS-QQQ Mass Spectrometer 6420 Triplrquad (Agilent technology) .
·
The pH was measured with Jenway pH meter 3510 (UK).
·
HPLC (Agilant technologies 1260 series), USA consist of quaternary pump,
equipped with a variable wavelength detector and injector valve with 20 µL
constant loop and vacuum degasser.
·
Membrane filters with pore size 0.45 µm and 0.47 µm diameter (Alltech Associated,
USA).
Material and Dosage Form
Authentic sample
BMT was kindly
supplied by Chemipharm Pharmaceutical Industries S.A.E 6th October Egypt, Batch
No: 20170504000. The purity of the sample was found to be 100.29% according to
certificate from the company.
Dosage form
BMT ophthalmic
solution (Lumigen®) was labeled to contain 0.03% BMT, El-Sofiko pharm Co.,
Egypt; Batch No. 85543 was purchased from the localmarket.
Chemicals and reagents
Acetonitrile,
HPLC grad was from Lab-Scan (Eire), hydrochloric acid from Fischer Scientific
(UK), and 33% ammonia, 30% hydrogen peroxide, and sodium hydroxide were from
Adwic Co., Egypt. Water for HPLC was prepared by double glass distillation and
filtration through a 0. 47 μm membrane filter (Alltech Associates, USA).
Standard
Solutions
Standard stock solution
of bmt (1mg/ml): Stock
standard solution of BMT (1 mg/ mL) was prepared by accurately weighing 100 mg
of drug in 100 mL volumetric flask and dissolved in acetonitrile. Then the
volume was completed with the same solvent.
Standard
working solutions of BMT
Working
standard solutions of BMT were prepared in concentration range of 5.0 - 100.0
µg/mL in mobile phase for RP-HPLC method.
Chromatographic methods
Densitometric RP TLC method
Stationary
phase:
Aluminium sheet TLC silica gel 60 F254 S plates.
Mobile
phase:
acetonitrile–water–33% ammonia (4:5:1, by volume).
Chamber
saturation:
10 min.
Sample
applicator:
CAMAGE Linomate 5.
Band: 3 mm.
Densitometric
scanner:
CAMAGE Linomate 3 TLC scanner.
Wavelength: 220 nm.
Isocratic RP
HPLC UV method: Column: Waters corporation, USA, µ Bondapack™ C18 RP
– Column (150 mm, 5 μm, 3.9 mm i.d.) was used for separation and
quantification.
·
Hamilton
syringe 50µL capacity.
·
Mobile
Phase: consisting of acetonitrile - water (40:60, v/v)
·
UV
detector wavelength: at 220 nm.
·
Flow
rate: 1.0 mL/min.
·
Temperature:
30◦C.
·
Injection
volume: 20 μL aliquots of each solution were injected in triplicate and eluted
with the aforementioned mobile phase. The average peak areas were calculated
using chemstation software.
Procedures
Calibration curves
Densitometric
RP -TLC method: Serial volumes, equivalent to concentration ranges
(0.5 – 6 μg/ band), were applied automatically to the RP-TLC plates from stock
standard solution (1 mg/ mL in acetonitril), and
developed under the specified conditions mentioned under the chromatographic conditions
(2.5.1). The peak areas were recorded and calibration curve was constructed by
plotting the integrated peak area versus the corresponding concentration of
BMT. The regression equation was computed for the studied drug and it was used
for determination of unknown samples containing BMT.
RP-HPLC method: Aliquots equivalent to 5 – 100 µg/ mL BMT standard working solutions were
injected in triplicate and chromatographed under the conditions described
before at (2.5.2). The obtained chromatograms were recorded at 220 nm. The
calibration curve representing the relationship between peak area and
concentration was plotted and regression equation was computed.
Application
of the proposed methods for determination of BMT in the drug product
Three bottles (Lumigen 0.03%) were accurately
transferred and mixed in stopper conical flask (15 mL). Each milliliter was
equivalent to 0.3 mg of BMT (stock solution of drug product).
Densitometric
RP-TLC method: One mL of above stock solution was transferred to 10
mL volumetric flask, and diluted to volume with acetonitrile. The obtained
solution claimed to contain 0.03 mg/ mL of BMT. Then the procedure described
under (2.5.1) was followed.
RP- HPLC method: One mL of stock solution of drug product was
transferred to 10 mL volumetric flask, and diluted to volume with mobile
phase. The obtained solution claimed to contain 0.03 mg/
mL of BMT was analyzed by the proposed HPLC method described under,” 2.5.2 The
concentration of the drug was calculated from regression equation.
Stress degradation study for BMT
Hydrolytic
degradation conditions (1 mg/mL): Accurately
weighed amount about 50.0 mg BMT was placed in a
round-bottomed flask containing 50.0 mL of 2 M HCl or 50 mL 2 M NaOH
each was added separately and left for 2 hrs in water bath at 90◦C.
After the specific time the solution was neutralized with 2 M NaOH, or 2 M HCl,
respectively and evaporated on water bath. The residue of each solution was
dissolved in 20.0 mL acetonitrile and the volume was completed with
acetonitrile. The obtained solutions were labeled to contain the acid or
alkaline degradation product derived from 1 mg/ mL of BMT.
Oxidative
degradation conditions (1 mg/mL): Accurately
weighed amount 50.0 mg BMT was placed in a round-bottomed flask containing 50.0
mL H2O2 (30%) and left for 2 h at room temperature. Then
the solution was evaporated on water bath at 40oC. The residue was
dissolved in 20.0 mL acetonitrile and the volume was completed with
acetonitrile to obtain a solution labeled to contain the oxidative
degradation derived from 1 mg/mL of BMT.
Results
and Discussion
Method development
The densitometric RP TLC and RP HPLC
techniques were developed for the quantification of BMT, in
ophthalmic solution and in laboratory prepared mixtures (hydrolytic and
oxidative). The methods were based on difference in Rf / Rt values of BMT and
its degradation products. Forced degradation of BMT had been studied through
acid, alkaline and oxidative stress conditions. Complete degradation was
achieved under acid and H2O2 stress conditions.
Separation
and identification of hydrolytic and oxidative degradation products
Densitometric
RP TLC based method: Different parameters(mobile phase, scan mode, and
wavelength) affecting separation were optimized to provide selective, accurate,
and precise results for analysis of bimatoprost in synthetic mixtures of acid
and oxidative degradation products. Complete resolution was achieved by use of
developing system consisting of acetonitrile-water- 33% ammonia (4:5:1, by
volume). The Rf of BMT was 0.25. The Rf of acid and oxidative degradation
products were, 0.71 and 0.63 respectively (Figure 1).
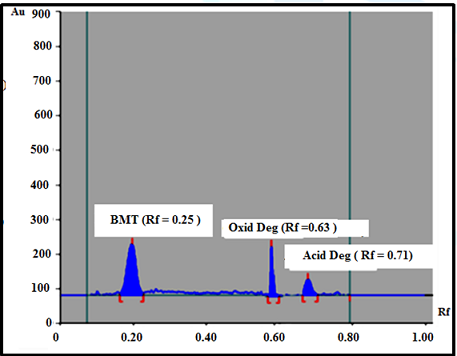
Figure 1: RP-TLC Chromatogram of bimatoprost and its oxidative and acid degradants
developing system, acetonitrile-water-ammonia (4:5:1 by volumn), at ambient
temperature.
Isocratic
RP HPLC UV based method: Several mobile phase
compositions, wavelengths and temperatures were tried.
Complete separation was achieved by using, acetonitrile-water (40: 60, v/v),
C18 column, 150 mm, 5 μm, 3.9 mm i.d., flow rate 1.5 mL /min and controlled temperature
(30°C). Quantification was achieved with UV detection at 220 nm. The retention
time was 2.763, 5.769, 1.445 for BMT and acid and oxidative degradation
products respectively. The specificity of HPLC method was illustrated in Figure
2.
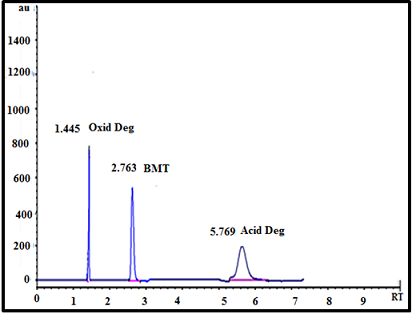
Figure 2: HPLC Chromatogram of bimatoprost
and its oxidative and acid degradants, Mobile phase, acetonitrile - water
(60:40 v/v) and detection at 220 nm at
controlled temperature (30°C).
For confirmation of degradations products (acid
& oxidative) LC- MS was used. The suggested scheme of the degradation
pathways was postulated Scheme 1. One degradation product was obtained
by each acid and oxidative stress condition.
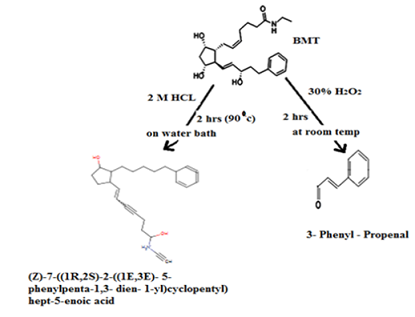
Scheme 1: Suggested scheme of degradation of bimatoprost.
Validation
of the proposed methods
Linearity,
linear relationship was found to exist between the peak areas of the
separated bands/ separated peaks and drug concentrations over the range of 0.5–6
µg/ band and 5 – 100 µg/ mL), for densitometric RP TLC and RP HPLC methods,
respectively [12,13] (Figure 3 and Table 1).
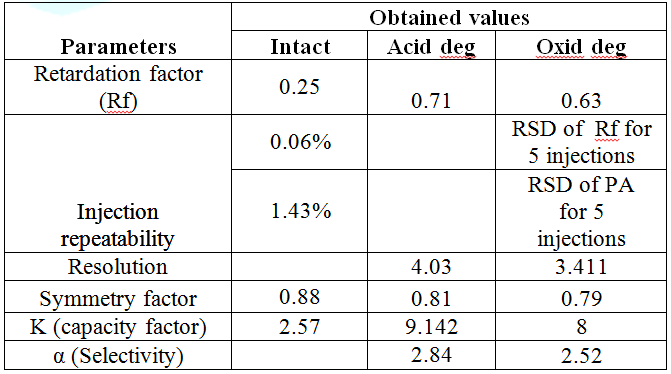
Table 1: The system suitability test results of the proposed densitometric RP-TLC
method for the determination of bimatoprost.
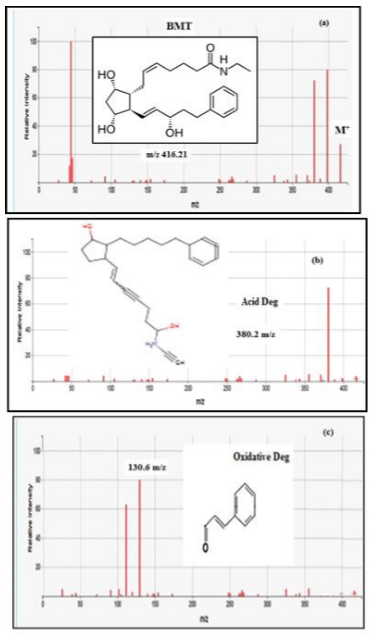
Figure 3: Mass spectra of a) BMT, (b) acid degradation, and ( c )
oxidative degradation of bimatoprost.
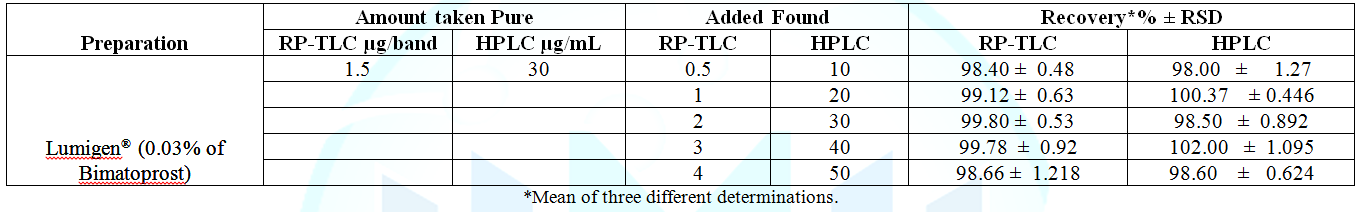
Accuracy, the previously mentioned procedures under
linearity was repeated three times for five different concentrations within the
linearity range. The concentrations were calculated from the corresponding
regression equations. The mean percentage recoveries were 98.72 ± 0.30, and
99.25 ± 0.59, for RP– TLC and RP–HPLC, respectively, as presented in Table 2.
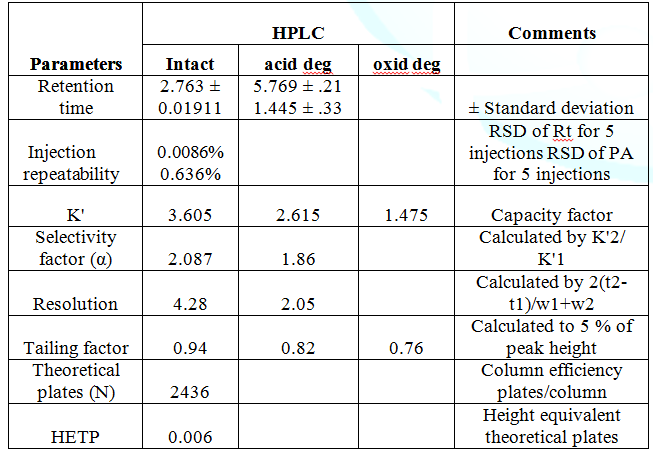
Table
2: The system suitability test results of the proposed
HPLC method for the determination of Bimatoprost.
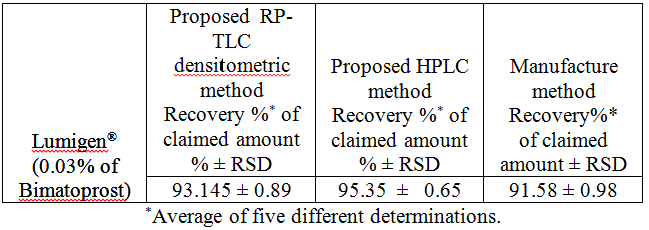
Statistical
comparison between the proposed and manufacturer methods was
performed. The results indicated no significant difference (Table 3).
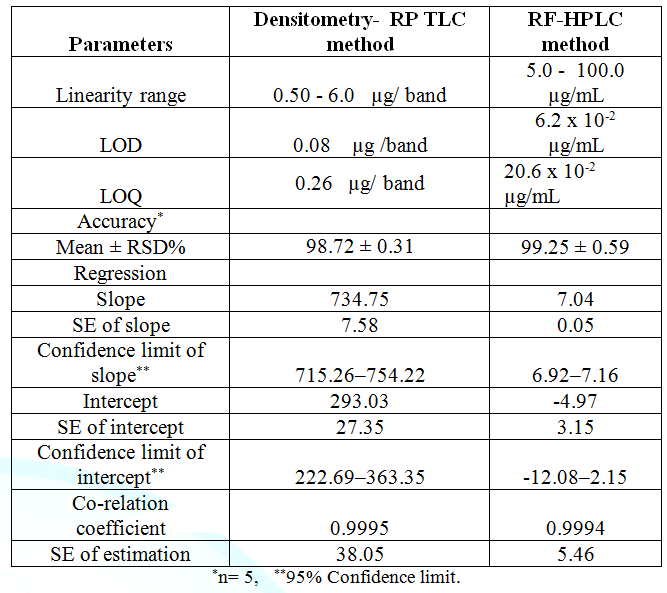
Table 3: Results of
assay validation obtained by applying the proposed densitometric-RP TLC and RP-
HPLC methods.
Precision, repeatability was assessed by analyzing
three concentration levels (0.5, 2, 4 µg/ band for RP TLC, and 5, 25, 50 µg/ mL
for HPLC) in triplicates of each sample in a single assay run. The intermediate
precision was assessed by analyzing the same concentrations in triplicate, in
three separate assay runs. The assays gave satisfactory results (Table 4).
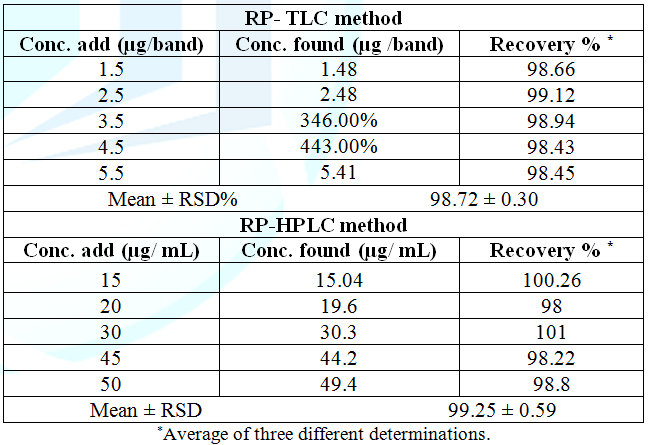
Table 4: Accuracy of the proposed methods for the determination of bimatoprost in
drug substance.
Limits
of detection and quantification, LOD
The Limits of Detection (LOD) and Quantification
(LOQ)
LOD and LOQ were calculated based on Standard
Deviation of response and Slope of calibration curve
according to ICH guidelines (ICH, 2005). LOD and LOQ were calculated from the
formula (ICH, 2005).
LOD= 3.3ϭ/S
LOQ= 10ϭ/S
Where,
ϭ = Standard deviation of the y-intercept of the
regression line
S = Slope of the calibration curve
LOD was calculated and found to be 0.08 µg/band, and
6.2 X10⁻² µg/mL for RP-TLC, and HPLC respectively. LOQ was
calculated and found to be 0.26 µg/band, and 20.6 X 10⁻² µg/ mL for
RP-TLC and HPLC respectively, as shown in Table 1.
Specificity was assessed by analyzing synthetic
mixtures of bimatoprost in presence of different concentrations of degradation
products within the quantification ranges. The percentage recoveries were
calculated (Table 5). The specificity was illustrated by high resolution
of the studied compound (Figure 2).
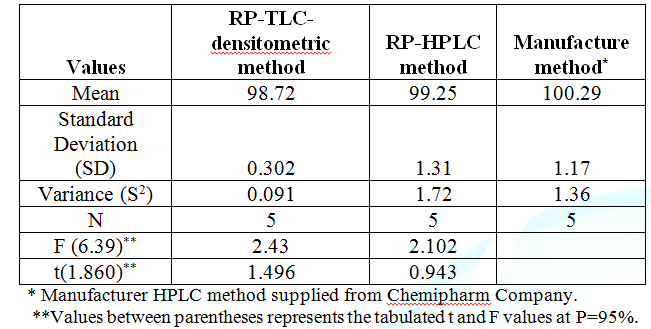
Table 5: Statistical analysis of the results obtained by the proposed methods and
manufacturer method for the
determination of bimatoprost in drug
substance.
The specificity of the proposed HPLC method was
further demonstrated by testing Peak purity. The peak purity of the cited drug
in the pharmaceutical preparation matrix spiked with its different degradation
products using DAD was illustrated in Figure 4 [14].
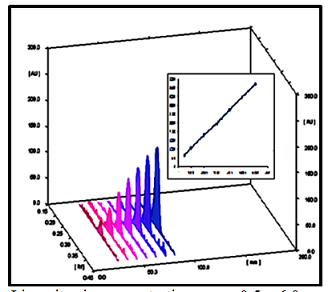
Figure 4: Linearity in concentration range
0.5 – 6.0 µg/band via densitometric
RP-TLC method of bimatoprost, developing system, acetonitrile-water: conc
ammonia (4:5:1 by volume), at ambient
temperature.
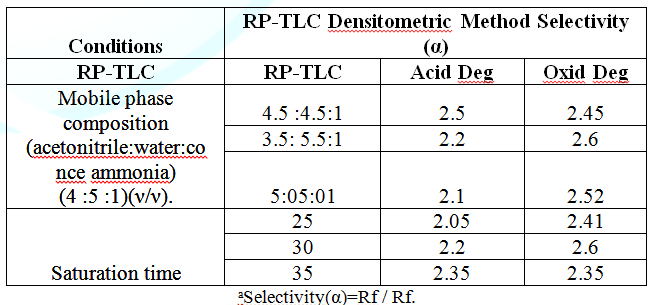
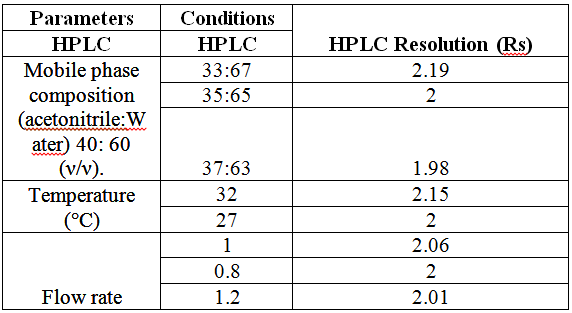
Robustness
was assessed by evaluating the influence of small variation of experimental
variables as developing system composition, saturation time and temperature on
reliability of the method. The results indicated that the ability of the method
to remain unaffected by small changes in these parameters. The RSD was less
than 2% for both methods. As presented in Tables 6 and 7.
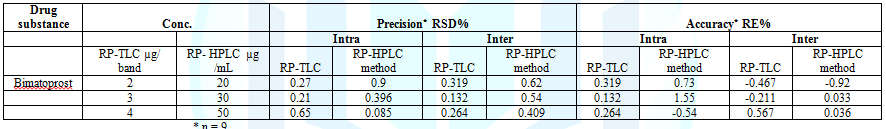
Table 6: Intra and inter-day precision and accuracy of the proposed densitometric
RP-TLC and RP-HPLC methods for determination of bimatoprost in drug substance.
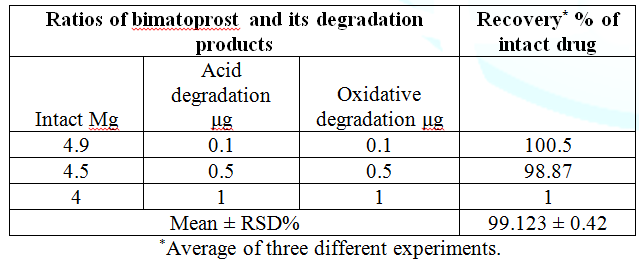
Table 7: Specificity of the proposed densitometry-RP-TLC method for the
determination of bimatoprost in laboratory prepared mixtures with its
degradants.
Conclusion
The proposed RP-TLC and RP-HPLC methods were
suggested to fulfill the aim of this work for determination of BMT in presence
of its degradation products without either pretreatment
or preliminary separation. In addition, the
proposed methods were found to be selective which showed good resolution
between the drug and its degradation products. The advantages of densitometric
- RP TLC method is that several samples can be run simultaneously using a small
quantity of mobile phase, thus lowering analysis time and cost per analysis and
provides high sensitivity and selectivity. Also it can be considered as a
stability indicating method as it is able to quantify the drug and resolve it
from its degradation products.
From the data obtained it is provide that the
proposed HPLC method is sensitive, specific, accurate, and precise over the
specified range and could be used for purity testing, stability studies,
quality control and routine
analysis of BMT in drug substance and drug products. the proposed
method provides more sensitivity, simiplicity and efficacy than other reported
methods.
From the results obtained, we concluded that the
suggested RP-TLC Densitometric method showed for
the first time determination of BMT in presence its degradations in rang 2-20%
,where neither any literature mention that application nor get that sensitivity
for the determination of BMT in drug substance , or in drug product in presence
its acid/oxidative degradation products .these methods provide high
sensitivity, accuracy and specificity. Moreover, the RP-HPLC method is simple
and inexpensive, permitting its application in quality control laboratories for
quantitative determination of the studied drug in drug substance, in drug
product as well as in presence of its mentioned degradation products.
Conflict of Interest
Walash M, Safaa. T, Nahla S and Maha M, have reviewed
the research article. They are the supervisors of that presented work, who help
me to finish my idea as it.
References
1.
Sean C Sweetman. Martindale: The Complete drug reference(2014) Pharmaceutical
Press, London, United Kingdom.
2.
Chen M, Cheng C, Chen Y, Chou C and Hsu W. Effects
of bimatoprost 0.03% on ocular hemodynamics in normal tension glaucoma (2006) J
Ocul Pharmacol Ther 22: 188-193.
3.
Brunton LL, Lazo JS, Parker KL. Goodman and Gilmans the
pharmacological basis of therapeutics (2006) McGraw-Hill, London, USA.
4.
Kruse P, Rieck P, Sherif Z and Liekfeld A. Cystoid
macular edema in a pseudophakic patient after several glaucoma procedures. Is
local therapy with bimatoprost the reason? (2006) Klin Monbl Augenheilkd 223: 534-537.
5.
Steinhäuser S. Decreased high-density lipoprotein
serum levels associated with topical bimatoprost therapy (2006) Optometry 77:
177-179.
6.
Park J, Cho HK and Moon JI. Changes to upper eyelid
orbital fat from use of topical bimatoprost, travoprost and latanoprost (2011) JOS
55: 22-27.
7.
Jayaprakasam A and Ghazi Nouri S. Periorbital fat
atrophy-an unfamiliar side effect of prostaglandin analogues (2010) Orbit 29:
357-359.
8.
Filippopoulos T, Paula J S, Torun N, Hatton M P,
Pasquale L R and et al. Periorbital changes associated with topical bimatoprost
(2008) Ophthal Plast Reconst Surg 24: 302-307.
9.
Krishna P, Thirupathi B, Raju M, Narasimha Rao, Kishore
kumar, et al. Determination of a
novel impurity by LC-MASS and chromatographic separation of bimatoprost,
isomers and their impurities by UPLC
(2011) J Pharmacy Research 4: 2381-2383.
10. Kumar S, Natraj K, Asadulla Khan and Venkateswara Rao J. Development and
Validation of RP-HPLC Method for Estimation of Bimatoprost in Pharmaceutical
Dosage Forms (2011) J Pharmacy Research 4: 3733.
11. Marchei E, De Orsi D, Guarino C, Rotolo MC, Graziano S, et al. High
performance liquid chromatography tandem mass spectrometry measurement of
bimatoprost, latanoprost and travoprost in eyelash enhancing cosmetic serums (2016)
Cosmetics 3.
12. ICH Q2A validation of analytical methods: Definitions and terminology (1994)
International conference on harmonization, Geneva.
13. ICH Q2B Validation of analytical procedure: methodology (1996)
International conferences on harmonization, Geneva.
14. El-Kosasy AM, Hussein LA, Salama NN and Sedki NG. Kinetic study and peak
purity determination of bupropion hydrochloride using RRLC/DAD and HPLC/MWD
methods: Stability study and application in pharmaceutical preparation and in
synthetic mixtures with nicotine (2015) RSC Adv 5: 64274-64285.
*Corresponding author
Maha
A Elabd, Department of Pharmaceutical Chemistry, National Organization for Drug
Control and Research, 6 Abou-Hazem st, Giza, Egypt, E-mail: mahaelabd@hotmail.com
Citation
El-Alamin M, Toubar S, Elabd AM, Salama NN and
Wallash MD. Strees degradation studies on bimatoprost and development of
validated stability indicating densitometric RP- TLC and HPLC methods (2019) Edelweiss
Pharma Analy Acta 1: 5-8.